NIFTY


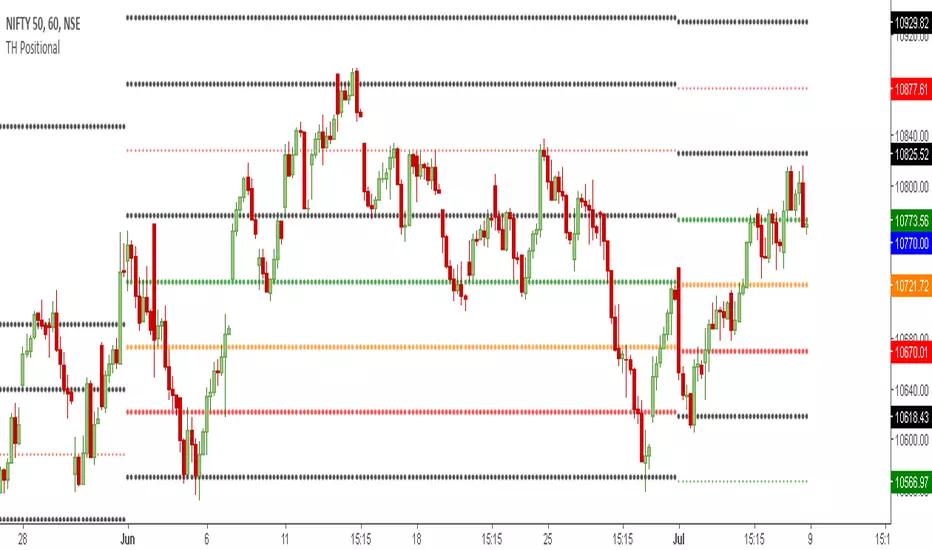
TH Positional | Buy & Sell Levels Monthly ViewTradersHunt's Positional Indicator is designed for Intraday or Monthly Positional Trading for Indian Market but it can also be used for Global Markets and Commodities . It is based on Support & Resistance Levels as per Historical Data.
The details are as follows;
Orange line is Trendsetter which means price closing above or below it will take the instrument in that direction. Green Level indicates strong buy price, and Orange level can be used as SL if trader is taking long position. Basically, a trader can use these levels as best Support and Resistance levels based on the ORB selected.
visit our website www.tradershunt.com for more information.
TH Trend | Trend Levels for the WeekTradersHunt's Trend Indicator is designed for Intraday or Weekly Positional Trading for Indian Market but it can also be used for Global Markets and Commodities . It is based on Support & Resistance Levels as per Historical Data.
The details are as follows;
Orange line is Trendsetter which means price closing above or below it will take the instrument in that direction. Green Level indicates strong buy price, and Orange level can be used as SL if trader is taking long position. Basically, a trader can use these levels as best Support and Resistance levels based on the ORB selected.
visit our website www.tradershunt.com for more information.

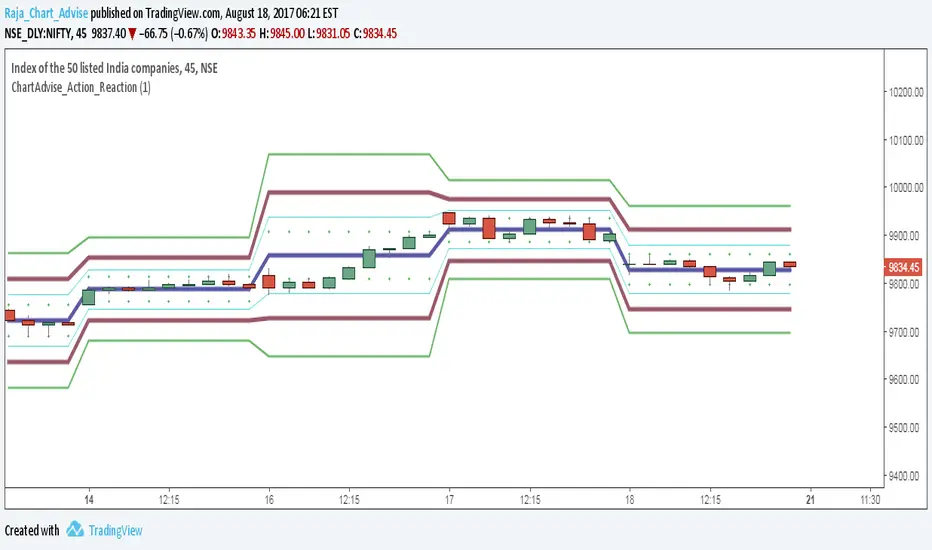
ChartAdvise_Action_ReactionThis script has finetuned the dynamic shifting of prices seen in the previous script.

RvZ - Reversal Zones Indicator..!Hello Traders...!
Yet another indicator from myself following to my previous indicator "FIRST-5-MINUTES-ZONE-AND-HI-LO-BRKOUTS",
this is TO IDENTIFY INTRADAY REVERSAL ZONES...!!!
- It works on any time frame
- along with those zones i have added two more lines Red and Green which will be used as Intraday Resistance and Support lines .
- Pls donot expect Profit and Stop points, that is upto you.
- If market goes beyond those zones well then consider that market is trading stronger. So..trade with strict stops accordingly. If the market goes beyond those zones then LOOK LEFT for the previous zones and trade.
- 80% of time, the market respects those zones.
- The zones colours are CUSTOMIZABLE
- A simple strategy to use this in confluence with,
RSI (7) Range , EMA (100)
**** If stock trading above 100 EMA, Rsi in overbought, price in upper reversal zones, then voila...get some sack ready to fill the money...!!! same goes for opposite side *****
well then Traders, Enjoy and let's put some money in Bank....!!!!!
--cheers,
Sanjay Ramanathan

NIFTY Trend OverlayThis will be useful to check with other NSE stocks and give real time updates on NIFTY trend on top of your stock of interest. The percentage change from previous day and a 3 bar immediate trend has been aggregated to show the trend

