Reversal Signal by Vahid.jafarzadehReversal Signal by Vahid.j is a technical analysis tool designed to identify potential market turning points using a combination of Donchian channels, Fibonacci levels, and multi-oscillator divergences. This indicator calculates dynamic support and resistance levels based on recent highs and lows, applies key Fibonacci retracement zones, and evaluates divergences across multiple oscillators including RSI, MACD, Momentum, CCI, OBV, Stochastic, DI Oscillator, VWMA, CMF, and MFI.
Signals are displayed as bull 🐂 and bear 🐻 icons on the chart to indicate potential buy and sell zones. The indicator also tracks the cumulative divergence count, offering a quantitative perspective of market strength and trend reversal probability.
Alerts can be set for both bullish and bearish signals, enabling timely entries and exits based on divergence and Donchian-Fibonacci confluence.
-------
فارسی :
سیگنال بازگشت توسط Vahid.j یک ابزار تحلیل تکنیکال است که برای شناسایی نقاط احتمالی تغییر جهت بازار طراحی شده و از ترکیبی از کانالهای دونچیان، سطوح فیبوناچی و واگرایی چند نوسانگر استفاده میکند. این اندیکاتور سطوح حمایت و مقاومت پویا را بر اساس بالاترین و پایینترین قیمتهای اخیر محاسبه کرده، سطوح کلیدی فیبوناچی را اعمال میکند و واگراییها را در چندین نوسانگر شامل RSI، MACD، مومنتوم، CCI، OBV، استوکاستیک، DI اسیلاتور، VWMA، CMF و MFI ارزیابی میکند.
سیگنالها به صورت آیکون گاو 🐂 و خرس 🐻 روی چارت نمایش داده میشوند تا مناطق خرید و فروش احتمالی را نشان دهند. همچنین این اندیکاتور تعداد واگراییهای تجمعی را ردیابی میکند و دید کمی نسبت به قدرت بازار و احتمال بازگشت روند ارائه میدهد.
امکان فعالسازی آلارم برای سیگنالهای صعودی و نزولی وجود دارد تا بر اساس همگرایی واگرایی و سطوح دونچیان-فیبوناچی، ورود و خروجهای به موقع انجام شود
Obvoscillator

DeltaBurst Locator ## DeltaBurst Locator
DeltaBurst Locator is a sponsorship detector that divides OBV impulse by price thrust, normalizes the ratio, and cross-checks it against a higher timeframe confirmation stream. The oscillator turns the abstract "is this move real?" question into a precise number, exposing accumulation, distribution, and exhaustion across futures and stocks.
HOW IT WORKS
OBV Impulse vs. Price Change – Smoothed deltas of On-Balance Volume and price are ratioed, then normalized using a hyperbolic tangent function to prevent single prints from dominating.
Signal vs. Confirmation – A short EMA produces the execution signal while a higher-timeframe request.security() feed validates whether broader flows agree.
Spectrum Classification – Expansion/compression metrics grade whether current aggression is intense or fading, while ±0.65 bands define exhaust/vacuum zones.
Slope Divergences – Linear regression slopes on both price and the ratio expose bullish/bearish sponsorship mismatches before candles reverse.
HOW TO USE IT
Breakout Validation : Only chase breakouts when both local and higher-timeframe ratios are on the same side of zero; mixed signals suggest liquidity is fading.
Absorption Trades : When the histogram spikes beyond ±0.65 but the EMA lags, expect absorption; combine with price structure for pinpoint reversals.
News/Event Monitoring : During earnings or macro releases, watch for ratio collapses with price still rising—this flags forced moves driven by hedging rather than real demand.
VISUAL FEATURES
Color logic: Positive sponsorship fills teal, negative fills crimson against the zero line, making intent obvious at a glance.
Optional markers: Burst triangles and divergence dots can be enabled when you need explicit annotations or left off for a minimalist panel.
Compression heatmap: Background shading communicates whether the market is coiling (high compression) or erupting (low compression).
Dashboard: Displays the live ratio, higher-timeframe ratio, and agreement state to speed up scanning across tickers.
PARAMETERS
Fast Pulse Length (default: 5): Controls the smoothing window for price change detection.
Slow Equilibrium Length (default: 34): Window for expansion/compression calculation.
OBV Smooth (default: 8): Smoothing period for OBV impulse calculation.
Ratio Ceiling (default: 3.0): Controls how aggressively values saturate; raise for high-volatility tickers.
Signal EMA (default: 4): EMA period for the signal line.
Confirmation Timeframe (default: 240): Pick a higher anchor (e.g., 4H) to validate intraday moves.
Divergence Window (default: 21): Window for slope-based divergence detection.
Show Burst Markers (default: disabled): Toggle burst triangles on demand.
Show Divergence Markers (default: disabled): Toggle divergence dots on demand.
Show Delta Dashboard (default: enabled): Hide when screen space is limited; leave on for desk broadcasts.
ALERTS
The indicator includes four alert conditions:
DeltaBurst Bull: Spotted a bullish liquidity burst
DeltaBurst Bear: Spotted a bearish liquidity burst
DeltaBurst Bull Div: Detected bullish sponsorship divergence
DeltaBurst Bear Div: Detected bearish sponsorship divergence
Hope you enjoy!

T-Virus Sentiment [hapharmonic]🧬 T-Virus Sentiment: Visualize the Market's DNA
Remember the iconic T-Virus vial from the first Resident Evil? That powerful, swirling helix of potential has always fascinated me. It sparked an idea: what if we could visualize the market's underlying health in a similar way? What if we could capture the "genetic code" of market sentiment and contain it within a dynamic, 3D indicator? This project is the result of that idea, brought to life with Pine Script.
The indicator's main goal is to measure the strength and direction of market sentiment by analyzing the "genetic code" of price action through a variety of trusted indicators. The result is displayed as a liquid level within a DNA helix, a bubble density representing buying pressure, and a T-Virus mascot that reflects the overall mood.
🧐 Core Concept: How It Works
The primary output of the indicator is the "Active %" gauge you see on the right side of the vial. This percentage represents the overall sentiment score, calculated as an average from 7 different technical analysis tools. Each tool is analyzed on every bar and assigned a score from 1 (strong bearish pressure) to 5 (strong bullish potential).
In this indicator, we re-imagine market dynamics through the lens of a viral outbreak. A strong bear market is like a virus taking hold, pulling all technical signals down into a state of weakness. Conversely, a powerful bull market is like an antiviral serum ; positive signals rise and spread toward the top of the vial, indicating that the system is being injected with strength.
This is not just another line on a chart. It's a comprehensive sentiment dashboard designed to give an immediate, at-a-glance understanding of the confluence between 7 classic technical indicators. The incredible 3D model of the vial itself was inspired by a design concept found here .
⚛️ The 4 Core Elements of T-Virus Sentiment
These four elements work in harmony to give a complete, multi-faceted picture of market sentiment. Each component tells a different part of the story.
The Virus Mascot: An instant emotional cue. This character provides the quickest possible read on the overall market mood, combining sentiment with volume pressure.
The Antiviral Serum Level: The main quantitative output. This is the liquid level in the DNA helix and the percentage gauge on the right, representing the average sentiment score from all 7 indicators.
Buy Pressure & Bubble Density: This visualizes volume flow. The density of bubbles represents the intensity of accumulation (buying) versus distribution (selling). It's the "power" behind the move.
The Signal Distribution: This shows the confluence (or dispersion) of sentiment. Are all signals bullish and clustered at the top, or are they scattered, indicating a conflicted market? The position of the indicator labels is crucial, as each is assigned to one of five distinct zones:
Base Bottom: The market is at its weakest. Signals here suggest strong bearish control and distribution.
Lower Zone: The market is still bearish, but signals may be showing early signs of accumulation or bottoming.
Neutral Core (Center): A state of balance or sideways consolidation. The market is waiting for a new direction.
Upper Zone: Bullish momentum is becoming clear. Signals are strengthening and showing bullish control.
Top Cap: The market is "heating up" with strong bullish sentiment, potentially nearing overbought conditions.
🐂🐻 The Virus Mascot: The At-a-Glance Indicator
This character acts as a shortcut to confirm market health. It combines the sentiment score with volume, preventing false confidence in a low-volume rally.
Its state is determined by a dual-check: the overall "Antiviral Serum Level" and the "Buy Pressure" must both be above 50%.
Green & Smiling: The 'all clear' signal. This means that not only is the overall technical sentiment bullish, but it's also being supported by real buying pressure. This is a sign of a healthy bull market.
Red & Angry: A warning sign. This appears if either the sentiment is weak, or a bullish sentiment is not being confirmed by buying volume. The latter could indicate a potential "bull trap" or an exhaustive move.
This mascot can be disabled from the settings page under "Virus Mascot Styling" if a cleaner look is preferred.
🫧 Bubble Density: Gauging Buy vs. Sell Pressure
The bubbles visualize the battle between buyers and sellers. There are two modes to control how this is calculated:
Mode 1: Visible Range (The 'Big Picture' View)
This default mode is best for getting a broad, contextual understanding of the current session. It dynamically analyzes the volume of every single candlestick currently visible on the screen to calculate the buy/sell pressure ratio. It answers the question: "Over the entire period I'm looking at, who is in control?" As you zoom in or out, the calculation adapts.
Mode 2: Custom Lookback (The 'Precision' View)
This mode is for traders who need to analyze short-term pressure. You can define a fixed number of recent bars to analyze, which is perfect for scalping or understanding the volume dynamics leading into a key level. It answers the question: "What is happening right now ?" In the example above, a lookback of 2 focuses only on the most recent action, clearly showing intense, immediate selling pressure (few bubbles) and a corresponding drop in the sentiment score to 29%.
ℹ️ Interactive Tooltips: Dive Deeper
We believe in transparency, not 'black box' indicators. This feature transforms the indicator from a visual aid into an active learning tool.
Simply hover the mouse over any indicator label (like EMA, OBV, etc.) to get a detailed tooltip. It will explain the specific data points and thresholds that signal met to be placed in its current zone. This helps build trust in the signals and allows users to fine-tune the indicator settings to better match their own trading style.
🎯 The Scoring Logic Breakdown
The "Antiviral Serum Level" gauge is the average score from 7 technical analysis tools. Each is graded on a 5-point scale (1=Strong Bearish to 5=Strong Bullish). Here’s a detailed, transparent look at how each "gene" is evaluated:
Relative Strength Index (RSI)
Measures momentum and overbought/oversold conditions.
Group 1 (Strong Bearish): RSI > 80 (Extreme Overbought)
Group 2 (Bearish): 70 < RSI ≤ 80 (Overbought)
Group 3 (Neutral): 30 ≤ RSI ≤ 70
Group 4 (Bullish): 20 ≤ RSI < 30 (Oversold)
Group 5 (Strong Bullish): RSI < 20 (Extreme Oversold)
Exponential Moving Averages (EMA)
Evaluates the trend's strength and structure based on the alignment of multiple EMAs (9, 21, 50, 100, 200, 250).
Group 1 (Strong Bearish): A perfect bearish sequence (9 < 21 < 50 < ...)
Group 2 (Bearish Transition): Early signs of a potential reversal (e.g., 9 > 21 but still below 50)
Group 3 (Neutral / Mixed): MAs are intertwined or showing a partial bullish sequence.
Group 4 (Bullish): A strong bullish sequence is forming (e.g., 9 > 21 > 50 > 100)
Group 5 (Strong Bullish): A perfect bullish sequence (9 > 21 > 50 > 100 > 200 > 250)
Moving Average Convergence Divergence (MACD)
Analyzes the relationship between two moving averages to gauge momentum.
Group 1 (Strong Bearish): MACD & Histogram are negative and momentum is falling.
Group 2 (Weakening Bearish): MACD is negative but the histogram is rising or positive.
Group 3 (Neutral / Crossover): A crossover event is occurring near the zero line.
Group 4 (Bullish): MACD & Histogram are positive.
Group 5 (Strong Bullish): MACD & Histogram are positive, rising strongly, and accelerating.
Average Directional Index (ADX)
Measures trend strength, not direction. The score is based on both ADX value and the dominance of DI+ vs DI-.
Group 1 (Bearish / No Trend): ADX < 20 and DI- is dominant.
Group 2 (Developing Bearish Trend): 20 ≤ ADX < 25 and DI- is dominant.
Group 3 (Neutral / Indecision): Trend is weak or DI+ and DI- are nearly equal.
Group 4 (Developing Bullish Trend): 25 ≤ ADX ≤ 40 and DI+ is dominant.
Group 5 (Strong Bullish Trend): ADX > 40 and DI+ is dominant.
Ichimoku Cloud (IKH)
A comprehensive indicator that defines support/resistance, momentum, and trend direction.
Group 1 (Strong Bearish): Price is below the Kumo, Tenkan < Kijun, and Chikou is below price.
Group 2 (Bearish): Price is inside or below the Kumo, with mixed secondary signals.
Group 3 (Neutral / Ranging): Price is inside the Kumo, often with a Tenkan/Kijun cross.
Group 4 (Bullish): Price is above the Kumo with strong primary signals.
Group 5 (Strong Bullish): All signals are aligned bullishly: price above Kumo, bullish Tenkan/Kijun cross, bullish future Kumo, and Chikou above price.
Bollinger Bands (BB)
Measures volatility and relative price levels.
Group 1 (Strong Bearish): Price is below the lower band.
Group 2 (Bearish Territory): Price is between the lower band and the basis line.
Group 3 (Neutral): Price is hovering around the basis line.
Group 4 (Bullish Territory): Price is between the basis line and the upper band.
Group 5 (Strong Bullish): Price is above the upper band.
On-Balance Volume (OBV)
Uses volume flow to predict price changes. The score is based on OBV's trend and its position relative to its moving average.
Group 1 (Strong Bearish): OBV is below its MA and falling.
Group 2 (Weakening Bearish): OBV is below its MA but showing signs of rising.
Group 3 (Neutral): OBV is very close to its MA.
Group 4 (Bullish): OBV is above its MA and rising.
Group 5 (Strong Bullish): OBV is above its MA, rising strongly, and showing signs of a volume spike.
🧭 How to Use the T-Virus Sentiment Indicator
IMPORTANT: This indicator is a sentiment dashboard , not a direct buy/sell signal generator. Its strength lies in showing confluence and providing a quick, holistic view of the market's technical health.
Confirmation Tool: Use the "Active %" gauge to confirm a trade setup from your primary strategy. For example, if you see a bullish chart pattern, a high and rising sentiment score can add confidence to your trade.
Momentum & Trend Gauge: A consistently high score (e.g., > 75%) suggests strong, established bullish momentum. A consistently low score (< 25%) suggests strong bearish control. A score hovering around 50% often indicates a ranging or indecisive market.
Divergence & Warning System: Pay attention to divergences. If the price is making new highs but the sentiment score is failing to follow or is actively decreasing, it could be an early warning sign that the underlying momentum is weakening.
⚙️ Settings & Customization
The indicator is highly customizable to fit any trading style.
Position & Anchor: Control where the vial appears on the chart.
Styling (Vial, Helix, etc.): Nearly every visual element can be color-customized.
Signals: This is where the real power is. All underlying indicator parameters (RSI length, MACD settings, etc.) can be fine-tuned to match a personal strategy. The text labels can also be disabled if the chart feels cluttered.
Enjoy visualizing the market's DNA with the T-Virus Sentiment indicator

Adaptive On Balance Volume with Trend█ Introduction
The Adaptive On Balance Volume (AOBV) indicator enhances the traditional On Balance Volume (OBV) by introducing adaptability, volatility detection, and trend analysis. It helps traders identify the direction of volume flow, assess volume momentum, and spot potential reversals in the market.
Detecting market tops and bottoms is crucial for making informed trading decisions. The AOBV indicator offers a method for identifying these points by using an adaptive volatility detection function that highlights potential volume peaks or climaxes, suggesting when a price top or bottom may be forming.
█ Understanding the AOBV
Note: Details on how calculations are conducted can be found at the end of this script description.
1. The Basics of the AOBV Function:
• Adaptive Momentum Calculation: Instead of using a fixed momentum formula, the AOBV uses the original formula for basic momentum and enhances it based on relative strength and applies an adaptive smoothing function.
• Dynamic Smoothing:
• Strong Momentum: When the AOBV detects significant changes (strong momentum), it reduces smoothing. This makes the indicator more responsive to major market movements.
• Weak Momentum: When momentum is weak (small changes), it increases smoothing to filter out market noise.
This adaptability allows the AOBV to more accurately reflect volume momentum, responding promptly during significant market moves and remaining stable during quieter periods.
To determine the trend direction (bullish or bearish), the indicator calculates a signal curve and displays the difference as bars:
• Bar Above the Middle Line: Indicates a bullish trend.
• Bar Below the Middle Line: Indicates a bearish trend.
2. Volatility Function:
The volatility function measures how much the AOBV deviates from its average by comparing it to its smoothed version. It calculates the exponential standard deviation to estimate volatility.
• Purpose: Identifies when volume momentum is near a climax or when a trend is nearing exhaustion.
• How It Works:
• Compares current volatility to previous bars.
• Computes a percentage indicating how often the current volatility is higher than past values.
• If this percentage exceeds a defined threshold, it signals a significant volatility event by plotting a dot above or below the bar.
This pattern typically manifests itself during strong runs on price followed by a period of consolidation. Thus, estimating volatility would be an acceptable measure of when a market is reaching or nearing an implied top or bottom.
3. The Trend Function:
The trend function combines several common indicators to gauge buildup toward a reversal or a continuation of a trend when the AOBV changes direction.
• Components:
• AOBV Strength Percentage: Calculates the percentage change in the AOBV to gauge its strength and direction.
• Supertrend Indicator: Acts as the main driver for trend buildup.
• Vertical Horizontal Filter (VHF): Measures market consolidation, adjusting the trend strength accordingly.
• Adaptive RSI: Further refines the trend strength based on volume momentum.
• Trend Ranking:
• Assigns a trend rank to the AOBV that reflects both market direction and momentum.
• Colors are used to represent different trend strengths: Strong Bullish, Bullish, Strong Bearish, and Bearish.
█ How to Use the AOBV
• Above the Middle Line: Suggests a bullish trend.
• Below the Middle Line: Suggests a bearish trend
• The Volatility dots:
• Indicate strong momentum relative to previous bars.
• Signal that the trend may be nearing a climax or exhaustion.
• Can imply a potential market top or bottom.
• Consolidation can be detected by visually comparing current bars to previous ones. This should be obvious since, and as described, the AOBV bars represent volume momentum.
• The trend function is used to gauge the likelihood of a reversal or a continuation of a trend; trend is represented with several colors: strong bullish trend, bullish trend, strong bearish trend, and finally simply a bearish trend.
It is important to understand that this trend function is not the typical trend function found on other technical indicators. It must be viewed within the context of the AOBV momentum. For example, if AOBV is exerting a bullish trend (bars above middle line), then a bearish trend with no major change in momentum and no volatility indication could mean a false reversal. Conversely, a large charge in AOBV could be a strong indication of a market reversal.
█ Key Features
• Two Display Modes: Curve and Bars:
The Adaptive OBV can be viewed in two different display modes: Curve and Bars Mode. "Curve Mode" offers the classic OBV representation (but as AOBV) with trend, while "Bars Mode" incorporates volatility detection and trend, making it the recommended mode.
• Volatility Function:
• Dots appear above or below the volume bars when significant volatility events are detected.
• The sensitivity can be adjusted by changing the percentage threshold.
• Trend Analysis:
• Helps gauge the likelihood of a trend continuation or reversal.
• Uses color-coded trend ranks for easy interpretation.
• Flexible Lookback Period:
Lookback periods for the main AOBV, its signal line, trend function, and volatility function can be customized.
• Recommendations:
• Match the main lookback period with the volatility period: Ensures consistency in momentum and volatility measurements.
• Match the trend lookback period with the signal AOBV lookback period: Aligns trend analysis with the underlying momentum signals.
Below is a sample demonstrating the utility on a 1- minute chart.
█ Calculation Details:
• AOBV Calculations
The AOBV differs the traditional OBV by focusing on the differences in OBV values rather than absolute price movements. Initially, it calculates the standard OBV by accumulating volume based on whether the closing price is higher or lower than the previous close. Next, it computes the difference between the current OBV and the previous OBV to measure changes in volume momentum. It calculates the average net change and average total change of these OBV differences over a specified period using a selected averaging method (e.g., EMA, SMA). By dividing the average net change by the average total change, it obtains a change ratio that reflects the strength and direction of volume momentum.
This change ratio is then scaled to an RSI-like value between 0 and 100, which is used to derive an adaptive smoothing factor (alpha). The alpha adjusts dynamically—when the change ratio indicates strong momentum, alpha increases, making the indicator more responsive to recent changes; when momentum is weak, alpha decreases, increasing smoothing to filter out noise.
The adaptive OBV is calculated by applying this alpha to combine the current OBV and the previous adaptive OBV value. This adaptive smoothing allows the indicator to adjust its sensitivity based on market conditions, becoming more responsive during strong momentum and more stable during weak momentum.
A smoothed OBV signal line is also computed using weighted moving averages for comparison. By analyzing the difference between the adaptive OBV and this smoothed signal line, the indicator identifies bullish or bearish trends. Positive differences suggest bullish momentum (bars above the middle line), while negative differences indicate bearish momentum (bars below the middle line).
• Volatility Calculations
The volatility function in the AOBV indicator identifies significant changes in volume momentum by estimating the variability of recent momentum shifts. It begins by calculating the difference between the AOBV and its smoothed signal line, capturing the current change in volume momentum. To assess volatility, the function employs exponential smoothing to compute adaptive averages of both the volume and the squared volume over a specified lookback period. By combining these averages, it estimates the current standard deviation of the volume momentum changes, effectively measuring how much the momentum deviates from its average level.
This estimated volatility is then compared to historical volatility values over the lookback period to determine how frequently the current volatility exceeds past levels. If the proportion of times the current volatility is higher than previous values and it surpasses a user-defined threshold, it signals a significant volatility event, indicating a potential volume climax
• Trend Calculations
As outlined earlier in description, the trend function is composed of several components:
The Supertrend indicator calculates dynamic support and resistance levels based on price movements and volatility using the Average True Range. It assesses whether the closing price is above or below these levels to determine the primary trend direction. If the price is above the Supertrend line: The market is considered to be in an uptrend. If the price is below the Supertrend line: The market is considered to be in a downtrend.
The Vertical Horizontal Filter measures the strength of the trend by comparing the price range over a period to the sum of absolute price changes. It does this by comparing the difference between the highest and lowest prices over a given period (the "vertical" movement) to the sum of the absolute differences between consecutive prices (the "horizontal" movement). A higher VHF value indicates a stronger, more directional trend, while a lower value suggests that the market is moving sideways without a clear trend.. If the VHF detects consolidation, it downgrades the trend strength indicated by the Supertrend. This prevents the trend function from overemphasizing the Supertrend's signals when the market lacks clear direction.
The Adaptive RSI Analyzes recent changes in the AOBV to identify whether volume momentum is strengthening or weakening (based on the volume percent change) correlating price movement with volume momentum. It only upgrades or downgrades on a bar by bar basis if price movement is correlating with percent change. This acts as a corrective measure against the VHF since quiet periods (consolidation) can occur between strong moves. The alpha generated from the adaptive function is the same as the one generated with the AOBV calculations.
█ Disclaimer
This script is provided for educational and informational purposes only and should not be considered financial advice. Trading financial instruments carries a high level of risk and may not be suitable for all investors. Before using this script, please consult with a qualified financial advisor to ensure it aligns with your individual circumstances. The author does not guarantee the accuracy or completeness of the script and is not responsible for any losses or damages that may occur from its use. Use this script at your own risk.

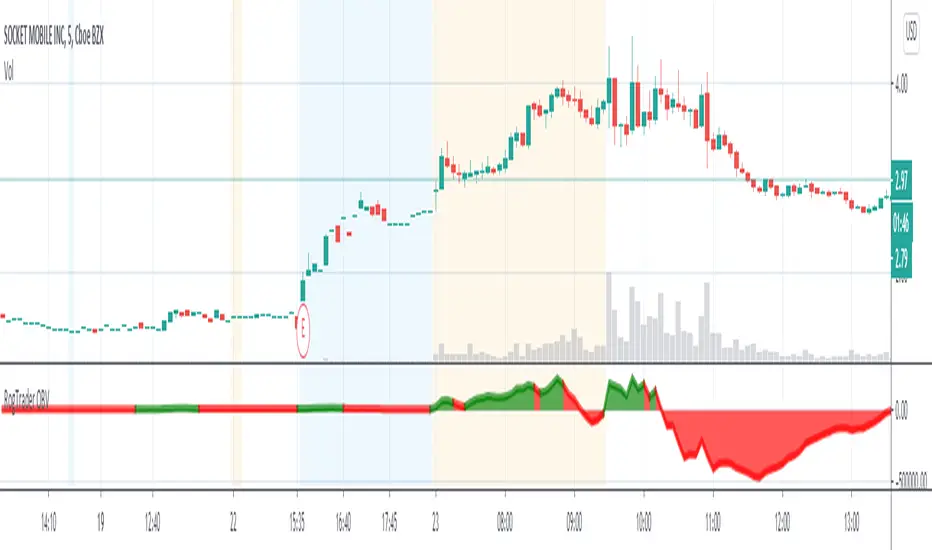
OBV Divergence Indicator [TradingFinder] On-Balance Vol Reversal🔵 Introduction
The On-Balance Volume (OBV) indicator, introduced by Joe Granville in 1963, is a powerful technical analysis tool used to measure buying and selling pressure based on trading volume and price.
By aggregating trading volume—adding it on positive days and subtracting it on negative days—OBV creates a cumulative line that reflects market volume pressure, making it valuable for confirming trends, identifying entry and exit points, and forecasting potential price movements.
Divergences between price and OBV often provide significant signals. A bearish divergence occurs when the price forms higher highs while the OBV line forms lower highs. This discrepancy indicates that upward momentum is weakening, increasing the likelihood of a downward trend.
In contrast, a bullish divergence happens when the price makes lower lows, but the OBV line forms higher lows. This suggests increasing buying pressure and the potential for an upward trend reversal.
For instance, if the price is rising but the OBV trendline is falling, it may signal a bearish divergence, warning of a possible price decline. Conversely, if the price is falling while the OBV line is rising, this could signal a bullish divergence, indicating a possible price recovery. These signals are particularly useful for identifying market turning points.
OBV often acts as a leading indicator, moving ahead of price changes. For example, a rising OBV alongside stable or declining prices can signal an impending upward breakout.
Conversely, a declining OBV with rising prices may indicate that the current uptrend is losing strength. Traders using this strategy often consider entering positions at breakout levels while setting stop losses near recent swing highs or lows to manage risk effectively.
This integration highlights how OBV divergences can provide actionable insights for predicting price movements and managing trades efficiently.
Bullish Divergence :
Bearish Divergence :
🔵 How to Use
The OBV indicator, as a cumulative tool, assists analysts in comparing volume and price changes to identify new trends and key levels for entering or exiting trades. Beyond confirming existing trends, it is particularly effective in analyzing positive and negative divergences between price and volume, providing valuable signals for trading decisions.
🟣 Bullish Divergence
A bullish divergence occurs when the price continues its downward or stable trend, but the OBV line starts rising, forming a higher low compared to its previous low. This suggests increasing volume on up days relative to down days and often signals a reversal to the upside.
For instance, if an asset's price stabilizes near a support level but the OBV line shows an upward trend, this divergence could present an opportunity to enter a long position.
🟣 Bearish Divergence
A bearish divergence occurs when the price forms higher highs, but the OBV line declines, creating lower highs compared to previous peaks. This indicates decreasing volume on up days relative to down days and often acts as a warning for a reversal to the downside.
For example, if an asset’s price approaches a resistance level while OBV starts declining, this divergence may signal the beginning of a downtrend and could indicate a good time to exit long trades or enter short positions.
🔵 Setting
Period : The "Period" setting allows you to define the number of bars or intervals for "Periodic" and "EMA" modes. A shorter period captures more short-term movements, while a longer period smooths out the fluctuations and provides a broader view of market trends.
You can enable or disable labels to highlight key levels or divergences and tables to show numerical details like values and divergence types. These options allow for a customized chart display.
🔵 Table
The following table breaks down the main features of the oscillator. It covers four critical categories: Exist, Consecutive, Divergence Quality, and Change Phase Indicator.
Exist : If divergence is detected, a "+" will appear in this row.
Consecutive: Shows the number of consecutive divergences that have formed in a short period.
Divergence Quality : Evaluates the quality of the divergence based on the number of occurrences. One is labeled "Normal," two are "Good," and three or more are considered "Strong."
Change Phase Indicator : If a phase change is detected between two oscillation peaks, this is marked in the table.
🔵 Conclusion
The OBV (On Balance Volume) indicator is a simple yet effective tool in technical analysis that combines volume and price changes to provide a comprehensive view of market buying and selling pressure. By identifying positive and negative divergences, OBV enables analysts to detect early signs of trend reversals and refine their trading strategies.
Divergences in OBV often precede price changes, making it a leading indicator for predicting market movements. Using OBV alongside other technical tools can enhance decision-making accuracy and help traders identify better entry and exit points. However, it is essential to consider the limitations of OBV, such as the potential for signal errors and the impact of sudden news events.
Ultimately, OBV serves as a complementary tool in technical analysis, aiding in trend identification, signal confirmation, and risk management. A thoughtful application of this indicator, in combination with other analytical tools, can create valuable opportunities for profiting in financial markets.

On Balance Volume WaveIntroducing an Enhanced Version of the Classic OBV Indicator
The On-Balance Volume (OBV) indicator is a well-known tool among traders, celebrated for its ability to track momentum by using volume flow to predict changes in stock price. For an overview of the original OBV indicator, please visit: www.tradingview.com .
What Makes This Version Different?
This enhanced version of the OBV indicator incorporates advanced signal processing techniques to bring new depth to market analysis. Here's what sets it apart:
Standard Deviation Bands and EMAs: These additions to the OBV offer a visual representation of significant market movements—highlighting major pumps and dumps, as well as identifying potential support and resistance levels.
Color-Coded Insights: The standard deviation bands utilize color coding based on signal processing principles. This feature becomes increasingly useful the more you zoom out, making it easier to observe and interpret market waves.
Market Maker Activity: By examining fluctuations within the standard deviation bands, traders can gauge when Market Makers are actively maneuvering to establish their long and short positions, often at the expense of retail traders.
EMA Support and Resistance: The embedded Exponential Moving Averages (EMAs) serve as dynamic support and resistance levels. Analyzing these can help traders determine the continuing strength of a market move, whether bullish or bearish.
Visual Guide to the Basics
For a clearer understanding of what this enhanced indicator can show, please refer to the image below:
And in addition to all the above one can detect relevant W and M structures way easier with this indicator ;)

On Balance Volume Heikin-Ashi Transformed
The OBV Heikin Ashi indicator is a modified version of the On-Balance Volume indicator that incorporates the Heikin Ashi transformation. This technical tool aims to provide traders with a smoother representation of volume dynamics and price trends.
The OBV Heikin Ashi indicator combines the principles of OBV and Heikin Ashi to offer insights into the volume and price behavior of an asset. Understanding OBV and Heikin Ashi individually will provide a foundation for comprehending the uniqueness and utility of this indicator.
On-Balance Volume:
OBV is a volume-based indicator that measures the cumulative buying and selling pressure in the market. It considers the relationship between volume and price movements to determine the overall strength and direction of a trend. Rising OBV values suggest bullish buying pressure, while falling values indicate bearish selling pressure.
Heikin Ashi:
Heikin Ashi is a Japanese candlestick charting technique that aims to filter out noise and provide a smoother representation of price trends. It calculates each candlestick based on the average of the previous candle's open, close, high, and low prices. Heikin Ashi candles can reveal the underlying trend more clearly by reducing market noise.
Methodology:
The 𝘖𝘉𝘝 𝘏-𝘈 indicator applies the Heikin Ashi transformation to the OBV values. Each OBV value is replaced with a Heikin Ashi equivalent, which is calculated based on the average of the previous Heikin Ashi candle's open and close prices. This transformation smooths out the OBV values and helps identify the overall trend with reduced noise. Additionaly, 2 optional EMAs are included for convergence-divergence analysis.
By applying the Heikin Ashi transformation to OBV, the indicator aims to enhance the readability of volume and trend information, providing traders with a clearer understanding of market dynamics.
Utility:
The 𝘖𝘉𝘝 𝘏-𝘈 indicator can be a valuable tool for traders and investors in analyzing volume and price trends. It offers a smoother representation of OBV values, allowing for easier identification of trend reversals, bullish or bearish market conditions, and potential trading opportunities. Traders can utilize the indicator to confirm price trends, validate support and resistance levels, and enhance their overall trading strategies.
It is worth noting that the effectiveness of the indicator may vary depending on the specific market and trading strategy. It is recommended to combine its analysis with other technical indicators and perform thorough backtesting before making trading decisions.
Key Features:
2 Adjustable EMAs
Normalized Oscillator Mode
Example Charts:
See Also:
Z-Score Heikin-Ashi Transformed

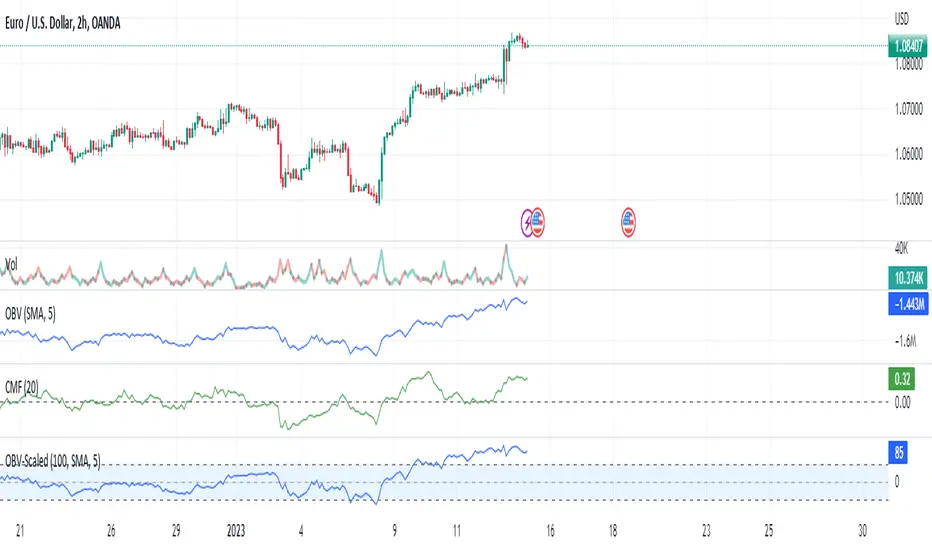
On Balance Volume Scaled - OBV ScaledThe main idea of this oscillator is to place the OBV oscillator and its oscillation around the range of 0 and around -50 to +50 and for this scaling of the "On Balance Volume" oscillator, I have used Min-max normalization.
Since this oscillator does not have a specific minimum and maximum, just setting the maximum and minimum does not seem the best thing to do. As in this case, we will constantly observe sudden changes and we will have problems such as volatility. On the one hand, we will constantly deal with sudden changes and problems such as volatility. Also on the other hand, the continuous collisions of the high/low(+50 & -50) and index and returning from that is another thing that we are going to deal with.
Therefore, to solve these problems and create more flexible maximum and minimum ranges, another similar method has been used. Choosing the maximum of our normalization to the size of the moving average of 100 candles of the index maximum and choosing the minimum of normalization to the size of the moving average of 100 candles of the minimums of the OBV index, and then normalizing the OBV index with the Min-max method with those ranges, is the recommended method ,which has been used to eliminate problems. In this case, we will not have any problem hitting 50 and returning or hitting -50 and returning. Also, our scaled OBV index will have the ability to touch and cross 50 and -50 and can fluctuate without problems.
OBV Trend Indicator by Bruno MoscanOBV Trend is a modification I made in other scripts, so that after months of testing, I got a very accurate indicator as to the right moment to enter a high-yield trade.
The red line indicates the very short-term OBV variation, counting the last 3 candles.
The yellow line shows the short-term OBV variation, counting the last 9 candles.
The white line shows the medium-term OBV variation, counting the last 21 candles.
The trend is up (Bull Market) while the order of the lines on the chart is Red/Yellow/White.
The trend is Bear Market while the order of the lines on the chart is White/Yellow/Red.
If the Yellow line is in the first position, either from bottom to top, or from top to bottom, it is a sign that the trend is changing, reversing, wait for the lines to organize before entering the movement.
When the lines are so close together that it is difficult to understand the correct order of the lines, it means that you are facing the best possible entry point. Wait for the lines to separate, at the first perfect food signal as described above, enter the movement, at this point, your stoploss may be very short, positioned at the base of the last candlestick.
The indicator works best on H1, H2, H4 and D1. In the Weekly until the signal reversal occurs, you can lose several days, sometimes weeks. On minute charts, there are many reversals and you can be stopped many times.
Good trends.
*Translate by Google Tradutor*
*In Brazil, we speack Portuguese, not Spanish or English :p *

Stochastic Slow and OBV Percent Oscillator
Purpose - Stochastic is the best momentum indicator and On Balance Volume (OBV) is the best volume indicator. Why not combine both to come up with a more sophisticated oscillator?
How It's Done - I had to put OBV as an oscillator (returning values between 0 and 100) in order to put it in the same pane with the slow stochastic oscillator. Otherwise, their synergy won't be that great. So, I have decided to visualize OBV as a percentage relative to selected period's high and low value. That way, I can keep the OBV value to stay within boundary.
Interpretation
1. Dot color indicates the whether the stochastic K/OBV is over or below the stochastic D/Signal line.
2. When Stoch and OBV are moving in the same direction and are close together (on top of each other), this indicates a strong trend
3. When Stoch crosses up or down the OBV oscillator, it may indicate a trend reversal

Ripple Momentum Indicator[LeonidasCrypto]Ripple momentum indicator.
This is indicator is not based on any other indicator.
This indicator is a momentum indicator.
How is working?
This indicator is calculating the gap in for each candle and determining the volatility of this candle . Applying WMA average we can get an idea if the volume is coming to the market or not.
Following the same theory as OBV oscillator "Volume will follow the price". This indicator will help to see if the asset is bearish or bullish based on volatility and volume.
How to trade?
Bullish/Bearish divergences
Trends:
Bellow the line 1: the asset should be considered bearish
Above the line 1: the asset should be considered bullish
Longs:
wait for the signal crossing the bands this is telling you the momentum/volume/volatility are expanding.
Shorts:
Wait for the signal crossing below the band. this is telling you the asset is losing momentum/volume/volume are expanding
Band:
This band is acting as dynamic support of resistance.

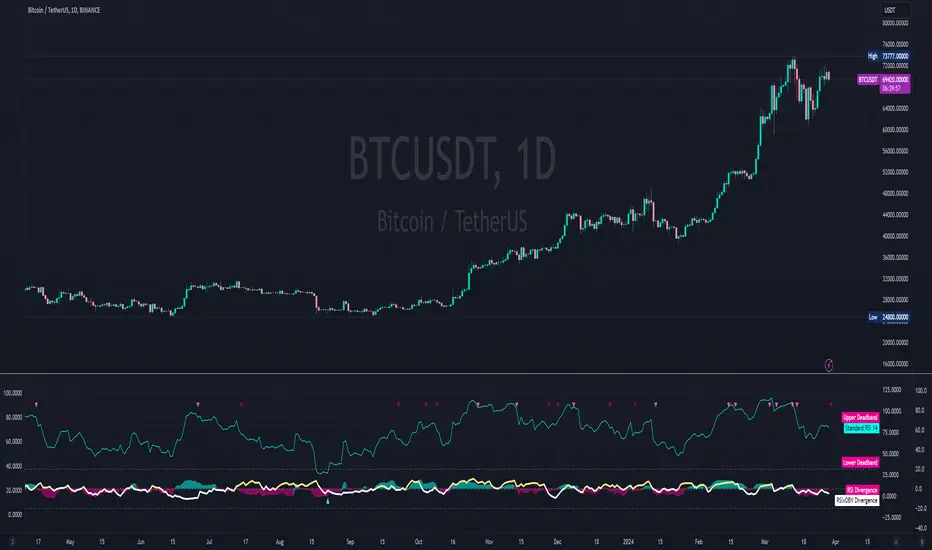
OBV Overbuy+sell Oscillator[RSU]On-balance volume (OBV) is a technical trading momentum indicator that uses volume flow to predict changes in stock price. Joseph Granville first developed the OBV metric in the 1963 book Granville's New Key to Stock Market Profits.
This indicator is based on the OBV indicator and adds 2 times the standard deviation Bollinger Band to evaluate the overbought and oversold phenomenon of the OBV indicator.
The characteristics of Bollinger Bands: According to the normal distribution phenomenon, only 5% of the cases will exceed 2 times the standard deviation of the Bollinger Bands . So when it exceeds, I use colors to mark red overbought and green oversold situations.
Usage:
1.Identify trends: Identify current stock trends by OBV's 30 average line color.
2.Breakthrough:OBV Breakthrough 30 average,signal trend may reversal.
3.Oversell and overbuy:A break below overbuy could signal a temporary end to the uptrend.
4.Divergence:When the slope of the two highs is opposite to the slope of the two highs of the indicator, a trend reversal signal may occur.

OPAL - LibraI publish my OBV script for Volumes analysis & Volumes switch spotting.
This indicator include : On Balance Volumes, 6 EMAs based on Volumes, Regular and Hidden divergences with double pivot confirmation
OBV Colors is gradient : momentums with power will turn to lighter colors, momentums without power will turn to darker colors
1) OBV : On Balance Volumes
On-balance volume (OBV) is a form of technical analysis which enables traders to make predictions about future price movements based on the asset’s previous trading volume
OBV is mostly used in shares trading, because the volume has an especially large influence on the way share prices move
Trading volume is the amount that an asset has been traded during a given time period
Traders who use OBV believe that a sharp increase in trading volume , without a reciprocal increase in the asset’s price, will cause the market price to suddenly increase or decrease
Calculation :
OBV is a cumulative result, which means that it is effectively a running total of an asset’s trading volume
The OBV is the total volume , and it accounts for both positive and negative changes in an asset’s trading volume
2) EMAs & Cloud :
A bunch of 6 EMAs adapted on volumes, the last of the 6 EMAs ( EMA 6) forms a colored cloud with the OBV Line
EMA 1 is the first filter for OBV colors
EMA6 is the last filter for OBV colors
3) Multi Divergences :
Divergence detection based on 2 pivot levels verification (taken from OPAL - Newton)
Plots Regular and Hidden Divergences
Filtered with EMA 6
4) Alerts:
Set alerts on Divergences, regular, hidden, or both
Set alerts on OBV fast Crosses with EMA 1
Set alerts on OBV slow Crosses with EMA 6
This might help you to see OBV (volumes) movements clearly, that is not a bounded indicator like RSI or stoch's
Stick with the trends)
Everything is customizable, all the settings are unlocked
Wishing you success !
<o/

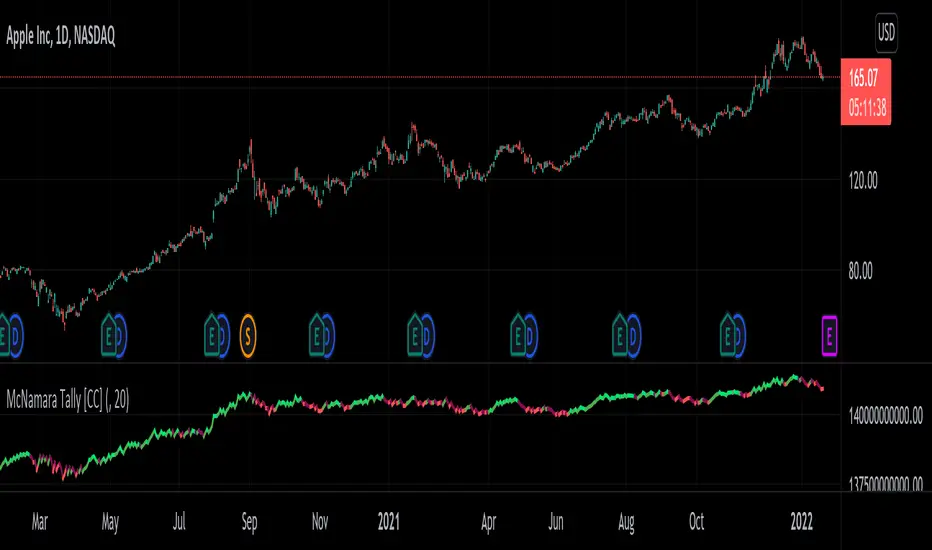
McNamara Tally [CC]The McNamara's Tally was created by Nolan McNamara (Stocks and Commodities Feb 2022 pgs 44-45) and this aims to fix the issues with both the On Balance Volume and the Accumulation/Distribution Line by using a variation of Wilder's True Range to keep track of volume flow to better differentiate between bullish volume and bearish volume. I added a signal line to this indicator to provide clear buy and sell signals since the original didn't' have any so feel free to experiment and see if you come up with a better signal system. Buy when the indicator line turns green and sell when it turns red. I have included strong buy and sell signals in addition to normal ones so stronger signals are darker in color and normal signals are lighter in color.
Let me know if there are any other indicators or scripts you would like to see me publish!
On Volume Balance Oscillator By [LeonidasCrypto]This indicator will help you to read OBV in a different way. I added rules I am following for my own system and experience.
OBV is one of the best indicators in my experience for trading.
How to trade with this indicator.
Rules:
OBV > 0 line
Market should be considered bullish
OBV< 0 Market should be considered bearish
Moving Averages:
EMA 55 (YELLOW Line) as long OBV is above this EMA and the color is GREEN the market should be considered in trending mode.
Example:
EMA 55 could work as dynamic support and resistance
Example:
EMA 100 as long OBV is above this EMA the market should be considered in long term bullish y OBV is below this EMA (RED Cloud) the market in long term is bearish.
Example:
Divergences:
This indicator is very powerful showing less divergences if we compare this indicator with others that means less fake signals.
Yellow Bar:
This indicator is using Choppiness Index to determine if the market is getting ready to move. If you see a yellow bar you should be ready for a potential move. this bar will not tell you the direction.
This indicator is following the theory of OBV "Volume should follow the price"

On-Balance Volume Oscillator with Divergence and PivotsThis is On-Balance Volume recalculated to be an Oscillator, a Divergence hunter was added, also Pivot Points and Alerts.
On-Balance Volume, or OBV is considered a "leading indicator" - in contrast to a "lagging indicator" just as Moving Averages it does not show a confirmation what already happened, but it shows what can happen in the future. For example: The chart is climbing while the OBV oscillator is slowly declining, gets weaker and weaker, maybe even prints bearish divergences? That means that a reversal might be occurring soon. Leading indicators are best paired with Stop and Resistance Lines, general Trendlines, Fib Retracements etc...Your chart is approaching a very important Resistance Trendline but the OBV shows a very positive signal? That means there is a high probability that the Resistance is going to be pushed though and becomes Support in the future.
What are those circles?
-These are Divergences. Red for Regular-Bearish. Orange for Hidden-Bearish. Green for Regular-Bullish. Aqua for Hidden-Bullish.
What are those triangles?
- These are Pivots. They show when the OBV oscillator might reverse, this is important to know because many times the price action follows this move.
Please keep in mind that this indicator is a tool and not a strategy, do not blindly trade signals, do your own research first! Use this indicator in conjunction with other indicators to get multiple confirmations.

3 Seas RSI Wave OscillatorTraditional Triple RSI Oscillator combining a Fast, Normal, and Slow RSI to achieve high accuracy entry and exit strategies. This indicator is UNIQUE because it uses a mathematical filter to trim false signals from the RSI, thus creating a reliable RSI driven entry and exit indicator represented by red and green arrows. For additional functionality divergences are identified and live plotted. UNIQUELY Alongside the 0 axis an OBV function is charted relative to the RSI to allow OBV and RSI divergences to be observed on equal mathematical scales, this is exceedingly useful to observe relative strength at pools of liquidity. The three main configured RSI's are also plotted for traditional usage case but can be removed.
Green arrow indicates a Buy opportunity optimized for standard Dollar Cost Averaging strategies.
Red arrow indicates a Sell opportunity optimized for standard Dollar Cost Averaging strategies.
Not Financial Advice.
RogTrader On Balance VolumeSmoothed, Simplified, and Color-coded OBV to easily understand the price direction.
Primarily uses Price Action, Moving Averages(EMA), and Volume
Green Zone is Uptrend
Red Zone is the Downtrend.
Confirm the direction with other indicators
Check multiple timeframes.
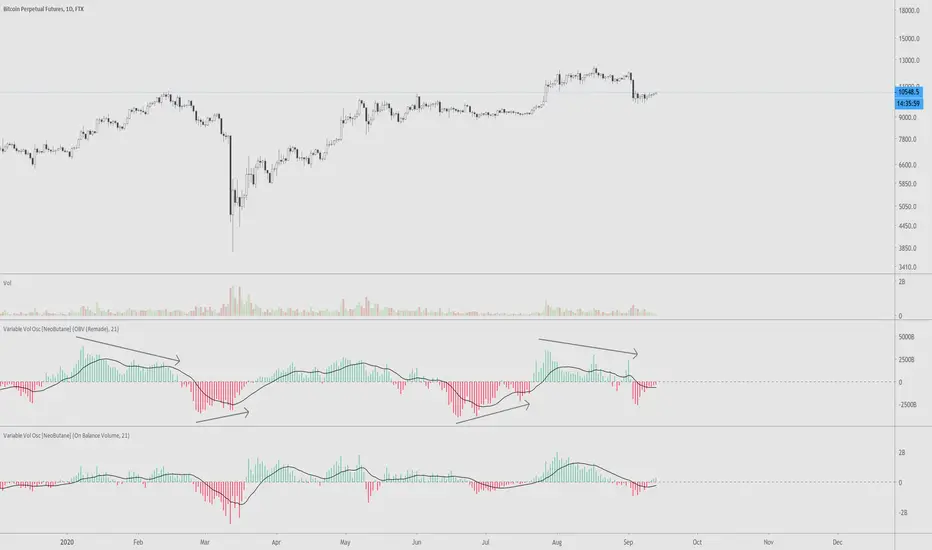
VVOscillator [nb]Multiple volume oscillators in one.
Description:
As Warren Guppet once said, be “fearful when others are buying less, and greedy when others are selling less.”
Divergences are the main point of usage of all bundled indicators.
OBV Oscillator, remade. The formula has been changed to smooth out the way OBV is calculated during a trending move
OBV Oscillator, original OBV formula.
Price Volume Trend Oscillator. Similar to OBV, except price is taken into account as well.
Price Volume Trend Oscillator, log.
Accumulation/Distribution. (close - low) - (high - close) / (high - low), then multiplied by volume
Chaikin Money Flow . Very similar to accum/dist except it was already made into an oscillator.
OBV just by itself. Change style to line for easier interpretation.
Experimental function that utilizes a part of CCI
This is the unedited "Variable Volume Oscillator v1" released for free use. In the time since I've created it, I've realized it's something I'd like to share because I like it and hope you will too.
On Balance Volume Flow (Expo)On Balance Volume Flow (Expo) identifies buying and selling pressure at extreme points. On Balance Volume Flow (Expo) is primarily used to identify potential turning points and areas of congestion.
Vwap can be enabled as an input source instead of using Volume.
The indicator can be used standalone or as a part of your current trading strategy.
HOW TO USE
1. Use the indicator to identify potential turning points and areas of congestion.
2. Use the indicator to get a feel of how price movements and volume are related.
INDICATOR IN ACTION
1-hour chart
Works on any market
I hope you find this indicator useful , and please comment or contact me if you like the script or have any questions/suggestions for future improvements. Thanks!
I will continually work on this indicator, so please share your experience and feedback as it will enable me to make even better improvements. Thanks to everyone that has already contacted me regarding my scripts. Your feedback is valuable for future developments!
ACCESS THE INDICATOR
• Contact me on TradingView or use the links below
-----------------
Disclaimer
Copyright by Zeiierman.
The information contained in my scripts/indicators/ideas does not constitute financial advice or a solicitation to buy or sell any securities of any type. I will not accept liability for any loss or damage, including without limitation any loss of profit, which may arise directly or indirectly from the use of or reliance on such information.
All investments involve risk, and the past performance of a security, industry, sector, market, financial product, trading strategy, or individual’s trading does not guarantee future results or returns. Investors are fully responsible for any investment decisions they make. Such decisions should be based solely on an evaluation of their financial circumstances, investment objectives, risk tolerance, and liquidity needs.
My scripts/indicators/ideas are only for educational purposes!

On Balance Volume Disparity IndicatorThe On Balance Volume Disparity Indicator was created by Phillip C. Holt (Stocks & Commodities V. 14:6 (265-269)). This converts the classic OBV indicator into Bollinger Bands and calculates the percentage of where the value lies within the Bollinger Bands. Buy when the obvdi rises above its signal line and sell when it falls below the signal line.
This was a special request so let me know what other indicators you would like me to write scripts for!

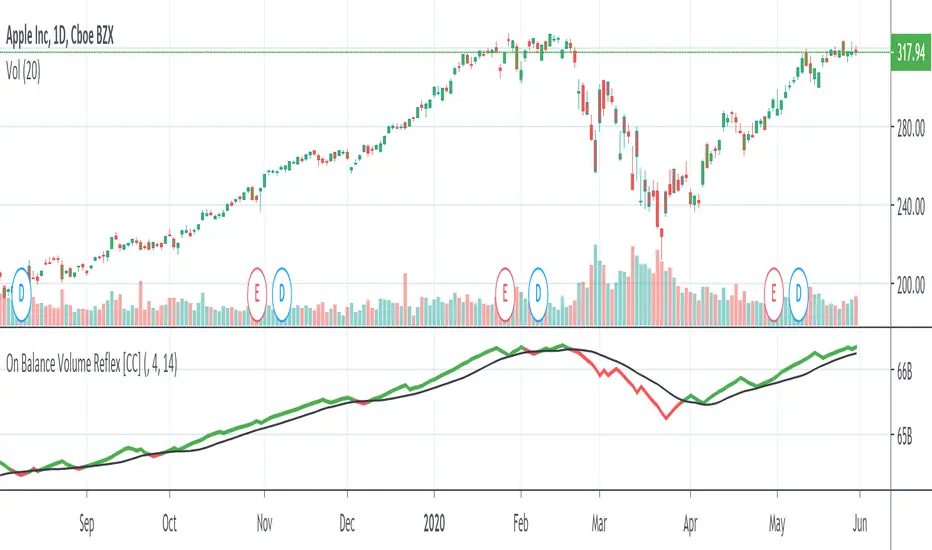
On Balance Volume ReflexThe On Balance Volume Reflex Indicator was developed by Fred Purifoy (Stocks & Commodities V 6:4 142-144) and it is similar in calculation to the On Balance Volume indicator but uses a lookback period for the change comparisons. Buy when the OVR is above the signal and sell when it falls below the signal.
I have included my On Balance Volume Modified Indicator to highlight the differences between both indicators.
Let me know if you would like to see me write scripts for more indicators!
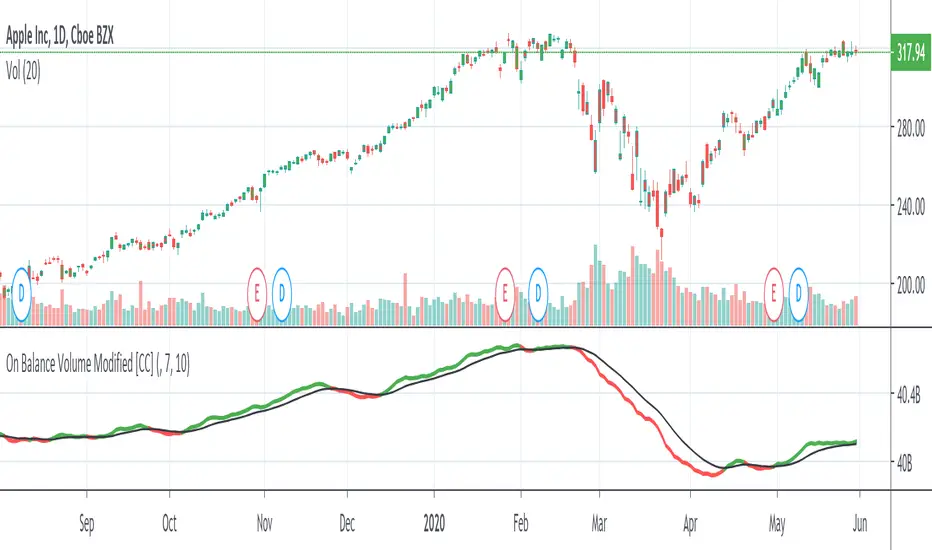
On Balance Volume ModifiedHere is a smoothed version of the classic OBV indicator with a signal line. You can use it to look for signal line crossovers and divergences. The signal line is a 10-day EMA of the OBVM line. Typically, the signal line can vary from 10 to 50.
This was just published by Vitali Apirine in the latest issue of Stocks & Commodities (April 2020) p22-25
Please let me know if you want me to publish any other indicators or if you have any questions!