Open Interest Z-Score [BackQuant]Open Interest Z-Score
A standardized pressure gauge for futures positioning that turns multi venue open interest into a Z score, so you can see how extreme current positioning is relative to its own history and where leverage is stretched, decompressing, or quietly re loading.
What this is
This indicator builds a single synthetic open interest series by aggregating futures OI across major derivatives venues, then standardises that aggregated OI into a rolling Z score. Instead of looking at raw OI or a simple change, you get a normalized signal that says "how many standard deviations away from normal is positioning right now", with optional smoothing, reference bands, and divergence detection against price.
You can render the Z score in several plotting modes:
Line for a clean, classic oscillator.
Colored line that encodes both sign and momentum of OI Z.
Oscillator histogram that makes impulses and compressions obvious.
The script also includes:
Aggregated open interest across Binance, Bybit, OKX, Bitget, Kraken, HTX, and Deribit, using multiple contract suffixes where applicable.
Choice of OI units, either coin based or converted to USD notional.
Standard deviation reference lines and adaptive extreme bands.
A flexible smoothing layer with multiple moving average types.
Automatic detection of regular and hidden divergences between price and OI Z.
Alerts for zero line and ±2 sigma crosses.
Aggregated open interest source
At the core is the same multi venue OI aggregation engine as in the OI RSI tool, adapted from NoveltyTrade's work and extended for this use case. The indicator:
Anchors on the current chart symbol and its base currency.
Loops over a set of exchanges, gated by user toggles:
Binance.
Bybit.
OKX.
Bitget.
Kraken.
HTX.
Deribit.
For each exchange, loops over several contract suffixes such as USDT.P, USD.P, USDC.P, USD.PM to cover the common perp and margin styles.
Requests OI candles for each exchange plus suffix pair into a small custom OI type that carries open, high, low and close of open interest.
Converts each OI stream into a common unit via the sw method:
In COIN mode, OI is normalized relative to the coin.
In USD mode, OI is scaled by price to approximate notional.
Exchange specific scaling factors are applied where needed to match contract multipliers.
Accumulates all valid OI candles into a single combined OI "candle" by summing open, high, low and close across venues.
The result is oiClose , a synthetic close for aggregated OI that represents cross venue positioning. If there is no valid OI data for the symbol after this process, the script throws a clear runtime error so you know the market is unsupported rather than quietly plotting nonsense.
How the Z score is computed
Once the aggregated OI close is available, the indicator computes a rolling Z score over a configurable lookback:
Define subject as the aggregated OI close.
Compute a rolling mean of this subject with EMA over Z Score Lookback Period .
Compute a rolling standard deviation over the same length.
Subtract the mean from the current OI and divide by the standard deviation.
This gives a raw Z score:
oi_z_raw = (subject − mean) ÷ stdDev .
Instead of plotting this raw value directly, the script passes it through a smoothing layer:
You pick a Smoothing Type and Smoothing Period .
Choices include SMA, HMA, EMA, WMA, DEMA, RMA, linear regression, ALMA, TEMA, and T3.
The helper ma function applies the chosen smoother to the raw Z score.
The result is oi_z , a smoothed Z score of aggregated open interest. A separate EMA with EMA Period is then applied on oi_z to create a signal line ma that can be used for crossovers and trend reads.
Plotting modes
The Plotting Type input controls how this Z score is rendered:
1) Line
In line mode:
The smoothed OI Z score is plotted as a single line using Base Line Color .
The EMA overlay is optionally plotted if Show EMA is enabled.
This is the cleanest view when you want to treat OI Z like a standard oscillator, watching for zero line crosses, swings, and divergences.
2) Colored Line
Colored line mode adds conditional color logic to the Z score:
If the Z score is above zero and rising, it is bright green, representing positive and strengthening positioning pressure.
If the Z score is above zero and falling, it shifts to a cooler cyan, representing positive but weakening pressure.
If the Z score is below zero and falling, it is bright red, representing negative and strengthening pressure (growing net de risking or shorting).
If the Z score is below zero and rising, it is dark red, representing negative but recovering pressure.
This mapping makes it easy to see not only whether OI is above or below its historical mean, but also whether that deviation is intensifying or fading.
3) Oscillator
Oscillator mode turns the Z score into a histogram:
The smoothed Z score is plotted as vertical columns around zero.
Column colors use the same conditional palette as colored line mode, based on sign and change direction.
The histogram base is zero, so bars extend up into positive Z and down into negative Z.
Oscillator mode is useful when you care about impulses in positioning, for example sharp jumps into positive Z that coincide with fast builds in leverage, or deep spikes into negative Z that show aggressive flushes.
4) None
If you only want reference lines, extreme bands, divergences, or alerts without the base oscillator, you can set plotting to None and keep the rest of the tooling active.
The EMA overlay respects plotting mode and only appears when a visible Z score line or histogram is present.
Reference lines and standard deviation levels
The Select Reference Lines input offers two styles:
Standard Deviation Levels
Plots small markers at zero.
Draws thin horizontal lines at +1, +2, −1 and −2 Z.
Acts like a classic Z score ladder, zero as mean, ±1 as normal band, ±2 as outer band.
This mode is ideal if you want a textbook statistical framing, using ±1 and ±2 sigma as standard levels for "normal" versus "extended" positioning.
Extreme Bands
Extreme bands build on the same ±1 and ±2 lines, then add:
Upper outer band between +3 and +4 Z.
Lower outer band between −3 and −4 Z.
Dynamic fill colors inside these bands:
If the Z score is positive, the upper band fill turns red with an alpha that scales with the magnitude of |Z|, capped at a chosen max strength. Stronger deviations towards +4 produce more opaque red fills.
If the Z score is negative, the lower band fill turns green with the same adaptive alpha logic, highlighting deep negative deviations.
Opposite side bands remain a faint neutral white when not in use, so they still provide structural context without shouting.
This creates a visual "danger zone" for position crowding. When the Z score enters these outer bands, open interest is many standard deviations away from its mean and you are dealing with rare but highly loaded positioning states.
Z score as a positioning pressure gauge
Because this is a Z score of aggregated open interest, it measures how unusual current positioning is relative to its own recent history, not just whether OI is rising or falling:
Z near zero means total OI is roughly in line with normal conditions for your lookback window.
Positive Z means OI is above its recent mean. The further above zero, the more "crowded" or extended positioning is.
Negative Z means OI is below its recent mean. Deep negatives often mark post flush environments where leverage has been cleared and the market is under positioned.
The smoothing options help control how much noise you want in the signal:
Short Z score lookback and short smoothing will react quickly, suited for short term traders watching intraday positioning shocks.
Longer Z score lookback with smoother MA types (EMA, RMA, T3) give a slower, more structural view of where the crowd sits over days to weeks.
Divergences between price and OI Z
The indicator includes automatic divergence detection on the Z score versus price, using pivot highs and lows:
You configure Pivot Lookback Left and Pivot Lookback Right to control swing sensitivity.
Pivots are detected on the OI Z series.
For each eligible pivot, the script compares OI Z and price at the last two pivots.
It looks for four patterns:
Regular Bullish – price makes a lower low, OI Z makes a higher low. This can indicate selling exhaustion in positioning even as price washes out. These are marked with a line and a label "ℝ" below the oscillator, in the bullish color.
Hidden Bullish – price makes a higher low, OI Z makes a lower low. This suggests continuation potential where price holds up while positioning resets. Marked with "ℍ" in the bullish color.
Regular Bearish – price makes a higher high, OI Z makes a lower high. This is a classic warning sign of trend exhaustion, where price pushes higher while OI Z fails to confirm. Marked with "ℝ" in the bearish color.
Hidden Bearish – price makes a lower high, OI Z makes a higher high. This is often seen in pullbacks within downtrends, where price retraces but positioning stretches again in the direction of the prevailing move. Marked with "ℍ" in the bearish color.
Each divergence type can be toggled globally via Show Detected Divergences . Internally, the script restricts how far back it will connect pivots, so you do not get stray signals linking very old structures to current bars.
Trading applications
Crowding and squeeze risk
Z scores are a natural way to talk about crowding:
High positive Z in aggregated OI means the market is running high leverage compared to its own norm. If price is also extended, the risk of a squeeze or sharp unwind rises.
Deep negative Z means leverage has been cleaned out. While it can be painful to sit through, this environment often sets up cleaner new trends, since there is less one sided positioning to unwind.
The extreme bands at ±3 to ±4 highlight the rare states where crowding is most intense. You can treat these events as regime markers rather than day to day noise.
Trend confirmation and fade selection
Combine Z score with price and trend:
Bull trends with positive and rising Z are supported by fresh leverage, usually more persistent.
Bull trends with flat or falling Z while price keeps grinding up can be more fragile. Divergences and extreme bands can help identify which edges you do not want to fade and which you might.
In downtrends, deep negative Z that stays pinned can mean persistent de risking. Once the Z score starts to mean revert back toward zero, it can mark the early stages of stabilization.
Event and liquidation context
Around major events, you often see:
Rapid spikes in Z as traders rush to position.
Reversal and overshoot as liquidations and forced de risking clear the book.
A move from positive extremes through zero into negative extremes as the market transitions from crowded to under exposed.
The Z score makes that path obvious, especially in oscillator mode, where you see a block of high positive bars before the crash, then a slab of deep negative bars after the flush.
Settings overview
Z Score group
Plotting Type – None, Line, Colored Line, Oscillator.
Z Score Lookback Period – window used for mean and standard deviation on aggregated OI.
Smoothing Type – SMA, HMA, EMA, WMA, DEMA, RMA, linear regression, ALMA, TEMA or T3.
Smoothing Period – length for the selected moving average on the raw Z score.
Moving Average group
Show EMA – toggle EMA overlay on Z score.
EMA Period – EMA length for the signal line.
EMA Color – color of the EMA line.
Thresholds and Reference Lines group
Select Reference Lines – None, Standard Deviation Levels, Extreme Bands.
Standard deviation lines at 0, ±1, ±2 appear in both modes.
Extreme bands add filled zones at ±3 to ±4 with adaptive opacity tied to |Z|.
Extra Plotting and UI
Base Line Color – default color for the simple line mode.
Line Width – thickness of the oscillator line.
Positive Color – positive or bullish condition color.
Negative Color – negative or bearish condition color.
Divergences group
Show Detected Divergences – master toggle for divergence plotting.
Pivot Lookback Left and Pivot Lookback Right – how many bars left and right to define a pivot, controlling divergence sensitivity.
Open Interest Source group
OI Units – COIN or USD.
Exchange toggles for Binance, Bybit, OKX, Bitget, Kraken, HTX, Deribit.
Internally, all enabled exchanges and contract suffixes are aggregated into one synthetic OI series.
Alerts included
The indicator defines alert conditions for several key events:
OI Z Score Positive – Z crosses above zero, aggregated OI moves from below mean to above mean.
OI Z Score Negative – Z crosses below zero, aggregated OI moves from above mean to below mean.
OI Z Score Enters +2σ – Z enters the +2 band and above, marking extended positive positioning.
OI Z Score Enters −2σ – Z enters the −2 band and below, marking extended negative positioning.
Tie these into your strategy to be notified when leverage moves from normal to extended states.
Notes
This indicator does not rely on price based oscillators. It is a statistical lens on cross venue open interest, which makes it a complementary tool rather than a replacement for your existing price or volume signals. Use it to:
Quantify how unusual current futures positioning is compared to recent history.
Identify crowded leverage phases that can fuel squeezes.
Spot structural divergences between price and positioning.
Frame risk and opportunity around events and regime shifts.
It is not a complete trading system. Combine it with your own entries, exits and risk rules to get the most out of what the Z score is telling you about positioning pressure under the hood of the market.
OI

swing indicator Installation & Configuration - swing Indicator
⚙️ Parameter Configuration
"Settings" Group (General Parameters)
Show Moving Average: Show/hide the OI moving average
✅ Recommended: Enabled to visualize the trend
Helps identify if OI is above or below its average
MA Period: Moving average period (default: 20)
📊 Common values:
20: Short/medium term trend (responsive)
50: Medium term trend (balanced)
100: Long term trend (stable)
Compare with Volume: Display normalized volume in background
💡 Useful to compare OI evolution with volume
Helps identify divergences between Open interest (oi) and Volume
OI Significant Change Threshold: Detection threshold for significant changes
Available options: 10%, 15%, 20%, 25%, 30%, 40%
🎯 10-15%: High sensitivity (many signals, possible noise)
🎯 20-25%: Normal sensitivity (moderate signals, recommended)
🎯 30-40%: Low sensitivity (rare but very significant signals)
⚡ This threshold determines when green/red triangles appear
Manual OI Symbol (optional): Manually enter the OI symbol
📝 Leave empty for automatic detection
⚙️ Use only if your symbol is not automatically recognized
Manual example: COMEX:GC1!_OI for gold
"Visual Signals" Group
Show Triangles (Significant Changes): Show/hide triangles
▲ GREEN Triangle = Significant OI increase (> configured threshold)
▼ RED Triangle = Significant OI decrease (< -configured threshold)
✅ Recommended: Enabled to see important changes
💡 Disable if you find the chart too cluttered
Show Circles (MA Crossovers): Show/hide circles
● GREEN Circle = OI crosses MA upward
● RED Circle = OI crosses MA downward
✅ Recommended: Enabled if you use MA crossover strategy
💡 Disable if you focus only on OI variations
"Style" Group (Color Customization)
OI Color: Main Open Interest histogram color
Default: Blue
🎨 Customize according to your visual preferences
OI Rising: Histogram color when OI increases
Default: Transparent green
Subtle display of direction
OI Falling: Histogram color when OI decreases
Default: Transparent red
Subtle display of direction
MA Color: Moving average color
Default: Orange
Should contrast with OI color
Volume Color: Normalized volume background color
Default: Transparent gray
Discreet enough not to hinder reading
📊 Reading the Information Panel
The panel at the top right of the chart displays:
By: Alphaomega18
Indicator creator's signature
⚠️ WARNING: OI symbol not detected
Only appears if OI symbol is not automatically detected
Action: Check symbol or enter manually
Open Interest
Current Open Interest value
Format: number of contracts (e.g., 485.2K = 485,200 contracts)
Change
OI % change from previous bar
🟢 Green = OI increase
🔴 Red = OI decrease
Ex: +2.45% = OI increased by 2.45%
Threshold
Displays configured threshold for alerts
Ex: "25%" = alerts triggered at +25% or -25%
Yellow color for visibility
MA(20)
Current moving average value
Number in parentheses indicates period
Ex: MA(50) if you configured a 50 period
Signal
🟢 Strong Trend: OI > MA → Strong participation, solid trend
🔴 Weak Trend: OI < MA → Weak participation, fragile trend
🎯 Visual Signals on Chart
Triangles (Significant Changes)
▲ GREEN Triangle (bottom of chart)
Meaning: Significant OI increase
Trigger: OI increases more than configured threshold
Example: If threshold = 25%, triangle appears when OI +25% or more
📈 Interpretation: New contracts opened = growing interest
▼ RED Triangle (bottom of chart)
Meaning: Significant OI decrease
Trigger: OI decreases more than configured threshold
Example: If threshold = 25%, triangle appears when OI -25% or less
📉 Interpretation: Massive position closing = disengagement
Circles (Moving Average Crossovers)
🟢 GREEN Circle (bottom of chart)
Meaning: OI just crossed MA upward
Signal: Open interest back above its average
📊 Interpretation: Interest returning, potential trend start
🔴 RED Circle (top of chart)
Meaning: OI just crossed MA downward
Signal: Open interest back below its average
📊 Interpretation: Decreasing interest, potential weakening
🔔 Alert Configuration
Create an alert:
Right-click on chart → "Add Alert" (or ALT + A)
In "Condition", select "Open Interest"
Choose alert type from 4 available
Configure notification options
Click "Create"
Available alert types:
OI Significant Increase
Triggers when OI increases beyond configured threshold
Example: Threshold 25% → Alert if OI +25% or more
Use: Detect massive influx of new contracts
OI Significant Decrease
Triggers when OI decreases beyond configured threshold
Example: Threshold 25% → Alert if OI -25% or less
Use: Detect massive position closing
OI crosses MA up
Triggers when OI crosses its moving average upward
Condition: OI was below MA and crosses above
Use: Identify interest returning
OI crosses MA down
Triggers when OI crosses its moving average downward
Condition: OI was above MA and crosses below
Use: Identify decreasing interest
Notification configuration:
✉️ Email: Receive alert via email
📱 SMS: Receive alert via SMS (subscription required)
🔔 Popup: Notification on TradingView
📲 App: Notification on TradingView mobile app
🔗 Webhook: Send alert to external system
💡 Advanced Interpretation
Combined OI + Price Analysis:
Open InterestPriceInterpretationSuggested Action↑ Rising↑ Rising🟢 STRONG UptrendNew buyers entering, robust trend, consider long positions↑ Rising↓ Falling🔴 STRONG DowntrendNew sellers entering, bearish pressure, consider short positions↓ Falling↑ Rising📊 Short coveringClosing short positions, potentially temporary move↓ Falling↓ Falling📊 Long liquidationClosing long positions, potentially temporary move
OI vs Moving Average:
OI > MA (Signal: Strong Trend)
Open interest above its average
Market participation above normal
Trend supported by growing interest
✅ Increased confidence in market direction
OI < MA (Signal: Weak Trend)
Open interest below its average
Market participation below normal
Potentially fragile trend
⚠️ Caution: trend lacks conviction
OI vs Volume:
Rising OI + Rising Volume
New contracts + high trading activity
💪 Very strong trend signal
Falling OI + Rising Volume
Position closing + high activity
⚡ Potential reversal or massive profit-taking
Stable OI + Rising Volume
Transfer of positions between traders
🔄 Changing hands, no new commitments
🛠️ Troubleshooting
❌ Issue: "⚠️ WARNING - OI symbol not detected"
✅ Solutions:
Check contract symbol
Make sure you're on a continuous futures contract (e.g., GC1!, CL1!)
Not on a specific contract (e.g., GCZ2024)
Enter symbol manually
Go to Settings → Manual OI Symbol
Format: EXCHANGE:SYMBOL_OI
Examples:
Gold: COMEX:GC1!_OI
WTI Crude: NYMEX:CL1!_OI
Natural Gas: NYMEX:NG1!_OI
Check data availability
Not all markets have public OI data
Verify on TradingView if OI data exists
❌ Issue: No data displayed (empty chart)
✅ Solutions:
Change timeframe
OI is generally published daily
Switch to Daily (1D) or Weekly (1W)
Intraday timeframes may not have data
Check data connection
Refresh TradingView page
Check your TradingView subscription (some data requires subscription)
Test on another market
Try with gold (COMEX:GC1!) which always has OI data
If it works, problem comes from initial market
❌ Issue: Too many visual signals (cluttered chart)
✅ Solutions:
Increase detection threshold
Settings → OI Significant Change Threshold
Change from 20% to 30% or 40%
Fewer signals, but more significant
Disable some signals
Visual Signals → Uncheck "Show Triangles" or "Show Circles"
Keep only the most important signals for you
Adjust colors
Style → Reduce color opacity
Make signals more discreet visually
❌ Issue: Not enough signals
✅ Solutions:
Reduce detection threshold
Settings → OI Significant Change Threshold
Change to 10% or 15%
More signals, but beware of noise
Enable all signals
Visual Signals → Check "Show Triangles" AND "Show Circles"
Full display of all events
Reduce MA period
Settings → MA Period → Change from 20 to 10
More responsive MA = more crossovers
📈 Compatible Markets (Auto-detection)
✅ Energy (NYMEX)
CL, CL1!: WTI Crude Oil
BZ, BZ1!: Brent Crude
NG, NG1!: Natural Gas
RB, RB1!: RBOB Gasoline
HO, HO1!: Heating Oil
✅ Precious Metals (COMEX/NYMEX)
GC, GC1!: Gold
SI, SI1!: Silver
PL, PL1!: Platinum
PA, PA1!: Palladium
HG, HG1!: Copper
✅ Industrial Metals (LME)
ALI, ALI1!: Aluminum
ZNC, ZNC1!: Zinc
NI, NI1!: Nickel
✅ Agriculture - Grains (CBOT)
ZC, ZC1!: Corn
ZW, ZW1!: Wheat
ZS, ZS1!: Soybeans
ZM, ZM1!: Soybean Meal
ZL, ZL1!: Soybean Oil
ZO, ZO1!: Oats
ZR, ZR1!: Rice
✅ Agriculture - Softs (ICE)
SB, SB1!: Sugar
KC, KC1!: Coffee
CC, CC1!: Cocoa
CT, CT1!: Cotton
OJ, OJ1!: Orange Juice
✅ Livestock (CME)
LE, LE1!: Live Cattle
GF, GF1!: Feeder Cattle
HE, HE1!: Lean Hogs
✅ Other
LBS, LBS1!: Lumber (CME)
🎓 Usage Tips
For beginners:
Start with default parameters (threshold 25%, MA 20)
Enable all visual signals
Focus on liquid markets (gold, crude oil)
Observe how OI reacts to price movements
For intermediate traders:
Adjust threshold according to market volatility (15-30%)
Combine with other technical indicators
Create alerts for significant changes
Analyze OI/Price divergences
For advanced traders:
Use multiple MA periods (20, 50, 100)
Analyze OI/Volume/Price correlation
Configure alerts on multiple timeframes
Integrate into complete trading strategy
📊 Practical Example
Scenario: Gold Trading (COMEX:GC1!)
Initial setup:
Threshold: 20% (gold volatile)
MA: 20 days
All signals enabled
Timeframe: Daily (1D)
Observation:
Gold price: Uptrend
OI: ▲ Green triangle (increase of +22%)
Signal: 🟢 Strong Trend (OI > MA)
Interpretation:
New buyers massively entering
Uptrend supported by OI
Strong market conviction
Action:
✅ Long position validated by OI
Stop loss below technical support
Monitor if OI continues to increase
✨ Made by Alphaomega18

Open Interest RSI [BackQuant]Open Interest RSI
A multi-venue open interest oscillator that aggregates OI across major derivatives exchanges, converts it to coin or USD terms, and runs an RSI-style engine on that aggregated OI so you can track positioning pressure, crowding, and mean reversion in leverage flows, not just in price.
What this is
This tool is an RSI built on top of aggregated open interest instead of price. It pulls futures OI from several major exchanges, converts it into a unified unit (COIN or USD), sums it into a single synthetic OI candle, then applies RSI and smoothing to that combined series.
You can then render that Open Interest RSI in different visual modes:
Clean line or colored line for classic oscillator-style reads.
Column-style oscillator for impulse and compression views.
Flag mode that fills between OI RSI and its EMA for trend/mean reversion blends. See:
Heatmap mode that paints the panel based on OI RSI extremes, ideal for scanning. See:
On top of that it includes:
Aggregated OI source selection (Binance, Bybit, OKX, Bitget, Kraken, HTX, Deribit).
Choice of OI units (COIN or USD).
Reference lines and OB/OS zones.
Extreme highlighting for either trend or mean reversion.
A vertical OI RSI meter that acts as a quick strength gauge.
Aggregated open interest source
Under the hood, the indicator builds a synthetic open interest candle by:
Looping over a list of supported exchanges: Binance, Bybit, OKX, Bitget, Kraken, HTX, Deribit.
Looping over multiple contract suffixes (such as USDT.P, USD.P, USDC.P, USD.PM) to capture different contract types on each venue.
Requesting OI candles from each venue + contract combination for the same underlying symbol.
Converting each OI stream into a common unit: In COIN mode, everything is normalized into coin-denominated OI. In USD mode, coin OI is multiplied by price to approximate notional OI.
Summing up open, high, low and close of OI across venues into a single aggregated OI candle.
If no valid OI is available for the current symbol across all sources, the script throws a clear runtime error so you know you are on an unsupported market.
This gives you a single, exchange-agnostic open interest curve instead of being tied to one venue. That aggregated OI is then passed into the RSI logic.
How the OI RSI is calculated
The RSI side is straightforward, but it is applied to the aggregated OI close:
Compute a base RSI of aggregated OI using the Calculation Period .
Apply a simple moving average of length Smoothing Period (SMA) to reduce noise in the raw OI RSI.
Optionally apply an EMA on top of the smoothed OI RSI as a moving average signal line.
Key parameters:
Calculation Period – base RSI length for OI.
Smoothing Period (SMA) – extra smoothing on the RSI value.
EMA Period – EMA length on the smoothed OI RSI.
The result is:
oi_rsi – raw RSI of aggregated OI.
oi_rsi_s – SMA-smoothed OI RSI.
ma – EMA of the smoothed OI RSI.
Thresholds and extremes
You control three core thresholds:
Mid Point – central reference level, typically 50.
Extreme Upper Threshold – high-level OI RSI edge (for example 80).
Extreme Lower Threshold – low-level OI RSI edge (for example 20).
These thresholds are used for:
Reference lines or OB/OS zone fills.
Heatmap gradient bounds.
Background highlighting of extremes.
The Extreme Highlighting mode controls how extremes are interpreted:
None – do nothing special in extreme regions.
Mean-Rev – background turns red on high OI RSI and green on low OI RSI, framing extremes as contrarian zones.
Trend – background turns green on high OI RSI and red on low OI RSI, framing extremes as participation zones aligned with the prevailing move.
Reference lines and OB/OS zones
You can choose:
None – clean plotting without guides.
Basic Reference Lines – mid, upper and lower thresholds as simple gray horizontals.
OB/OS Levels – filled zones between:
Upper OB: from the upper threshold to 100, colored with the short/overbought color.
Lower OS: from 0 to the lower threshold, colored with the long/oversold color.
These guides help visually anchor the OI RSI within "normal" versus "extreme" regions.
Plotting modes
The Plotting Type input controls how OI RSI is drawn. All modes share the same underlying OI and RSI logic, but emphasise different aspects of the signal.
1) Line mode
This is the classic oscillator representation:
Plots the smoothed OI RSI as a simple line using RSI Line Color and RSI Line Width .
Optionally plots the EMA overlay on the same panel.
Works well when you want standard RSI-style signals on leverage flows: crosses of the midline, divergences versus price, and so on.
2) Colored Line mode
In this mode:
The OI RSI is plotted as a line, but its color is dynamic.
If the smoothed OI RSI is above the mid point, it uses the Long/OB Color .
If it is below the mid point, it uses the Short/OS Color .
This creates an instant visual regime switch between "bullish positioning pressure" and "bearish positioning pressure", while retaining the feel of a traditional RSI line.
3) Oscillator mode
Oscillator mode renders OI RSI as vertical columns around the mid level:
The smoothed OI RSI is plotted as columns using plot.style_columns .
The histogram base is fixed at 50, so bars extend above and below the mid line.
Bar color is dynamic, using long or short colors depending on which side of the mid point the value sits.
This representation makes impulse and compression in OI flows more obvious. It is especially useful when you want to focus on how quickly OI RSI is expanding or contracting around its neutral level. See:
4) Flag mode
Flag mode turns OI RSI and its EMA into a two-line band with a filled area between them:
The smoothed OI RSI and its EMA are both plotted.
A fill is drawn between them.
The fill color flips between the long color and the short color depending on whether OI RSI is above or below its EMA.
Black outlines are added to both lines to make the band clear against any background.
This creates a "flag" style region where:
Green fills show OI RSI leading its EMA, suggesting positive positioning momentum.
Red fills show OI RSI trailing below its EMA, suggesting negative positioning momentum.
Crossovers of the two lines can be read as shifts in OI momentum regime.
Flag mode is useful if you want a more structural view that combines both the level and slope behaviour of OI RSI. See:
5) Heatmap mode
Heatmap mode recasts OI RSI as a single-row gradient instead of a line:
A single row at level 1 is plotted using column style.
The color is pulled from a gradient between the lower and upper thresholds: Near the lower threshold it approaches the short/oversold color and near the upper threshold it approaches the long/overbought color.
The EMA overlay and reference lines are disabled in this mode to keep the panel clean.
This is a very compact way to track OI RSI state at a glance, especially when stacking it alongside other indicators. See:
OI RSI vertical meter
Beyond the main plot, the script can draw a small "thermometer" table showing the current OI RSI position from 0 to 100:
The meter is a two-column table with a configurable number of rows.
Row colors form an inverted gradient: red at the top (100) and green at the bottom (0).
The script clamps OI RSI between 0 and 100 and maps it to a row index.
An arrow marker "▶" is drawn next to the row corresponding to the current OI RSI value.
0 and 100 labels are printed at the ends of the scale for orientation.
You control:
Show OI RSI Meter – turn the meter on or off.
OI RSI Blocks – number of vertical blocks (granularity).
OI RSI Meter Position – panel anchor (top/bottom, left/center/right).
The meter is particularly helpful if you keep the main plot in a small panel but still want an intuitive strength gauge.
How to read it as a market pressure gauge
Because this is an RSI built on aggregated open interest, its extremes and regimes speak to positioning pressure rather than price alone:
High OI RSI (near or above the upper threshold) indicates that open interest has been increasing aggressively relative to its recent history. This often coincides with crowded leverage and a buildup of directional pressure.
Low OI RSI (near or below the lower threshold) indicates aggressive de-leveraging or closing of positions, often associated with flushes, forced unwinds or post-liquidation clean-ups.
Values around the mid point indicate more balanced positioning flows.
You can combine this with price action:
Price up with rising OI RSI suggests fresh leverage joining the move, a more persistent trend.
Price up with falling OI RSI suggests shorts covering or longs taking profit, more fragile upside.
Price down with rising OI RSI suggests aggressive new shorts or levered selling.
Price down with falling OI RSI suggests de-leveraging and potential exhaustion of the move.
Trading applications
Trend confirmation on leverage flows
Use OI RSI to confirm or question a price trend:
In an uptrend, rising OI RSI with values above the mid point indicates supportive leverage flows.
In an uptrend, repeated failures to lift OI RSI above mid point or persistent weakness suggest less committed participation.
In a downtrend, strong OI RSI on the downside points to aggressive shorting.
Mean reversion in positioning
Use thresholds and the Mean-Rev highlight mode:
When OI RSI spends extended time above the upper threshold, the crowd is extended on one side. That can set up squeeze risk in the opposite direction.
When OI RSI has been pinned low, it suggests heavy de-leveraging. Once price stabilises, a re-risking phase is often not far away.
Background colours in Mean-Rev mode help visually identify these periods.
Regime mapping with plotting modes
Different plotting modes give different perspectives:
Heatmap mode for dashboard-style use where you just need to know "hot", "neutral" or "cold" on OI flows at a glance.
Oscillator mode for short term impulses and compression reads around the mid line. See:
Flag mode for blending level and trend of OI RSI into a single banded visual. See:
Settings overview
RSI group
Plotting Type – None, Line, Colored Line, Oscillator, Flag, Heatmap.
Calculation Period – base RSI length for OI.
Smoothing Period (SMA) – smoothing on RSI.
Moving Average group
Show EMA – toggle EMA overlay (not used in heatmap).
EMA Period – length of EMA on OI RSI.
EMA Color – colour of EMA line.
Thresholds group
Mid Point – central reference.
Extreme Upper Threshold and Extreme Lower Threshold – OB/OS thresholds.
Select Reference Lines – none, basic lines or OB/OS zone fills.
Extreme Highlighting – None, Mean-Rev, Trend.
Extra Plotting and UI
RSI Line Color and RSI Line Width .
Long/OB Color and Short/OS Color .
Show OI RSI Meter , OI RSI Blocks , OI RSI Meter Position .
Open Interest Source
OI Units – COIN or USD.
Exchange toggles: Binance, Bybit, OKX, Bitget, Kraken, HTX, Deribit.
Notes
This is a positioning and pressure tool, not a complete system. It:
Models aggregated futures open interest across multiple centralized exchanges.
Transforms that OI into an RSI-style oscillator for better comparability across regimes.
Offers several visual modes to match different workflows, from detailed analysis to compact dashboards.
Use it to understand how leverage and positioning are evolving behind the price, to gauge when the crowd is stretched, and to decide whether to lean with or against that pressure. Attach it to your existing signals, not in place of them.
Also, please check out @NoveltyTrade for the OI Aggregation logic & pulling the data source!
Here is the original script:

Major exchages total Open interest & Long/Short OI trends📊 Indicator: Major Exchanges Total OI & Long/Short Trends
This Pine Script™ indicator is designed to provide a comprehensive analysis of Open Interest (OI) and Long/Short position trends across major cryptocurrency exchanges (Binance, Bybit, OKX, Bitget, HTX, Deribit). It serves as a powerful tool for traders seeking to understand market liquidity, participant positioning, and overall market sentiment.
🔑 Key Features and Functionalities
Aggregated Multi-Exchange Open Interest (OI):
Consolidates real-time Open Interest data from user-selected major cryptocurrency exchanges.
Provides a unified view of the total OI, offering insights into the collective market liquidity and the aggregate size of participants' open positions.
Visualized Combined OI Candles:
Presents the aggregated total OI data in a candlestick chart format.
Displays the Open, High, Low, and Close of the combined OI, with color variations indicating increases or decreases from the previous period. This enables intuitive visualization of OI trend shifts.
Estimated Long/Short OI and Visualization:
Calculates and visualizes estimated Long and Short position Open Interest based on the total aggregated OI data.
Estimation Logic:
Employs a sophisticated logic that considers both price changes and OI fluctuations to infer the balance between Long and Short positions. For instance, an increase in both price and OI may suggest an accumulation of Long positions, while a price decrease coupled with an OI increase might indicate growing Short positions.
Initial 50:50 Ratio:
The estimation for Long/Short OI begins with an assumption of a 50:50 ratio at the initial data point available for the selected timeframe. This establishes a neutral baseline, from which subsequent price and OI changes drive the divergence and evolution of the estimated Long/Short balance.
Flexible Visualization Options:
Allows users to display Long/Short OI data in either line or candlestick styles, with customizable color schemes. This flexibility aids in clearly discerning bullish or bearish positioning trends.
💡 Development Background
The development of this indicator stems from the critical importance of Open Interest data in the cryptocurrency derivatives market. Recognizing the limitations of analyzing individual exchange OI in isolation, the primary objective was to integrate data from leading exchanges to offer a holistic perspective on market sentiment and overall positioning dynamics.
The inclusion of the Long/Short position estimation feature is crucial for deciphering the specific directional biases of market participants, which is often not evident from raw OI data alone. This enables a deeper understanding of how positions are being accumulated or liquidated, moving beyond simple OI change analysis.
Furthermore, a key design consideration was to leverage the characteristic where the indicator's data start point dynamically adjusts with the chart's timeframe selection. This allows for the analysis of short-term Long/Short trends on shorter timeframes and long-term trends on longer timeframes. This inherent flexibility empowers traders to conduct analyses across various time scales, aligning with their diverse trading strategies.
🚀 Trading Applications
Leveraging Combined Open Interest (OI):
Trend Confirmation: A sustained increase in total OI signifies growing market interest and capital inflow, potentially confirming the strength of an existing trend. Conversely, decreasing OI may suggest diminishing participant interest or widespread position liquidation.
Validation of Price Extremes: If price forms a new high but OI fails to increase or declines, it could signal a potential trend reversal (divergence). Conversely, a sharp increase in OI during a price decline might indicate a surge in short positions or renewed selling pressure.
Identifying Volatility Triggers: Monitoring rapid shifts in OI during significant news events or market catalysts can help assess immediate market reactions and liquidity changes.
📈Utilizing Long/Short OI Trends
Assessing Market Bias: A sustained dominance or rapid increase in Long OI suggests a prevalent bullish sentiment, which could inform decisions to enter or maintain long positions. The inverse scenario indicates bearish sentiment and potential short entry opportunities.
Anticipating Squeezes: The indicator can help identify scenarios conducive to short or long squeezes. Excessive short positioning followed by a price uptick can trigger a short squeeze, leading to rapid price appreciation. Conversely, an oversupply of long positions preceding a price drop can result in a long squeeze and sharp declines.
Divergence Analysis: Divergences between price action and Long/Short OI estimates can signal potential trend reversals. For example, if price is rising but the increase in Long OI slows down or Short OI begins to grow, it may suggest weakening buying pressure.
🕔Timeframe-Specific Trend Analysis:
Shorter Timeframes (e.g., 1m, 5m, 15m): Ideal for identifying short-term shifts in participant positioning, beneficial for day trading and scalping strategies. Provides insights into immediate market reactions to price movements.
Longer Timeframes (e.g., 1h, 4h, Daily): Valuable for evaluating broader positioning trends and the sustainability or potential reversal of medium-to-long-term trends. Offers a macro perspective on Long/Short dynamics, suitable for swing trading or long-term investment strategies.
This indicator integrates complex market data, provides nuanced Long/Short position estimations, and offers multi-timeframe analytical capabilities, empowering traders to make more informed and strategic decisions.

Aggregated Open Interest Multi-Exchange (USD)This indicator aggregates Open Interest (OI) data from multiple major cryptocurrency exchanges into a single unified view in USD, using data available on TradingView. It automatically adapts to the asset you're viewing on the chart.
Features:
Aggregates OI from 7 major exchanges: Binance, Bybit, OKX, Bitget, Deribit, HTX, and Coinbase
All values converted to USD - unlike native OI which shows contracts/coins
Uses only data available on TradingView platform
Automatically detects the asset from your chart (BTC, ETH, SOL, etc.)
True apples-to-apples comparison across exchanges
Displays as candlesticks showing OI open, high, low, and close
Toggle exchanges on/off individually
Handles different contract types per exchange automatically
Why USD conversion matters:
Traditional OI indicators show values in contracts or crypto units, making it difficult to compare across exchanges. This indicator converts everything to USD, giving you the real dollar value of open positions across all exchanges.
How it works:
Simply add the indicator to any crypto perpetual futures chart. It will automatically fetch and aggregate OI data from all supported exchanges for that asset using TradingView's built-in data feeds, converting everything to USD.
Supported Exchanges:
Binance, Bybit, Bitget, HTX: USDT perpetuals
Deribit: BTC/ETH use USD contracts, others use USDC
OKX: Contract-based (automatically converted)
Coinbase: USDC perpetuals
Perfect for traders who want a comprehensive view of total market Open Interest in USD across exchanges using reliable TradingView data.

Order Flow RSI - Price / CVD / OIOrder Flow RSI blends three powerful market perspectives — Price , Cumulative Volume Delta (CVD) , and Open Interest (OI) — into one unified RSI-style oscillator.
It reveals momentum and imbalance across these data streams and highlights situations where participation, liquidity, and positioning disagree — moments that often precede reversals.
What it does
The indicator converts:
Price → RSI (classic momentum),
CVD → RSI (buy/sell pressure balance),
OI → RSI (position expansion/contraction)
…then plots all three RSIs together on the same 0–100 scale.
A fourth Consensus RSI (average of any two or all three) can optionally be shown to simplify the view.
Core logic
CVD engine – based on TradingView’s native volume-delta request.
Modes: Continuous (default, smooth line), Anchored (resets each session), Rolling window.
Open Interest – pulled automatically from the symbol’s “_OI” feed; aligns to chart timeframe for real-time flow.
RSI calculation – standard RSI applied to each data stream, optionally smoothed (SMA / EMA / RMA / WMA / VWMA).
Signals – optional background highlights when:
All three RSIs are overbought (red) or oversold (green), or
Any pair show opposite extremes (e.g., price overbought + OI oversold).
Consensus RSI – arithmetic mean of the selected RSIs, summarizing overall market tone.
Inputs overview
CVD settings: anchor period, lower-TF delta, mode, rolling length
RSI lengths: separate for price, CVD, OI
Smoothing: type + period applied to all RSIs at once
Consensus: choose which RSIs to average
Signals: enable/disable each combination; optional alerts
Levels: adjustable OB/MID/OS (default 70 / 50 / 30)
Visuals: fill between active RSIs, background highlights, level lines, colors in Style tab
How to read it
All 3 overbought (red): broad exhaustion → possible correction
All 3 oversold (green): broad depletion → possible bounce
Opposite pairs: divergence between price and participation
Price↑ but OI↓ (red) → weak rally, fading participation
Price↓ but CVD↑ (green) → hidden accumulation
Combine with structure and volume profile for confirmation.
Notes
Works best on assets with full CVD + OI data (futures, BTC, etc.).
Use Continuous CVD for smooth RSI, Anchored for session analysis.
Smoothing 2–5 EMA is a good starting point to reduce noise.
All styling (colors, line types, thickness) is adjustable in the Style tab.
Limitations & caveats
CVD requires accurate tick/volume/delta data from your data feed. Performance may differ across instruments.
OI availability varies by exchange / symbol. Where OI is absent, pairwise OI signals are not evaluated.
This indicator is a tool — it generates signals of interest, not guaranteed profitable trades. Backtest and combine with your risk rules.
Smoothing introduces lag; longer smoothing reduces noise but delays signals.
Order Flow RSI bridges traditional momentum analysis and order-flow context — giving a multi-dimensional view of when markets are truly stretched or quietly reloading.
Sometimes it works, sometimes it doesn't.

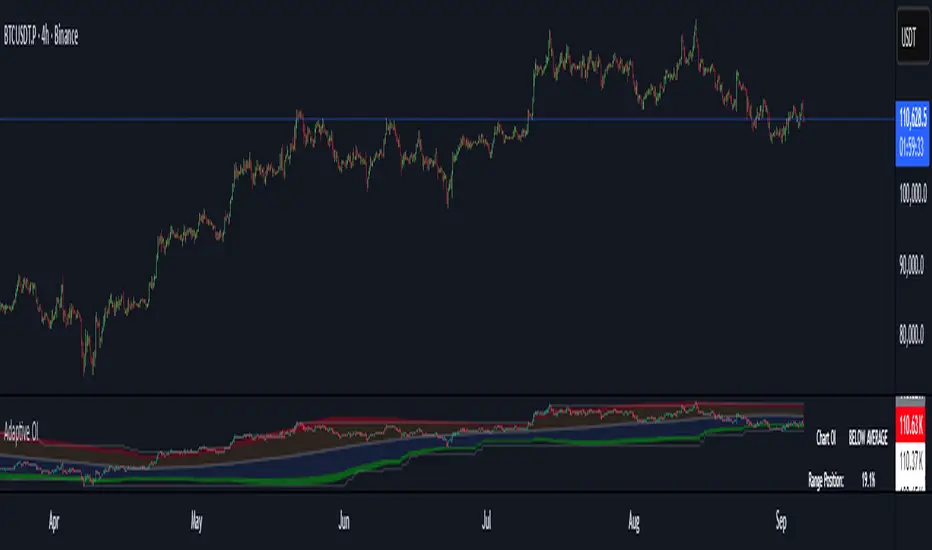
Adaptive Open InterestThis indicator analyzes Bitcoin open interest to identify overbought and oversold conditions that historically precede major price moves. Unlike static levels, it automatically adapts to current market conditions by analyzing the last 320 bars (user adjustable).
How It Works
Adaptive Algorithm:
-Analyzes the last 320 bars of open interest data
-Combines percentile analysis (90th, 80th, 20th, 10th percentiles) with statistical analysis (standard deviations)
-Creates dynamic zones that adjust as market conditions change
Four Key Zones:
🔴 Extreme Overbought (Red) - Major crash risk territory
🟠 Overbought (Orange) - Correction risk territory
🔵 Oversold (Blue) - Opportunity territory
🟢 Extreme Oversold (Green) - Major opportunity territory
For Risk Management:
-When OI enters red zones → Consider reducing long positions, major crash risk
-When OI enters orange zones → Caution, correction likely incoming
For Opportunities:
-When OI enters blue zones → Look for long opportunities
-When OI enters green zones → Strong buying opportunity, major bounce potential
The Table Shows:
-Current status (which zone OI is in)
-Range position (where current OI sits as % of 320-bar range)
-320-bar high/low levels for context
Why It's Effective:
-Adaptive Nature: What's "high" OI in a bear market differs from bull market - the indicator knows the difference and adjusts automatically.
-Proven Approach: Combines multiple statistical methods for robust signals that work across different market cycles.
-Alert System: Optional alerts notify you when OI crosses critical thresholds, so you don't miss important signals.
-The indicator essentially tells you when the futures market is getting "too crowded" (danger) or "too empty" (opportunity) relative to recent history.
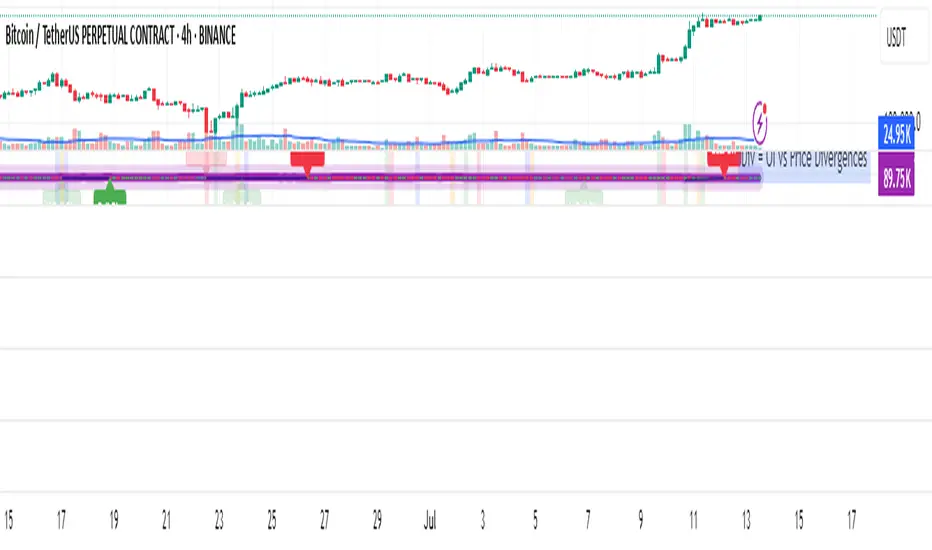
OI Analysis (Smoothed + Pivots + OI Divergence)Description
OI Pivot & Divergence Explorer is a multi-tool indicator for TradingView that blends Open Interest (OI) analysis with price action pivots and OI–price divergences. It helps you:
Visualize OI Trends: A thick, semi-transparent “glow” line shows smoothed OI changes, with a crisp center line for exact values.
Shade Momentum Scenarios: Background highlights flip between four market states—High Conviction, Squeeze, Bear Pressure, Liquidation—based on the confluence of price direction and OI spikes.
Detect Pivot Levels: Internally computes classic pivots on the OI series to mark potential turning points.
Spot OI-Price Divergences: Draws both regular and hidden bullish/bearish divergences between price pivots and corresponding OI pivots, connecting them with colored lines and labeling high-probability reversal setups.
Custom Alerts: Triggers alert conditions for each divergence type, so you can get notified of potentially actionable setups in real time.
Logic & Features
Inputs
Pivot Lookback (default 5): Number of bars on each side to qualify a pivot in both price and OI.
OI Change Smoothing (default 3) & OI Average Length (default 20): Control smoothing of raw OI delta and define the average band for threshold comparisons.
OI Change Threshold (%) (default 0.2%): Minimum relative OI change required to flag a “big” move.
Show OI Divergences (toggle on/off): Enable or disable drawing divergence lines and labels.
Scenario Shading
Computes raw OI delta → smoothed OI delta → compares against average OI.
Combines with price direction (up/down) to classify four states:
↑Price + ↑OI → High Conviction (green)
↑Price + ↓OI → Squeeze (orange)
↓Price + ↑OI → Bear Pressure (red)
↓Price + ↓OI → Liquidation (blue)
Shades the chart background only when the state flips.
Pivot Markers
Finds pivots on the OI series using the same lookback as price pivots.
(Pivot labels are removed from the visible pane; pivots now serve divergence logic.)
OI-Price Divergences
Regular Bullish: Price makes a lower low while OI makes a higher low.
Hidden Bullish: Price makes a higher low while OI makes a lower low.
Regular Bearish: Price makes a higher high while OI makes a lower high.
Hidden Bearish: Price makes a lower high while OI makes a higher high.
Connects each pivot pair with a thin line:
Regular uses dark navy
Hidden uses a lighter blue
Labels each divergence (“Bull Div,” “H Bull Div,” etc.) above or below the OI line for clarity.
How to Use
Add to Chart:
Open Pine Editor → paste the script → Save → “Add to Chart.”
Configure Inputs:
Adjust Pivot Lookback to match your timeframe: shorter (3–5) for intraday, longer (8–12) for daily/weekly.
Tweak OI Change Threshold to filter out noise or capture more subtle OI shifts.
Interpretation:
Background Color: Quick read on whether OI is reinforcing or diverging from price.
Divergence Lines: Look for regular divergences as early reversal signals; hidden divergences often indicate trend continuation or strong pullback entry points.
Alerts: Set up custom alerts on “Regular Bullish OI Divergence,” etc., to get popup/messages/notifications.
Best Practices:
Combine with your favorite price-based indicators (e.g. RSI, VWAP) for confluence.
Validate divergence signals against higher-timeframe pivots to avoid false breakouts.
Use in trending markets for continuation trades (hidden divergences) and in range markets for reversal setups (regular divergences).
Simulated OI Proxy with Trend Table1. In Simple Terms
This script mimics open interest analysis using price and volume changes.
It visually marks possible bullish and bearish setups directly on your price chart.
It’s especially useful for markets where real OI data is not available (like Indian stocks)
=======================================================================
2. Calculating Price and Volume Changes
close - close: Calculates the change in closing price from the previous bar to the current bar.
volume - volume: Calculates the change in trading volume from the previous bar to the current bar.
Purpose:
These calculations help determine if price and volume are increasing or decreasing, which is used as a proxy for open interest (OI) since real OI data may not be available.
===================================================================
3. Proxy Logic for OI Signals
long_buildup: Both price and volume are rising. This suggests new buying interest (bullish signal).
short_buildup: Price is falling but volume is rising. This suggests new short positions are being opened (bearish signal).
short_covering: Price is rising but volume is falling. This suggests shorts are closing their positions, causing a price rise (cautiously bullish).
long_unwinding: Both price and volume are falling. This suggests long positions are being closed (cautiously bearish).
====================================================================
4. Plotting the Signals
plotshape(condition, ...): Draws a shape on the chart when the condition is true.
Long Buildup: Green triangle below the bar (bullish).
Short Buildup: Red triangle above the bar (bearish).
Short Covering: Blue circle below the bar (cautiously bullish).
Long Unwinding: Orange circle above the bar (cautiously bearish).
======================================================================
5. Signal Detection:
The script checks price and volume changes to determine which signal is active.
Trend Assignment:
It assigns a text label and color for the detected trend.
Table Display:
A table appears at the top-right of your chart, showing the current trend based on the latest bar.

mrD Open InterestIntroduction
"mrD Open Interest" is a technical analysis reference tool that can help investors monitor and analyze Open Interest data from various cryptocurrency exchanges. This indicator provides insights into Open Interest data through patterns, bursts, and money flow based on proprietary algorithms.
Important Note
Trading always involves risk and can lead to capital loss. This indicator should only be used as a supplementary tool in technical analysis and should not be considered as an accurate forecasting tool or the sole basis for trading decisions. Past results do not guarantee future results.
Proprietary Features of the Indicator
"mrD Open Interest" has been developed with several proprietary features, qualifying it for source code protection when published:
- Unique Multi-Source Integration Algorithm: The indicator uses a smart aggregation method to combine OI data from multiple exchanges, creating a holistic view of market pressure that is not dependent on a single exchange. This method employs special weighting and noise filtering to ensure the aggregated data accurately reflects market conditions.
- Proprietary OI-Price Correlation Analysis Algorithm: Unlike traditional OI indicators that simply display OI values, this indicator uses a complex algorithm to analyze the correlation between price movements and OI changes. This algorithm automatically identifies four money flow patterns (Buy Inflow, Sell Inflow, Buy Outflow, Sell Outflow) and ranks them by potential market impact.
- Advanced Burst Detection Technology: The proprietary algorithm identifies "bursts" - sudden changes in OI that can lead to significant market volatility. This system relies not only on absolute change but also analyzes the rate of change, amplitude, and correlation with historical peaks/troughs to determine the significance of a burst.
- Integrated Smart Alert System: The indicator features a smart alert algorithm, only sending notifications when patterns with high statistical significance are detected, reducing "alert noise" and helping users focus on the most potential opportunities.
- Visual Representation Technology: The user interface design uses proprietary visual representation technology, allowing users to easily identify important patterns and signals through a special system of colors, icons, and display formats.
Features That May Assist
1. Reference Data from Multiple Exchanges: The indicator can collect Open Interest information from various exchanges (Binance, BitMEX, Kraken) and different currency pairs (USDT, USD, BUSD), potentially providing investors with more information about the market.
2.Money Flow Pattern Analysis: The indicator suggests 4 patterns that may help identify market conditions:
Buy Inflow: Potential opening of new long positions (price up, OI up)
Buy Outflow: Potential closing of long positions (price down, OI down)
Sell Inflow: Potential opening of new short positions (price down, OI up)
Sell Outflow: Potential closing of short positions (price up, OI down)
Burst Identification: The indicator attempts to detect "bursts" - notable changes in Open Interest that may signal changes in money flow. Bursts are divided into two types: Up Burst and Down Burst.
3. Price-OI Correlation Reference: The tool provides information about the relationship between price movement and OI changes, potentially helping to assess whether current price momentum is supported by new money flow.
4. Diverse Display Modes: The indicator offers 3 display modes (Columns, Candles, Columns, and Price Line) that may suit different analytical approaches.
Setup and Usage Guide
1. Basic Setup
Select Data Sources (Exchange Settings):
By default, the indicator uses data from Binance USDT Perpetual.
Depending on the coin pair and exchange you're interested in, you can enable/disable different data sources (Binance USD, BUSD, BitMEX USD, USDT, or Kraken).
Recommendation: For popular coins like BTC or ETH, consider combining data from 2-3 major exchanges for a more comprehensive view.
2. Display Customization (Visuals Settings):
OI Display Type: Choose a display type that suits your analysis style:
"Columns": Column format, making it easy to identify OI changes.
"Candles": Candle format, similar to price charts, helps identify candlestick patterns in OI.
"Columns and Price Line": Combines OI columns and price line, helping directly compare OI with price movements.
Show background: Enable to highlight burst periods with a colored background (recommended when using candle mode).
Show signals: Enable to display of burst indicators on the chart (recommended to keep enabled).
Text Color: Customize text color to match your chart background.
3. Alert Settings:
hoose alert types that suit your trading strategy:
"Inflows Only": Only alerts when new money flows into the market.
"Outflows Only": Only alerts when money flows out of the market.
"Bursts Only": Only alerts when there's a strong burst in OI.
"All": Alerts for all the above events.
Effective Usage
Trend Analysis Based on Money Flow Patterns:
Buy Inflow (Green): When the price increases along with OI, it may indicate new buying pressure. Can be considered as a supportive signal for an uptrend.
Sell Inflow (Red): When price decreases along with increasing OI, it may indicate new selling pressure. Can be considered as a supportive signal for a downtrend.
Buy Outflow (Teal): When price decreases but OI also decreases, it may indicate taking profit/cutting loss from long positions. Usually not strong selling pressure and may be ending soon.
Sell Outflow (Dark Red): When the price increases but OI decreases, it may indicate closing of short positions. Usually not strong buying pressure and may be ending soon.
Burst Analysis:
Up Burst: Strong and positive change in OI, most notable when occurring in a Buy Inflow pattern, may signal strong buying money flow into the market.
Down Burst: Strong and negative change in OI, most notable when occurring in a Sell Inflow pattern, may signal strong selling money flow into the market.
Bursts are often signals that deserve special attention and may indicate strong changes in market sentiment.
Using the Information Table:
Monitor "Aggregated OI" to capture the total amount of open contracts.
Pay attention to "OI Change (%)" to assess the degree of change compared to the previous candle.
"Relative OI" provides information about the relative level of OI compared to the average.
"Flow Type" indicates the current money flow pattern.
"Burst Status" displays the burst status if any.
Combining with Other Indicators:
Use in combination with trend indicators (MA, MACD) to confirm trends.
Combine with volume indicators for a more comprehensive view of market activity.
Reference additional momentum indicators to assess trend strength.
Customizing According to Timeframe:
Short timeframes (1m-15m): May show more noise signals.
Medium timeframes (30m-4h): Often provide a good balance between sensitivity and noise filtering.
Long timeframes (D-W): Suitable for monitoring long-term OI trends.

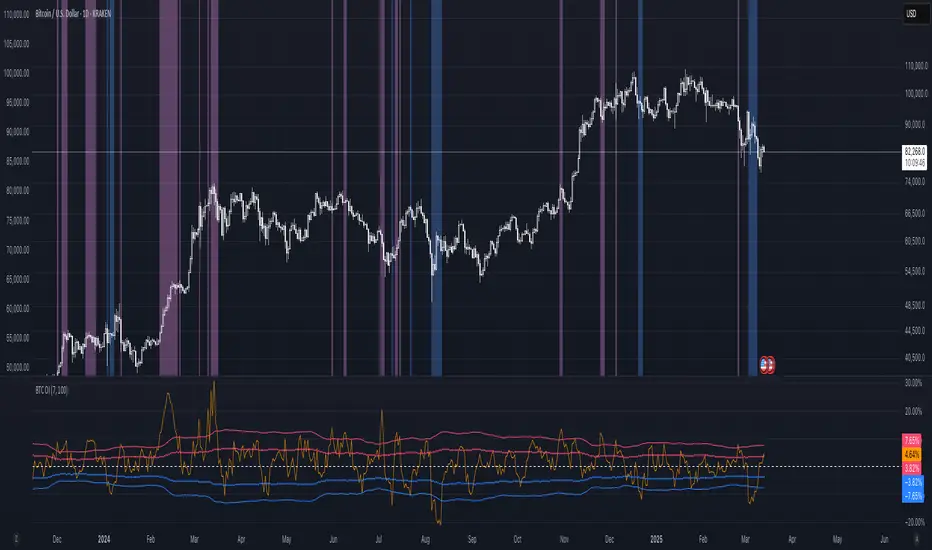
BTC: Open InterestThis indicator tracks the 7-day (default) percentage change in open interest (OI), providing insights into market participation trends. It includes customizable periods and colors, allowing traders to adjust settings for better visualization.
Open interest (OI) is the total number of active contracts (futures or options) that haven’t been closed or settled. It represents the total open positions in the market.
Thus when OI increases, more traders are entering new positions, signaling growing market interest. Conversely, when OI decreases, positions are being closed, suggesting lower trader participation or liquidation.
Attributes & Features:
Open Interest Percentage Change – Measures the 7-day % change in open interest to track market participation.
Customizable Calculation Period – Users can adjust the period (default: 7 days) for more flexible analysis.
Adjustable Colors – Allows modification of colors for better visualization.
Trend Identification – Highlights rising vs. falling open interest trends.
Works Across Assets – Can be used for cryptos, stocks, and futures with open interest data.
Overlay or Separate Panel – Can be plotted on price chart or as a separate indicator.
How It Works:
Fetches Open Interest Data – Retrieves open interest values for each day for USD, USDT, and USDC Bitcoin Perpetual Derivitives.
Calculates Percentage Change – Compares current open interest to its value X days ago (Default = 7 days).
Standard Deviation – Applies standard deviation ranging from -2 to +2 deviations to identify large shifts in OI.
Visual Alerts – Can highlight extreme increases or decreases signaling potential market shifts.
NOTE: THE INDICATOR DATA ONLY GOES BACK TO START OF 2022
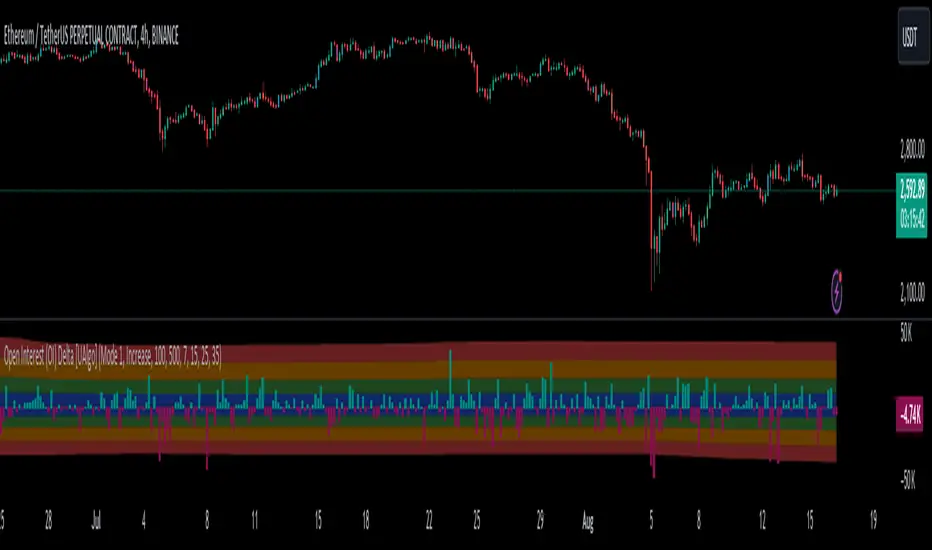
Open Interest (OI) Delta [UAlgo]The Open Interest (OI) Delta indicator is a tool designed to provide insights into the dynamics of Open Interest changes within the futures market. Open Interest (OI) refers to the total number of outstanding derivative contracts, such as options or futures, that have not been settled. The OI Delta measures the change in Open Interest over a specified period, allowing traders to assess whether new money is entering the market or existing positions are being closed.
This indicator offers two distinct display modes to visualize OI Delta, along with customizable levels that help in categorizing the magnitude of OI changes. Additionally, it provides the option to color-code the bars on the price chart based on the intensity and direction of OI Delta, making it easier for traders to interpret market sentiment and potential future price movements.
🔶 Key Features
Two Display Modes: Choose between two different modes for visualizing OI Delta, depending on your analysis preferences:
Mode 1: Displays the OI Delta directly as positive or negative values.
Mode 2: Separates positive and negative OI Delta values, displaying them as absolute values for easier comparison.
Customizable Levels: Set up to four levels of OI Delta magnitude, each with customizable thresholds and colors. These levels help categorize the OI changes into Normal, Medium, Large, and Extreme ranges, allowing for a more nuanced interpretation of market activity.
MA Length and Standard Deviation Period: Adjust the moving average length and standard deviation period for OI Delta, which smooths out the data and helps in identifying significant deviations from the norm.
Color-Coded Bar Chart: Optionally color the price bars on your chart based on the OI Delta levels, helping to visually correlate price action with changes in Open Interest.
Heatmap Display: Toggle the display of OI Delta levels on the chart, with the option to fill the areas between these levels for a more visually intuitive understanding of the data.
🔶 Interpreting Indicator
Positive vs. Negative OI Delta:
A positive OI Delta indicates that the Open Interest is increasing, suggesting that new contracts are being created, which could imply fresh capital entering the market.
A negative OI Delta suggests that Open Interest is decreasing, indicating that contracts are being closed out or settled, which might reflect profit-taking or a reduction in market interest.
Magnitude Levels:
Level 1 (Normal OI Δ): Represents typical, less significant changes in OI. If the OI Delta stays within this range, it may indicate routine market activity without any substantial shift in sentiment.
Level 2 (Medium OI Δ): Reflects a more significant change in OI, suggesting increased market interest and possibly the beginning of a new trend or phase of market participation.
Level 3 (Large OI Δ): Indicates a strong change in OI, often associated with a decisive move in the market. This could signify strong conviction among market participants, either bullish or bearish.
Level 4 (Extreme OI Δ): The highest level of OI change, often preceding major market moves. Extreme OI Δ can be a signal of potential market reversals or the final phase of a strong trend.
Color-Coded Bars:
When enabled, the color of the price bars will reflect the magnitude and direction of the OI Delta. This visual aid helps in quickly assessing the correlation between price movements and changes in market sentiment as indicated by OI.
This indicator is particularly useful for futures traders looking to gauge the strength and direction of market sentiment by analyzing changes in Open Interest. By combining this with price action, traders can gain a deeper understanding of market dynamics and make more informed trading decisions
🔶 Disclaimer
Use with Caution: This indicator is provided for educational and informational purposes only and should not be considered as financial advice. Users should exercise caution and perform their own analysis before making trading decisions based on the indicator's signals.
Not Financial Advice: The information provided by this indicator does not constitute financial advice, and the creator (UAlgo) shall not be held responsible for any trading losses incurred as a result of using this indicator.
Backtesting Recommended: Traders are encouraged to backtest the indicator thoroughly on historical data before using it in live trading to assess its performance and suitability for their trading strategies.
Risk Management: Trading involves inherent risks, and users should implement proper risk management strategies, including but not limited to stop-loss orders and position sizing, to mitigate potential losses.
No Guarantees: The accuracy and reliability of the indicator's signals cannot be guaranteed, as they are based on historical price data and past performance may not be indicative of future results.
Open Interest SThis script shows Open Interest. You can choose measure, view and highlight large OI changes based on Z-Score.
Features
Measure USD or COIN
View OI Candles or OI Change columns with wicks
Z-Score Highlight Z Length is the period for calculations, Z Threshold is the standard
deviation from the average change in OI for the selected period
Color You can change the colors for OI
Liquidation Level ScreenerThe Liquidation Level Screener is an analytical tool designed for traders who seek a comprehensive view of potential liquidation zones in the market. This script, adaptable to almost any timeframe from 1 minute to 3 days, offers a unique perspective by mapping out key liquidation levels where significant market actions could occur.
Key Features:
Multi-Exchange Data Aggregation: Unlike many other indicators, the Liquidation Levels Indicator compiles data from multiple leading exchanges including Binance, Bitmex, Kraken, and Bitfinex. This approach ensures a more holistic and accurate representation of market sentiment, providing insights into potential liquidation points across various platforms.
Customizable Timeframes and Modes: The script is versatile, working effectively across various timeframes. It operates in two distinct modes:
Actual Levels Display: Visually represents potential liquidation levels.
Settings Mode: Showcases an open interest (OI) oscillator. When OI is exceptionally high, indicating a surge in opened positions at a specific candle, it signals traders to be vigilant about upcoming liquidation levels.
Three-Tier Liquidation System: The indicator categorizes liquidation levels into three distinct tiers based on open interest levels—1, 2, and 3—with Level 3 representing the highest concentration of open positions. This tiered approach allows traders to gauge the significance of each level and adjust their strategies accordingly.
Histogram Visualization: A novel feature of this script is the histogram on the chart's right side, representing the concentration of liquidation levels in specific market zones. This visual aid helps traders identify crucial areas that warrant close attention, enhancing decision-making.
Customizable Options:
Moving Averages: Choose from a wide range of moving average types, including VWMA, SMA, EMA, and more, to tailor the indicator to your analysis style.
Histogram Settings: Adjust the number of histograms, lookback bars, and their proximity to the latest candle, allowing for a personalized density and range of visualization.
Liquidation Level Sensitivity: Set thresholds for different liquidation levels, fine-tuning the indicator to detect varying degrees of market leverage.
Color Coding: Customize the color scheme for different leverage levels, enhancing visual clarity and ease of interpretation.
The Liquidation Level Screener offers a unique edge by highlighting potential zones where significant market movements can occur due to liquidations. By consolidating data from multiple exchanges, it provides a more rounded view of market behavior, which is essential in today’s interconnected trading environment. The tiered liquidation system and histogram feature equip traders with the ability to identify and focus on key market segments where high activity is expected. This tool is particularly valuable for traders who base their strategies on market liquidity and leverage dynamics.
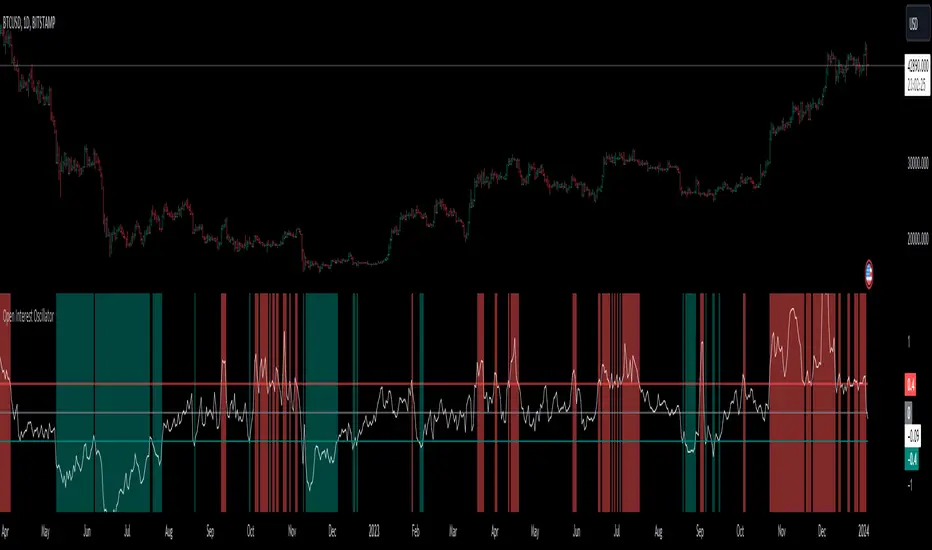
Open Interest OscillatorIn the middle of a bustling cryptocurrency market, with Bitcoin navigating a critical phase and the community hype over potential ETF approvals, current funding rates, and market leverage, the timing is optimal to harness the capabilities of sophisticated trading tools.
Meet the Open Interest Oscillator – special indicator tailored for the volatile arena of cryptocurrency trading. This powerful instrument is adept at consolidating open interest data from a multitude of exchanges, delivering an in-depth snapshot of market sentiment across all timeframes, be it a 1-minute sprint or a weekly timeframe.
This versatile indicator is compatible with nearly all cryptocurrency pairs, offering an expansive lens through which traders can gauge the market's pulse.
Key Features:
-- Multi-exchange Data Aggregation: This feature taps into the heart of the crypto market by aggregating open interest data from premier exchanges such as BINANCE, BITMEX, BITFINEX, and KRAKEN. It goes a step further by integrating data from various pairs and stablecoins, thus providing traders with a rich, multi-dimensional view of market activities.
-- Open Interest Bars: Witness the flow of market dynamics through bars that depict the volume of positions being opened or closed, offering a clear visual cue of trading behavior. In this mode, If bars are going into negative zone, then traders are closing their positions. If they go into positive territory - leveraged positions are being opened.
-- Bollinger Band Integration: Incorporate a layer of statistical analysis with standard deviation calculations, which frame the open interest changes, giving traders a quantified edge to evaluate the market's volatility and momentum.
-- Oscillator with Customizable Thresholds: Personalize your trading signals by setting thresholds that resonate with your unique trading tactics. This customization brings the power of tailored analytics to your strategic arsenal.
-- Max OI Ceiling Setting: In the fast-paced crypto environment where data can surge to overwhelming levels, the Max OI Ceiling ensures you maintain a clear view by capping the open interest data, thus preserving the readability and interpretability of information, even when market activity reaches feverish heights.
OI Visible Range Ladder [Kioseff Trading]Hello!
This Script “OI Visible Range Ladder” calculates open interest profiles for the visible range alongside an OI ladder for the visible period!
Features
OI Profile Anchored to Visible Range
OI Ladder Anchored to Visible Range
Standard POC and Value Area Lines, in Addition to Separated POCs and Value Area Lines for each category of OI x Price
Configurable Value Area Targets
Curved Profiles
Up to 9999 Profile Rows per Visible Range
Stylistic Options for Profiles
Up to 9999 volume profile levels (Price levels) can be calculated for each profile, thanks to the new polyline feature, allowing for less aggregation / more precision of open interest at price.
The image above shows primary functionality!
Green profiles = Up OI / Up Price
Yellow profiles = Down OI / Up Price
Purple profiles = Up OI / Down Price
Red profiles = Down OI / Down Price
The image above shows POCs for each OI x Price category!
Profiles can be anchored on the left side for a more traditional look.
The indicator is robust enough to calculate on “small price periods”, or for a price period spanning your entire chart fully zoomed out!
That’s about it :D
This indicator is Part of a series titled “Bull vs. Bear” - a suite of profile-like indicators.
Thanks for checking this out!
If you have any suggestions please feel free to share!

Open interest flow / quantifytools- Overview
Open interest flow detects inflows (positions opening) and outflows (positions closing) using open interest and estimates delta (net buyers/sellers) for the flows. Users are able to choose any open interest source available on Tradingview, by default set to BTCUSDT OI fetched from Binance. Using historical open interest flows, bands depicting typical magnitude of flows are formed for benchmarking intensity of flows. On the inflow side, +1 represents average inflows while +2 represents 2x above average inflows, a level considered an extreme. In a vice versa manner, -1 represents average outflows while -2 represents 2x above average outflows. Extreme inflows indicate aggressive position opening, in other words exuberance. Extreme outflows on the other hand indicate forced exiting of positions, in other words liquidations.
- Concept
Open interest flow is calculated using position of OI source relative to its moving average (by default set to SMA 10), referred to as relative open interest from hereon. When relative OI is positive (open interest is above its moving average), new positions are considered to enter the market. When relative OI is negative (open interest is below its moving average), existing positions are considered to exit the market. Open interest delta (side opening/closing positions, either net buyers/sellers) is calculated using relative price in a similar fashion to relative OI, but using close of viewed symbol as source. Price is considered to be up when relative price is positive, down when relative price is negative. Using relative OI and relative price in tandem, the following assumptions are applied:
Price up, open interest up = longs entering market
Price down, open interest up = shorts entering market
Price down, open interest down = longs exiting market
Price up, open interest down = shorts exiting market
Bands depicting magnitude of open interest flows are calculated using average turning points in relative OI. +1 and -1 represent levels where flows on average turn towards mean rather than continue to increase/decrease. These levels are then multiplied up to +2 and -2, representing two times larger deviations from the normal. When inflows are above 1, positions opening have reached a point where flows historically turn down. Therefore, anything above 1 would be abnormal amount of open interest entering, an extreme stretch being at 2 or above. Same logic applies to outflows, but in a vice versa manner (below -1 abnormal, extreme at -2)
Flow bursts further refine indications of aggressive inflows/outflows by taking into account change in open interest flows. Burst indications are activated when open interest is above its average turning point, coupled with a sufficient increase/decrease in flows simultaneously. Bursts are essentially a filtered version of abnormal flows and therefore a more reliable indication of exuberance/liquidations. Burst sensitivity can be adjusted via input menu, available in 5 settings. 1 sets OI burst requirements to loosest (more signals, more noise) while 5 sets OI burst requirements to strictest (less signals, less noise). Exact criteria applied to bursts can be viewed via input menu tooltip.
- Features
Users can opt for OI source auto-select for CRYPTO/USDT pairs. When auto-select is enabled and another chart is opened, corresponding open interest source is automatically selected as long as requirements mentioned above are met.
Open interest flows can be visualized as chart color, available separately for flow states and flow bursts.
Relative price line and flow guidelines (reminders for flow interpretation) can be enabled via input menu. All colors are customizable.
- Alerts
Available alerts are the following:
- Abnormal long inflows/outflows
- Abnormal short inflows/outflows
- Abnormal inflows/outflows from either side
- Aggressive longs/shorts (flow burst up)
- Liquidated longs/shorts (flow burst down)
- Aggressive or liquidated longs/shorts
- Practical guide
Open interest as a standalone data point does not reveal which side is likely opening/exiting positions and how extreme the participant behavior is. Using the additional data provided by open interest flows, moments of greed and fear can be detected. Smart money does not short into dips and buy into rips. When buyers or sellers have participated in a large move and continue to show interest even when efforts are not rewarded at an already overextended price, participants are asking for trouble.
Similar events can be observed when extreme outflows take place, indicating forced exits such as stop-losses triggering. When enough participants are forced out, price is likely to take the path of least resistance which is to the opposite direction.
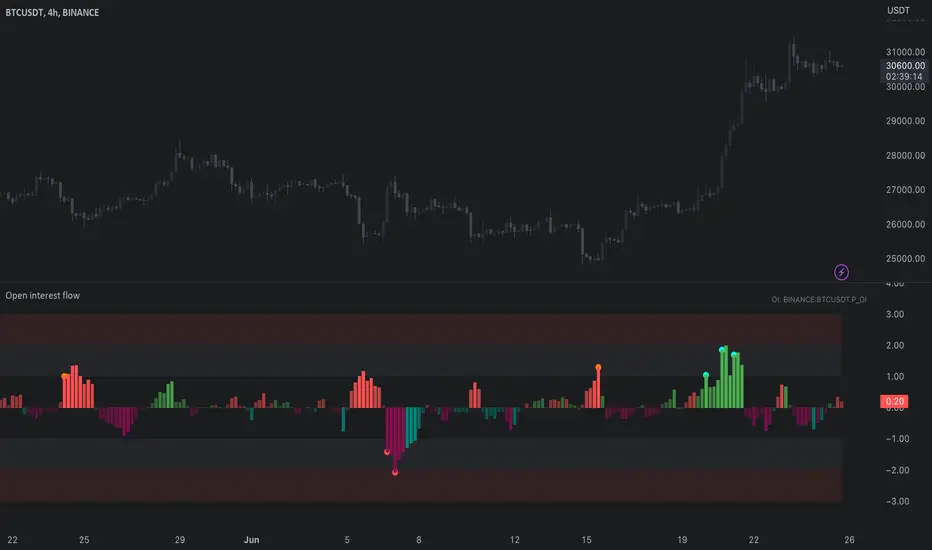
Open Interest Suite [Aggregated] - By LeviathanThis script is an all-in-one indicator that uses aggregated Open Interest data to plot OI candles, Open Interest Delta, OI x rVOL, and OI RSI. It also includes tools such as an OI Distribution profile, large OI increase/decrease coloring, a Stats Screener, and much more.
You can select and have the script plot the following:
- Open Interest in the form of OHLC candles
- Open Interest Delta in the form of a histogram
- Open Interest x Relative Volume in the form of a histogram
- Open Interest RSI in the form of a line
Additional features include:
- OI Distribution Profile (It shows the distribution of open interest in the visible range on y axis. This makes it easier to identify when Open Interest is relatively high or low and at which values most of the action took place)
- Stats screener (The screener includes the real-time net Open Interest value, Rekt Longs/Rekt Shorts based on large OI decreases and Aggressive Longs/Shorts based on large OI increases)
- Coloring (You can color OI Delta nodes, background and chart candles based on large OI increases/decreases)
- more
Instructions for the settings will be provided in the tooltips shortly.
Full credit goes to @KioseffTrading for the profile generation code.
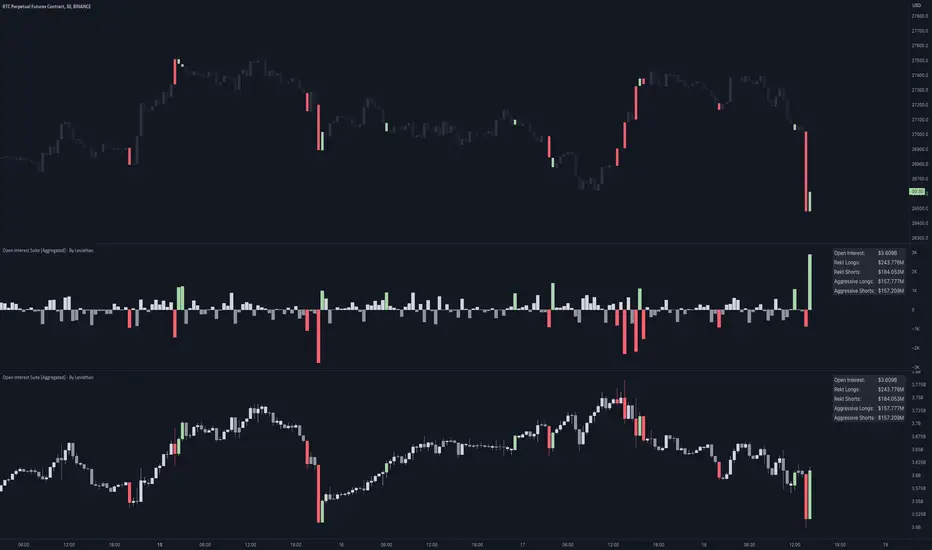
Open Interest Profile [Fixed Range] - By LeviathanThis script generates an aggregated Open Interest profile for any user-selected range and provides several other features and tools, such as OI Delta Profile, Positive Delta Levels, OI Heatmap, Range Levels, OIWAP, POC and much more.
The indicator will help you find levels of interest based on where other market participants are opening and closing their positions. This provides a deeper insight into market activity and serves as a foundation for various different trading strategies (trapped traders, supply and demand, support and resistance, liquidity gaps, imbalances,liquidation levels, etc). Additionally, this indicator can be used in conjunction with other tools such as Volume Profile.
Open Interest (OI) is a key metric in derivatives markets that refers to the total number of unsettled or open contracts. A contract is a mutual agreement between two parties to buy or sell an underlying asset at a predetermined price. Each contract consists of a long side and a short side, with one party consenting to buy (long) and the other agreeing to sell (short). The party holding the long position will profit from an increase in the asset's price, while the one holding the short position will profit from the price decline. Every long position opened requires a corresponding short position by another market participant, and vice versa. Although there might be an imbalance in the number of accounts or traders holding long and short contracts, the net value of positions held on each side remains balanced at a 1:1 ratio. For instance, an Open Interest of 100 BTC implies that there are currently 100 BTC worth of longs and 100 BTC worth of shorts open in the market. There might be more traders on one side holding smaller positions, and fewer on the other side with larger positions, but the net value of positions on both sides is equivalent - 100 BTC in longs and 100 BTC in shorts (1:1). Consider a scenario where a trader decides to open a long position for 1 BTC at a price of $30k. For this long order to be executed, a counterparty must take the opposite side of the contract by placing a short order for 1 BTC at the same price of $30k. When both long and short orders are matched and executed, the Open Interest increases by 1 BTC, indicating the introduction of this new contract to the market.
The meaning of fluctuations in Open Interest:
- OI Increase - signifies new positions entering the market (both longs and shorts).
- OI Decrease - indicates positions exiting the market (both longs and shorts).
- OI Flat - represents no change in open positions due to low activity or a large number of contract transfers (contracts changing hands instead of being closed).
Typically, we monitor Open Interest in the form of its running value, either on a chart or through OI Delta histograms that depict the net change in OI for each price bar. This indicator enhances Open Interest analysis by illustrating the distribution of changes in OI on the price axis rather than the time axis (akin to Volume Profiles). While Volume Profile displays the volume that occurred at a given price level, the Open Interest Profile offers insight into where traders were opening and closing their positions.
How to use the indicator?
1. Add the script to your chart
2. A prompt will appear, asking you to select the “Start Time” (start of the range) and the “End Time” (end of the range) by clicking anywhere on your chart.
3. Within a few seconds, a profile will be generated. If you wish to alter the selected range, you can drag the "Start Time" and "End Time" markers accordingly.
4. Enjoy the script and feel free to explore all the settings.
To learn more about each input in indicator settings, please read the provided tooltips. These can be accessed by hovering over or clicking on the ( i ) symbol next to the input.

Open Interest All ExchangesThe indicator collects data from available exchanges based on open interest. The indicators are calculated in the amount of Bitcoin.
Below are the tickers of the exchanges that provide the data:
- BITFINEX:BTCUSD
- BITFINEX:BTCUST
- KRAKEN:BTCUSDPERP
- BITMEX:XBTUSD
- BITMEX:XBTUSDT
- BINANCE:BTCUSDTPERP
- BINANCE:BTCUSDPERP (due to low volumes and limitations of 40 requests of the request.security function, the code contains data without using the calculation)
For me, Open Interest indicators play an important role in the trading system, for this reason I share with you. I am not a financial advisor.
**Open for cooperation**
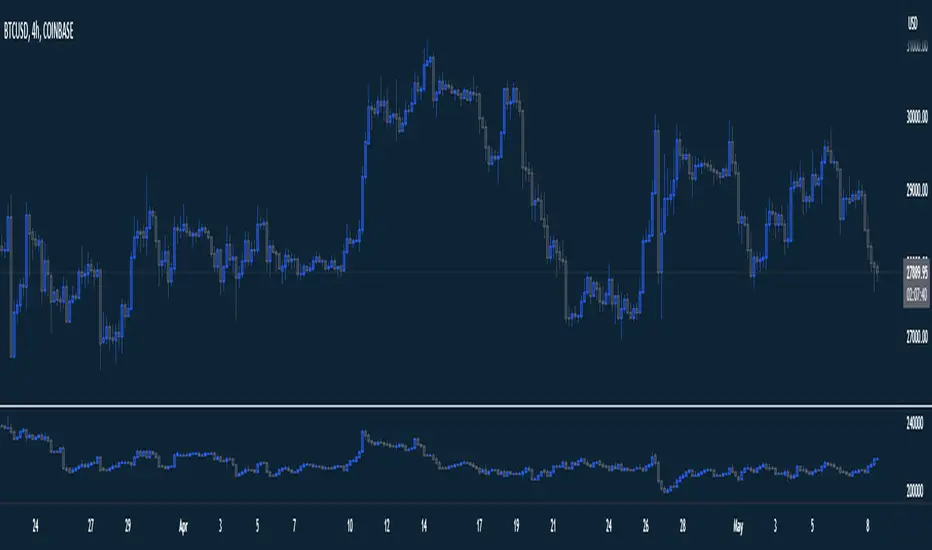
OI Profile Composite [CE]OI Profile Composite
This indicator is a compliment tool to the OI Profile Remastered, the indicator works by allowing the user to choose:
-Start Time
-End Time
On load so the profile is built as a composite of this data.
the indicator provides the opportunity to show: Delta, Positive and negative OI in separation,
as well as calculate the High Value Nodes ( HVN ) + Liquidations independently of the OI shown.
Users are granted options such as
HVN - Auto detects areas of High Open Interest
Liquidations - Provides points of maximum likely liquidation areas
Extend Liquidations
Liquidation levels can also optionally be chosen to be extended, this may be useful e.g.
if a user wishes to see all positions built during expansion from swing low to swing high, we can gain insight into where participants have taken trades,
this will give us areas of potential liquidations for these traders and then extend these points beyond the swing high. This prevents more data being injested,
aside from the data in this movement, and the levels can be used for future trades accounting for historical liq generated data. Very useful feature of the composite creation.
Users can select their margin manually else the Auto settings for margin will do its job based on the chart selected, perp vs usdt.
All settings are set to defaults that I currently use for BTC trading.
Liquidation points can be useful for Targets when taking a trade.
HVN /OI. Can be used as S/R dynamically as well as the OI develops throughout the session.

Volume / Open Interest "Footprint" - By LeviathanThis script generates a footprint-style bar (profile) based on the aggregated volume or open interest data within your chart's visible range. You can choose from three different heatmap visualizations: Volume Delta/OI Delta, Total Volume/Total OI, and Buy vs. Sell Volume/OI Increase vs. Decrease.
How to use the indicator:
1. Add it to your chart.
2. The script will use your chart's visible range and generate a footprint bar on the right side of the screen. You can move left/right, zoom in/zoom out, and the bar's data will be updated automatically.
Settings:
- Source: This input lets you choose the data that will be displayed in the footprint bar.
- Resolution: Resolution is the number of rows displayed in a bar. Increasing it will provide more granular data, and vice versa. You might need to decrease the resolution when viewing larger ranges.
- Type: Choose between 3 types of visualization: Total (Total Volume or Total Open Interest increase), UP/DOWN (Buy Volume vs Sell Volume or OI Increase vs OI Decrease), and Delta (Buy Volume - Sell Volume or OI Increase - OI Decrease).
- Positive Delta Levels: This function will draw boxes (levels) where Delta is positive. These levels can serve as significant points of interest, S/R, targets, etc., because they mark the zones where there was an increase in buy pressure/position opening.
- Volume Aggregation: You can aggregate volume data from 8 different sources. Make sure to check if volume data is reported in base or quote currency and turn on the RQC (Reported in Quote Currency) function accordingly.
- Other settings mostly include appearance inputs. Read the tooltips for more info.

Cuban's Open Interest Spaghetti [CE]Cuban's Open Interest Spaghetti is an indicator built for traders to track the open interest changes of highly correlated markets, spreads, and ecosystems.
The tool provides three different viewing modes for tracking open interest; a rolling bar lookback, a specific data and time anchor, and a visible range -- similar to the native Tradingview 'Compare' tool.
Included are pre-built lists for tracking the open interest of all 160+ Binance Futures assets, including custom fields for creating new spreads or watchlists. This gives the trader the ability to monitor the entire futures ecosystem within a single charting window.
We have also added an optional table to the right of the screen so that the trader can clearly see outperforming assets. This table is toggleable using radio buttons within the Style menu.
To improve asset visibility, the script also calculates the 'long tail' of the asset distribution and automatically lowers the visibility of clustered assets in the center.
While the Compare tool only allows for % returns and absolute value on the chart asset or separate scale, Cuban's Open Interest Spaghetti allows the trader to use a separate oscillator window with the open interest on a % scale. This gives the trader the ability to watch OI changes in real-time within any Tradingview window.
Within the user inputs, the user gains the ability to customize the following:
Lookback mode
Rolling lookback period
Timezone and time anchor
Percentage of assets highlighted
Dynamic label offset
Asset lists
TO DO:
Add % labels to assets in the tails of the distribution
