Kai GoNoGo 2mKai GoNoGo 2m is a multi-factor trend confirmation system designed for fast intraday trading on the 2-minute chart.
It combines EMAs, MACD, RSI and ADX through a weighted scoring model to generate clear Go / NoGo conditions for both CALL (long) and PUT (short) setups.
The indicator paints the candles with pure colors to show the current strength of the trend:
Strong Go (Bright Blue): Full bullish alignment across EMAs, momentum and trend strength.
Weak Go (Light Blue): Bullish structure but with softer momentum.
Weak NoGo (Light Pink): Bearish structure starting to develop.
Strong NoGo (Bright Pink): Full bearish alignment across all components.
Neutral (Gray): No trend, compression or transition phase.
Components included:
EMA Trend Structure (9/21/50/100/200)
MACD Momentum (12-26-9)
RSI Confirmation (14)
ADX Trend Strength Filter via DMI (14,14)
Scoring system inspired by the original GoNoGo concept, improved for speed-based trading.
Designed for:
Scalping, 0DTE options, FAST trend continuation entries, and momentum confirmation on QQQ, SPY, NQ, ES and high-beta names.
This version uses pure colors (no gradients) for maximum clarity when trading fast charts.
Options
Today Range Calculator1. Indicator Name
Today (Today’s Volatility)
2. One-line Introduction
Displays real-time 30-day historical volatility (HV30) as a compact table on the chart, helping traders instantly assess market risk levels.
3. General Overview
Today ↑↓ is a lightweight informational widget that calculates and displays the 30-day Historical Volatility (HV30) of the asset in real time.
Using logarithmic returns over the past 30 periods, the script computes variance and then annualizes it to express volatility as a percentage (%) per year.
The result is shown in a clean 1x1 table cell, which can be positioned anywhere on the chart—top/bottom, left/right—depending on your preference.
This makes it easy to quickly evaluate whether the current market is high-risk (volatile) or stable, without cluttering the chart.
It’s especially useful for position sizing, risk management, volatility-based entry/exit decisions, and as a filter for breakout strategies.
Built with performance in mind, the script uses minimal system resources and can be used alongside any indicator or strategy without interference.
4. Key Advantages
📈 Real-time HV30 Display
Calculates and displays 30-day historical volatility using annualized log return variance.
📍 Custom Table Positioning
Place the volatility display in any corner of the chart for optimal visibility.
🧮 Accurate Log Return Calculation
Uses logarithmic returns to ensure precise volatility representation over time.
🎯 Quick Market Sentiment Read
Helps you determine at a glance whether the asset is in a calm or volatile environment.
🧼 Minimalist Design
Clean 1-cell table format keeps your chart readable and organized.
🚀 Ultra-Lightweight Script
Runs efficiently with negligible impact on chart performance.
📘 Indicator User Guide
📌 Basic Concept
Today ↑↓ calculates 30-day Historical Volatility (HV30) by analyzing the asset’s log returns over the past 30 bars.
The result is annualized and shown as a percentage to reflect volatility in standardized terms.
Useful for gauging risk levels and strategy suitability in current market conditions.
⚙️ Settings Explained
Table Position: Choose where the volatility table appears:
Top Left / Top Right / Bottom Left / Bottom Right
📈 High Volatility Example
HV30 > 50% indicates a volatile environment
Suggests wider stop-losses, cautious position sizing, or favoring breakout strategies
📉 Low Volatility Example
HV30 < 15% suggests a calm market or range-bound behavior
Useful as a signal for upcoming volatility expansions or breakout preparations
🧪 Recommended Use Cases
Position Sizing: Scale position size based on HV30 readings
Strategy Filter: Activate certain systems only when volatility meets predefined conditions
Breakout Timing: Identify low-volatility zones as potential breakout opportunities
🔒 Precautions
This indicator does not generate buy/sell signals; it is a volatility reference tool
HV thresholds vary across asset classes—adjust interpretation accordingly
Since HV30 is historical, it may lag during rapid market changes

Thi Cloud EMA SystemThis is a spinoff of the Ripster's cloud system.
I altered it in order to be more accurate using the 5 min candle instead of the 10

MAG8 Breadth RSI This indicator is for my personal monitoring breadth of MAG 8 , including AVGO for use to trade spy/es and qqq/nq.
A green bar over 6 translates to 6 out of the 8 stocks have RSI's<30. Conversely a red indicator at 6 would indicate 6 out of 8 are overbought, RSI >70.
Extreme 6-8 of 8 either overbought (red) or oversold (green)
Moderate 4-5 of 8 either overbought (red) or oversold (green)
No Signal 0-3 of 8 either overbought (red) or oversold (green)
Not trading advice but thought I would share.

Quarterly Theory ChecklistThis indicator gives you a fully customizable trading checklist directly on your chart, helping you stay consistent and avoid emotional or impulsive trades.
You can pin the checklist to one specific symbol, so it only appears when you’re analyzing the pair or asset you want to track. Each checklist item has:
A checkbox you can manually toggle
A text label you can customize
Automatic coloring (green check ✔ or red cross ✘)
The indicator also calculates a Trade Score based on how many criteria you’ve checked off.
This score updates live and is color-coded:
Green = 75–100% confidence
Yellow = 50–74%
Red = below 50%
You can choose:
The position of the table
Text size
Header text & colors
Border color
Number of visible checklist rows (1–8)
Enable or disable the Trade Score
Everything is organized inside a clean 2-column checklist table with a polished UI.
Perfect for:
→ System traders
→ Checklists (HTF bias, POIs, confirmations, timing, etc.)
→ Evaluations & trade grading
→ Staying disciplined and rule-based

Bullish ATR Level indicatorThis indicator is used by OVTLYR Golden Ticket Trading strategy to determine the stop loss and option rollover levels. Super simple indicator that just shows the current price, -1/2 ATR for a stop loss and 1 and 2 ATR levels for possible take profit or option rollover points.

GEX / Gamma - SPX Indicator Description – GEX / Gamma (SPX)
This indicator allows you to manually plot your daily +GEX, TRANS-GEX, and –GEX levels on SPX and visualize how price reacts around key gamma zones.
You enter the three levels each morning, and the script automatically draws:
+GEX / TRANS / –GEX zones with an adjustable buffer
Clean labels (e.g., “+GEX: 6850”) pinned to the right side of the chart
Today-only candle coloring (green above TRANS-GEX, red below)
Zones extend from yesterday’s session through the current session, helping highlight areas where dealer hedging flows may influence volatility, compression, or acceleration.
How to Use
Add the indicator to any intraday SPX chart.
Open settings and enter your +GEX, TRANS-GEX, and –GEX levels for the day.
Adjust the buffer, colors, and label style as needed.
Watch how price behaves as it moves above or below TRANS-GEX and interacts with +/- GEX zones.
Best For
Intraday SPX / ES / SPY
Options traders
Volatility and gamma-aware strategies
Strategy Behind It (Tight Version)
GEX levels help identify where dealer hedging flows can influence SPX price behavior.
+GEX (Positive Gamma)
Market tends to stabilize here. Dealers hedge against price moves, creating mean-reversion and lower volatility.
TRANS-GEX (Transition Level)
Key pivot where gamma flips. Price crossing this level often signals a shift in volatility or intraday direction.
–GEX (Negative Gamma)
Market becomes more reactive. Dealers hedge with price, increasing volatility, momentum, and trend potential.
How traders use it:
Expect resistance or slowdown into +GEX
Watch for potential bottoming or increased volatility –GEX
Use TRANS-GEX as a bias line or trigger for intraday shifts
A move outside of either the +GEX or -GEX will likely result in some type of high volume move.

Lot Size CalculatorLot Size Calculator for Gold (XAU)
This indicator helps traders calculate the proper lot size for Gold (XAU) based on their entry, stop loss, and risk amount in USD.
You can set your entry and stop levels directly on the chart, and adjust your dollar risk from the settings panel.
The indicator measures the distance between entry and stop to calculate the position size that matches your selected risk.
A clean, customizable table displays key values such as Risk, Entry, Stop, Target, Lots, and Pips.
You can easily hide specific rows, change colors, and adjust layout options to fit your chart style.
Designed specifically for Gold traders, this tool provides a simple and visual way to manage risk directly on the chart.

Put Option Profits inspired by Travis Wilkerson; SPX BacktesterPut Option Profits — Travis Wilkerson inspired. This tester evaluates a simple monthly SPX at-the-money credit-spread timing idea: enter on a fixed calendar rule (e.g., 1st Friday or 8th day with business-day shifting) at Open or Close, then exit exactly N calendar days later (first tradable day >= target, at Close). A trade is marked WIN if price at exit is above the entry price (1:1 risk proxy).
The book suggests forward testing 60-day and 180-day expirations to prove the concept. This tool lets you backtest both (and more) to see what actually works best. In the book, profits are taken when the spread reaches ~80% of max credit; losers are left to expire and cash-settle. This backtester does not model early profit-taking—every trade is held to the configured hold period and evaluated on price vs entry at the exit close. Think of it as a pure “set it and forget it” stress test. In live trading, you can still follow Travis’s 80% take-profit rule; TradingView just doesn’t simulate that here. Happy trading!
Features:
Schedule: Day-of-Month (with Prev/Next business-day shift, optional “stay in month”) or Nth Weekday (e.g., 1st Friday).
Entry timing: Open or Close.
Exit: N calendar days later at Close (holiday/weekend aware).
Filters: Optional EMA-200 “risk-on” filter.
Scope: Date range limiter.
Visuals: Entry/exit bubbles (paired colors) or simple win/loss dots.
Table: Overall Win% and N (within range).
Alerts: Entry alert (static condition + dynamic alert() message).
How to use:
[* ]Choose Start Mode (NthWeekday or DayOfMonth) and parameters (e.g., 1st Friday or DOM=8, PrevBizDay).
Pick Entry Timing (Open or Close).
Set Days In Trade (e.g., 150).
(Optional) Enable EMA filter and set Date Range.
Turn Bubbles on/off and/or Dots on/off.
Create alert:
Simple ping: Condition = this indicator -> Monthly Entry Signal -> “Once per bar” (Open) or “Once per bar close” (Close).
Rich message: Condition = this indicator -> Any alert() function call.
Notes:
Keep DOM shift in same month: when a DOM falls on a weekend/holiday, PrevBizDay/NextBizDay shift will stay inside the month if enabled; otherwise it can spill into the prior/next month. (Ignored for NthWeekday.)
Credits: Concept sparked by “Put Option Profits – How to turn ten minutes of free time into consistent cash flow each month” by Travis Wilkerson; this script is a neutral research tool (not financial advice).

Slick Strategy Weekly PCS TesterInspired by the book “The Slick Strategy: A Unique Profitable Options Trading Method.” This indicator tests weekly SPX put-credit spreads set below Monday’s open and judged at Friday’s close.
WHAT IT DOES
• Sets weekly PCS level = Monday (or first trading day) OPEN − your offset; win/loss checked at Friday close.
• Optional core filter at entry: Price ≥ 200-SMA AND 10-SMA ≥ 20-SMA; pause if Price < both 10 & 20 while > 200.
• Reference modes: Strict = Mon OPEN vs Fri SMAs (no repaint); Mid = Mon OPEN vs Mon SMAs
KEY INPUTS
• Date range (Start/End) to limit backtest window.
• Offset mode/value (Points or Percent).
• Entry day (Monday only or first trading day).
• Core filters (On/Off) and Strict/Mid reference.
• SMA settings (source; 10/20/200 lengths).
• Table settings (position, size, padding, border).
VISUALS
• Active week line: Orange = trade taken; Gray = skipped.
• History: Green = win; Red = loss; Purple = skipped.
• Optional week bands highlight active/win/loss/skipped weeks (adjustable opacity).
TABLE
• Shows Date range, Trades, Wins, Losses, Win rate, and Active level (this week’s PCS price).
NOTES
• PCS level freezes at week open and persists through the week.

McMillan Volatility Bands (MVB) – with Entry Logic// McMillan Volatility Bands (MVB) with signal + entry logic
// Author: ChatGPT for OneRyanAlexander
// Notes:
// - Bands are computed using percentage volatility (log returns), per the Black‑Scholes framing.
// - Inner band (default 3σ) and outer band (default 4σ) are configurable.
// - A setup occurs when price closes outside the outer band, then closes back within the inner band.
// The bar that re‑enters is the "signal bar." We then require price to trade beyond the signal bar's
// extreme by a user‑defined cushion (default 0.34 * signal bar range) to confirm entry.
// - Includes alertconditions for both setups and confirmed entries.

Vicky IndicatorMomentum indicator used for day trading only. Focus on the line. If it crosses below midline then sell options and square off when it crosses midline on the up. Color changes added for better understanding. This is more refined than other indicators and gives better entry and exits

X ATM Option Ladder FlowX ATM Option Ladder Flow is a specialized options-market visualization tool designed for intraday tracking of at-the-money (ATM) option volume flow in index ETFs such as QQQ and SPY.
The script dynamically identifies the ATM contract on every bar and plots real-time call-versus-put volume distributions and marker to represent if the volume corresponded with the price of the option going up or down.
By analyzing volume and direction data from multiple strikes within an ±8-point range, the indicator produces a real-time histogram that reflects how order flow evolves relative to the underlying price.
Complementary status tables display the active strike, ladder position, and warnings when the underlying moves outside the monitored range.
Core Features
Dynamic ATM selection – Each bar automatically maps to the option contract closest to the underlying’s price.
Bidirectional volume comparison – Visual separation of call and put volume, with “up” markers highlighting contracts trading above their prior close.
Multi-strike ladder analysis – Samples strikes ±8 points from the defined center to capture flow skew and momentum near the money.
Optimized data calls – Uses tuple requests to minimize request.security() load, enabling a deeper ladder within TradingView limits.
Session awareness – Restricts processing to the 9:30 AM – 4:15 PM ET option-trading window.
Status dashboard – Displays date, active strike, warning flags (“⚠︎ / •outside”), and ladder parameters directly on chart.
Use Case
The indicator is intended for intraday traders and options-flow analysts who want to visualize how short-term liquidity and sentiment migrate across the ATM region as the underlying moves. Typical applications include:
Monitoring real-time call/put volume balance to confirm directional momentum or detect absorption zones.
Identifying volatility clustering near the money—where hedging pressure or gamma concentration can influence underlying price stability.
Detecting when price exits the monitored ladder (⚠︎ / •outside), signaling a potential shift to a new dominant option band or requiring manual recentering.
Integrating option flow into broader futures or ETF bias models (e.g., NQ/ES alignment or QQQ/SPY flow confirmation).
Technical Notes
Static-center architecture ensures historical consistency: prior bars remain fixed even after re-centering.
Ladder depth is hard-coded to ±8, the maximum possible within TradingView’s security-call limits.
auto_nudge is enabled to smoothly align the selected lane with the active ATM without requiring user intervention.
Indicator is optimized for 1-minute to 5-minute charts; use overlay = false to preserve scale clarity.

Option Selling Indicator @mybullandbearThe Option Selling Indicator is designed to help traders identify high-probability buy and sell zones based on market momentum and trend conditions. It provides a simple yet powerful visual cue system to make trading decisions clear and intuitive.
🎯 How It Works:
When the background turns green and the price moves above the black trend line, it signals bullish strength — a good condition to go for BUY or sell PUT options.
When the background turns red and the price moves below the black trend line, it signals bearish strength — a good condition to go for SELL or sell CALL options.
⚙️ Key Features:
Clear color-coded background for instant trend visualization.
Dynamic black trend line acts as a support/resistance guide.
Simple setup suitable for both beginners and experienced option sellers.
Works effectively across multiple timeframes and instruments.
💡 Usage Tip:
Combine this indicator with volume or volatility filters for more accurate entries, and always confirm signals with your trading strategy and risk management rules.

Price Action Bar Counter for Crypto Traders标注美股开收盘时间的K线辅助指标,自动调整夏令时与冬令时,适用于5m、15m、30m与1h级别。
Highlights U.S. stock market open and close times with automatic DST adjustment.
Best used on 5m, 15m, 30m, and 1h charts.

ATM Pulse (Arjo)ATM Pulse (Arjo) — Real-Time ATM Options Sentiment & Trend Strength Indicator
Overview
ATM Pulse (Arjo) is an options analytics and trend overlay tool that automatically detects the At-The-Money (ATM) strike for NIFTY, BANKNIFTY , or any selected stock.
It merges Call–Put Volume Ratio (CPVR) sentiment analysis with a Chandelier Exit trend overlay to help traders visualize both market bias and trend direction in a single chart.
Concepts & Logic
ATM Auto Detection
The script calculates the current ATM strike by rounding the underlying’s price to the nearest strike interval (e.g., 50 for NIFTY, 100 for BANKNIFTY). It then requests live option-chain data for that strike.
Call–Put Volume Ratio (CPVR)
The Call-Put Volume Ratio (CPVR) is calculated as the call volume divided by the put volume.
CPVR > 1.25 → Bullish dominance (Calls stronger)
CPVR < 0.75 → Bearish dominance (Puts stronger)
0.75–1.25 → Neutral sentiment
This ratio helps interpret real-time option-market positioning.
Chandelier Exit Trend Overlay
Using Average True Range (ATR) , the overlay plots dynamic trailing stops and visual trend zones:
🟢 Green: Uptrend continuation zone
🔴 Red: Downtrend continuation zone
A color change signals possible momentum reversal.
Combination of CPVR and Chandelier Exit
CPVR gauges option-market sentiment
Chandelier Exit confirms price-action direction
When both align (e.g., bullish CPVR + green Chandelier zone), it strengthens directional conviction. Divergent readings may signal indecision or early reversals.
How to Use
Open any NIFTY, BANKNIFTY , or stocks chart.
Add ATM Pulse (Arjo) to the chart.
Select your expiry date — the script auto-detects the ATM strike and displays:
C: Call LTP
P: Put LTP
CPVR: Call/Put Volume Ratio label
Watch the Chandelier Exit colors:
🟢 Green = Bullish trend
🔴 Red = Bearish trend
Combine CPVR bias + trend color for confirmation.
If CPVR is above 1.25 and trend color green → More bullish activity (Calls stronger).
If CPVR is below 0.75, and trend color red→ More bearish activity (Puts stronger).
If CPVR is between 0.75 and 1.25 and the trend color is gray/mixed → Neutral
Practical Use Case
The script continuously updates the ATM strike, CPVR , and trend overlay in real time.
It provides a clear visual snapshot of how option volumes align with price momentum , ideal for intraday or short-term directional traders.
Disclaimer
This tool is for educational and analytical purposes only.
It does not provide financial advice or guaranteed trading signals.
Happy Trading. ARJO

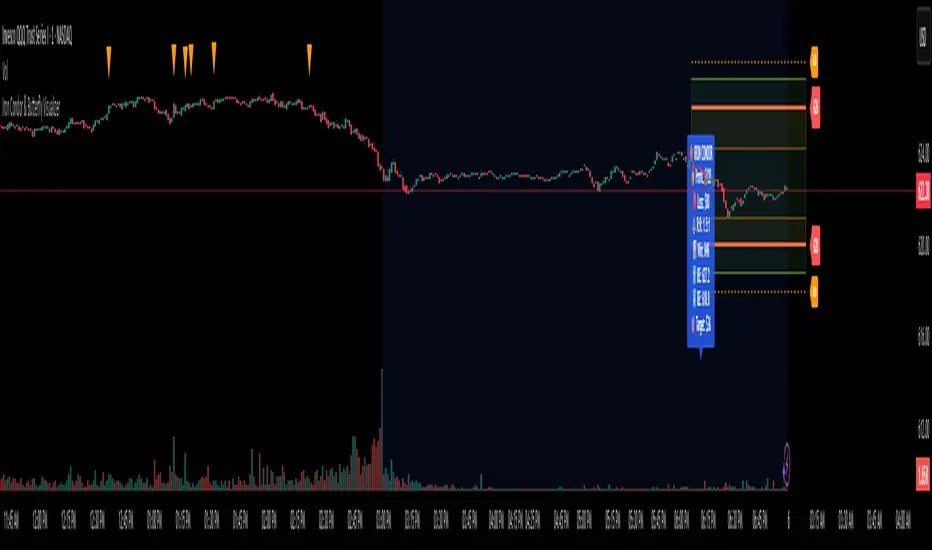
Iron Condor & Butterfly VisualizerIt helps you visualize and manage your option spread by:
Plotting strike prices and breakeven lines directly on the chart.
Showing profit/loss zones, adjustment zones, and alerts when price nears critical levels.
Calculating risk/reward, probability of profit, theta decay, IV condition, and trade score.
🎯 2. Inputs & Configuration
You input your trade details as a comma-separated string:
For an Iron Condor
ShortCall, LongCall, ShortPut, LongPut, Credit, Contracts, Target%
Example: 626,628,620,618,1.20,1,30
For a Butterfly Spread
LowerWing, Body, UpperWing, Debit, Contracts, Target%
Example: 600,620,640,2.50,2,50
The indicator automatically parses this and knows which strategy type you selected.
You can also control:
Visuals (profit zones, breakevens, labels)
Risk (stop loss %, adjustment zones)
Account/risk sizing
Market conditions (IV Rank, current IV, DTE)
⚙️ 3. Data Parsing & Strategy Recognition
The code reads your pasted string, splits it by commas, and determines:
Which strikes are short vs long (or wings/body for Butterfly)
Whether the strategy is credit (Iron Condor) or debit (Butterfly)
Calculates net credit/debit, contract size, and profit target
📈 4. Profit/Loss Calculations
It dynamically calculates:
Max Profit
Iron Condor: net credit × 100 × contracts
Butterfly: (wing width − debit) × 100 × contracts
Max Loss
Iron Condor: difference between strikes minus credit
Butterfly: debit × 100 × contracts
Breakeven points
Iron Condor: short strikes ± net credit
Butterfly: body ± debit
Current P&L relative to the live price (close).
⚖️ 5. Risk & Position Sizing
It checks:
Stop-loss trigger (% of max loss)
Adjustment alert if price nears short strikes
Recommended contract size based on account size and % risk per trade
Actual % of account at risk
⏱️ 6. Time Decay & IV Analysis
If you input days to expiration, it shows:
Theta (approx daily time decay)
Decay progress bar (% of 30-day cycle)
IV condition:
Green: favorable (>50 IV Rank)
Yellow: neutral (30–50)
Red: poor (<30)
🧮 7. Trade Scoring
It gives a Trade Score (0–100) based on:
IV Rank (favorable market)
Risk/Reward ratio
Probability of profit
Default 20 baseline points
This helps gauge whether the setup is statistically attractive.
🧠 8. Visualizations
When the indicator runs, it draws on your chart:
Lines
Red = short strikes
Orange dashed = long strikes
Yellow dotted = breakeven levels
Boxes
Green = profit zone
Orange shaded = adjustment zones (approaching danger)
Labels (optional)
Strike labels (call/put prices)
Info box summarizing:
Profit, loss, risk/reward
Breakevens, theta, target, gamma risk flag
🚨 9. Alerts
The script triggers TradingView alerts when:
Price nears call or put adjustment zones
Profit target is hit
Stop loss is hit
These help you manage the trade without constant monitoring.
🧭 10. In Practice
You’d:
Copy the option strikes and trade details from your broker or analyzer.
Paste them into 📋 PASTE YOUR TRADE DATA HERE.
The indicator plots:
Profit/loss region
Adjustment warnings
Key metrics
Alerts if your trade is in danger or near target.
Livelli OI-PNCOI-PNC Levels is a script that displays the open interest (OI) and net short positions (PNC) of a selection of 20 of the most significant stocks in terms of traded value on the Italian market.
PNC are indicated by red dotted lines starting from the close of the last reported change date;
The most significant open interest by number of contracts (Top 10 Calls and Top 10 Puts) are displayed using labels, all on a single line (Strike, CALL, PUT);
A summary table can be activated.
the data is hardcoded using static arrays and must be updated periodically. Data updated of 03/11/2025
########### Italiano ############
Livelli OI-PNC è uno script che permette di visualizzare gli open interest (OI) e le Posizioni Nette Corte (PNC) di una selezione di 20 titoli tra i più significativi per controvalore movimentato del mercato italiano.
Le PNC vengono indicate tramite Linee tratteggiate rosse che partono dal close della data di ultima variazione comunicata;
Sono riportati tramite labels, gli Open Interest più significativi per num.Contratti (Top 10 Call e top 10 Put) tutto su una unica riga per ogni strike (Strike, CALL, PUT);
E' attivabile una Tabella di riepilogo.
Poiché Pine Script non può leggere direttamente file da URL esterni, i dati sono hardcorati tramite array statici e vanno aggiornati periodicamente. Dati aggiornati al 03/11/2025

EMA921// ─────────────────────────────────────────────
// Notes for Publishing
// ─────────────────────────────────────────────
// This script plots EMA 9 and EMA 21 with trend shading.
// Colors: EMA 9 = Orange, EMA 21 = White
// Ideal for short-term trend following & entries.

korea time with 200 korea time
start time
08
09
17
18
23
00
This script makes it easier to look at the charts
The time automatically displays even if you don't bother to bring the mouse by hand
Now you can see the time intuitively
Run a very happy trading session

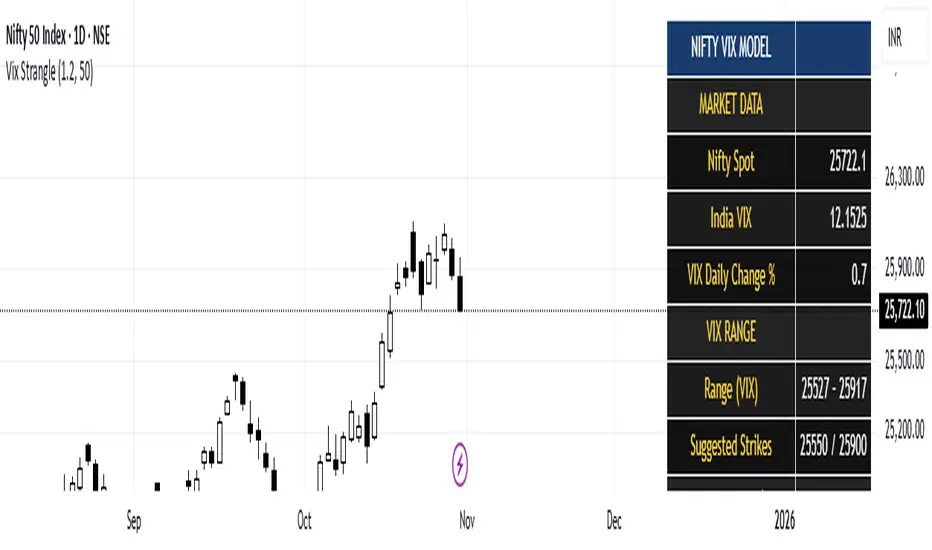
India Vix based Strangle StrikesA clean Nifty–VIX dashboard that converts India VIX into expected daily moves, price ranges, and suggested strangle strikes. Includes VIX %, expanded 1.2× range, and smart rounded strike levels for options trading.
This script provides a professional on-chart dashboard that converts India VIX into actionable trading levels for Nifty. It calculates the VIX-based expected daily move, projected price ranges, expanded 1.2× ranges, and suggested strangle strike prices. Includes clean formatting, color-coded sections, and real-time updates.
Ideal for traders using straddles, strangles, intraday volatility models, range-bound setups, and options-based risk management.
1.2x expanded range is better success probability, may keep 20% of strangle value as stop loss.
The vix based system is intended to give approx. 70%+ success rate.