Take Profit On Trend v2 (by BHD_Trade_Bot)The purpose of strategy is to detect long-term uptrend and short-term downtrend so that you can easy to take profit.
The strategy also using BHD unit to detect how big you win and lose, so that you can use this strategy for all coins without worry about it have different percentage of price change.
ENTRY
The buy order is placed on assets that have long-term uptrend and short-term downtrend:
- Long-term uptrend condition: ema200 is going up
- Short-term downtrend condition: 2 last candles are down price (use candlestick for less delay)
CLOSE
The sell order is placed when take profit or stop loss:
- Take profit: price increase 2 BHD unit
- Stop loss: price decrease 3 BHD unit
The strategy use $1000 for initial capital and trading fee is 0.1% for each order.
Pro tip: The 1-hour time frame for ETH/USDT has the best results on average.
Oscillators

Triple RSI strategyThis strategy is commonly used both in forex and stock markets for reversal trading. when the rsi line reaches and crosses simultaneously at 3 rsi setups i.e at 7, 14, and 21, a signal is generated.
This strategy works best in 1-hour timeframe. It provides over 60 to 80 percent accuracy in 1-hour timeframe.
In the stock market, this strategy provides an excellent entry point, if one is seeking small profits.
One can expect to make around 10 to 50 pips in the forex market easily. However, I advise seeking support from price action from the lower timeframe in the forex market.
I hope you like it.
Follow for more strategies and scripts like this.

3c Ultimate reversal strategy With scanner and backtester v2This might just be the ultimate strategy to identify reversals.
This strategy includes a scanner, a backtester and ability to connect it with you 3 commas bot(See adviced settings below)
Strategy:
-Signals reversal that happened in the last bar. This signal DO NOT repaint.
-Identifies potential reversal that might happen in the current bar but can also not happen depending upon the timeframe closing price.
-The strategy combines the Moving Average Trend Changer, SuperTrend (ATR price detection) and ADX.
-It reduces the number of false signals in sideways market conditons and give more reliable trade signals.
-The signal does not repaint and can be used in any market condition. It determines the trend with high precision.
Take profit:
-Set 2 separate TP conditions.
-You can take profit using percentage, ATR, or RR(Risk Reward), aswell as using Trailing Take Profit.
- Use sell signal from the strategy(I often find way better results using that)
Stoploss:
-You can use either ATR, Percentage or sell signal from the strategy
(For now to let the strategy itself decide when to TP or SL, just set these parameters really high.)
Scanner:
-Identifies coins that are currently in the sell zone
-Identifies coins that are currently in the buy zone
-Screener explores up to 20 pairs in current graph's time frame.
-Optimize the strategy to your liking and use the built in backtester to see if it is a viable strategy.
3commas settings:
-For now you can only use simple bots.
-Create LONG and SHORT bots for the coins you like to trade and set up alerts(You can send long and short signal from the same alert)
-Set TP to 50% the strategy will handle buys and exits based on your inputs.
-Set safety orders to 0. I might add DCA to the strategy if testing proves that to be a good solution.
-When you have made the bots input the bot ID and token adress in the settings of the strategy.
-When creating the alert use this webhook :https://3commas.io/trade_signal/trading_view
-In the message field you use {{strategy.order.alert_message}} as the placeholder.
In the future this signal might make it to the 3commas marketplace. You can then subscribe to that signal where I have cherrypicked coins based on thorough backtesting and optimization.

Short Term RSI and SMA Percentage ChangeThis strategy utilises common indicators like RSI and moving averages in order to enter and exit trades. The Relative Strength Index (RSI) is a momentum indicator that has a value between 0 and 100, where a value greater than 70 is considered overbought and a value less than 30 is oversold. If the RSI value is above or below these values, then it can signal a possible trend reversal.
The second indicator used in this strategy is the Simple Moving Average (SMA). A SMA is an arithmetic moving average calculated by adding recent prices and then dividing that figure by the number of time periods in the calculation average. For example, one could add the closing price of a coin for a number of time periods and then divide this total by that same number of periods. Short-term averages respond quickly to changes in the price of the underlying coin, while long-term averages are slower to react.
Long/Exit orders are placed when three basic signals are triggered.
Long Position:
RSI is greater than 50
MA9 is greater than MA100
MA9 increases by 6%
Exit Position:
Price increases 5% trailing
Price decreases 5% trailing
The script is backtested from 1 May 2022 and provides good returns.
A trading fee of 0.1% is also taken into account and is aligned to the base fee applied on Binance.
This script also works well on AVAX 45m/1h, MATIC 15m/45m/1h and ETH 4h.

Stochastic Rsi+Ema - Auto Buy Scalper Scirpt v.0.3Simple concept for a scalping script, written for 5 minute candles, optimized for BTC.
1st script I've created from scratch, somewhat from scratch. Also part of the goal of this one is to hold coin as often as possible, whenever it's sideways or not dropping significantly.
Designed to buy on the stochastic bottoms (K>D and rising, and <17)
Then and sell after 1 of 3 conditions;
a. After the price goes back up at least 1 % and then 1-2 period ema reversal
b. After the rsi reversal (is dropping) and K

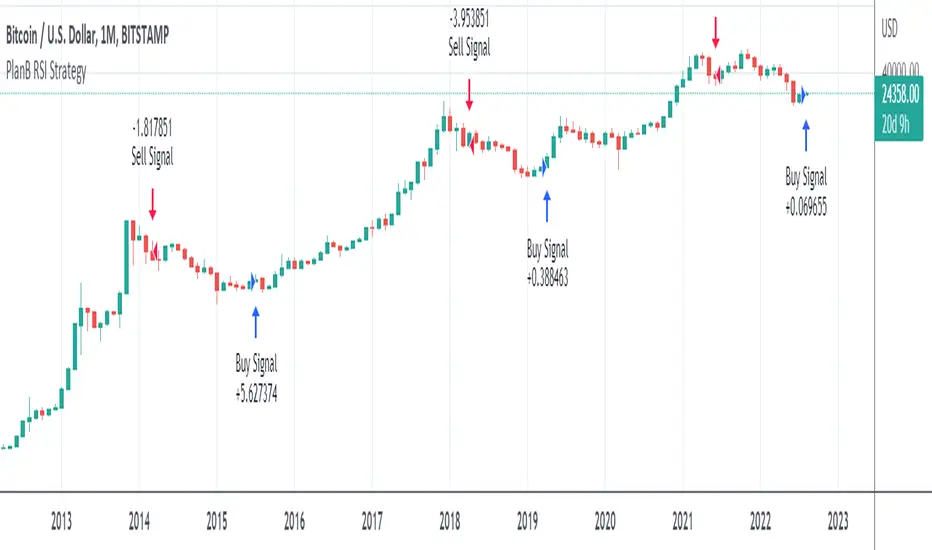
PlanB Quant Investing 101 v2This script has been Inspired by PlanB Article Quant Investing 101.
With this script, I implemented Plan B strategy outlined in that article, trying to reproduce his findings independently and allowing TradeView Users to do the same.
PlabB is aware of this effort, and he's positive about it, via Twitter commenting, liking and sharing of this resource .
Trading Idea:
This script uses RSI index to determine the Buy And Sell signal.
As per the original PlanB article:
IF ( RSI was above 90% last six months AND drops below 65%) THEN sell,
IF ( RSI was below 50% last six months AND jumps +2% from the low) THEN buy, ELSE hold
My simple code is aimed at replicating his study in Pine so that every TV user can check his signal.
Rob Booker - ADX Breakout updated to pinescript V5Rob Booker - ADX Breakout. The strategy remains unchanged but the code has been updated to pinescript V5. This enables compatibility with all new Tradingview features. Additonally, indicators have been made more easily visible, default cash settings as well as input descriptions have been added.
Rob Booker - ADX Breakout: (Directly taken from the official Tradingview V1 version of the script)
Definition
Rob Booker’s Average Directional Index (ADX) Breakout is a trend strength indicator that affirms the belief that trading in the direction of a trend and continuing to follow its pull is more profitable for traders, while simultaneously reducing risk.
History
ADX was traditionally used and developed to determine a price’s trend strength. It is commonly known as a tool from the arsenal of Rob Booker, experienced entrepreneur and currency trader.
Calculations
Calculations for the ADX Breakout indicator are based on a moving average of price range expansion over a specific period of time. By default, the setting rests at 14 bars, this however is not mandatory, as other periods are routinely used for analysis as well.
Takeaways
The ADX line is used to measure and determine the strength of a trend, and so the direction of this line and its interpretation are crucial in a trader’s analysis. As the ADX line rises, a trend increases in strength and price moves in the trend’s direction. Similarly, if the ADX line is falling, a trend decreases in strength and price then enters a period of consolidation, or retracement.
Traditionally, the ADX is plotted on the chart as a single line that consists of values that range from 0-100. The line is non-directional, meaning that it always measures trend strength regardless of the position of a price’s trend (up or down). Essentially, ADX quantifies trend strength by presenting in both uptrends and downtrends of the line.
What to look for
The values associated with the ADX line help traders determine the most profitable trades and where risk lies in the current trend. It is important to know how to quantify trend strength and distinguish between the varying values in order to understand the differences in trending vs. non-trending conditions. Let’s take a look at ADX values and what they mean for trend strength.
ADX Value:
0-25: Signifies an absent of weak trend
25-50: Signifies a strong trend
50-75: Signifies a very strong trend
75-100: Signifies an extremely strong trend
To delve into this a bit further, let’s assess the meaning of ADX if it is valued below 25. If the ADX line remains below 25 for more than 30 or so bars, price then enters range conditions, making price patterns more distinguishable and visible to traders. Price will move up and down between resistance and support in order to determine selling and buying interest and may then eventually break out into a trend or pattern.
The way in which ADX peaks, ebs, and flows is also a signifier of its overall pattern and trend momentum. The line can clearly indicate to the trader when trend strength is strong versus when it is weak. When ADX peaks are pictured as higher, it points towards an increase in trend momentum. If ADX peaks are pictured as lower - you guessed it - it points towards a decrease in trend momentum. A trend of lower ADX peaks could be a warning for traders to watch prices and manage and assess risk before a trade gets out of hand. Similarly, whenever there is a sudden move that seems out of place or a change in trend character that goes against what you’ve seen before, this should be a clear sign to watch prices and assess risk.
Summary
The ADX Breakout indicator is a trend strength indicator that analyzes price movements relative to trend strength to signal a user when is best for a trade and when is best to manage risk and assess patterns. As long as a trader recognizes strong trends and assesses the risk of each trade properly, they should have no problem using this indicator and utilizing it to work in their favor. In addition, the ADX helps identify trending conditions, but while doing so, also aids traders in finding strong trends to trade. The indicator can even alert traders to specific changes in trend momentum, allowing them to be primed for risk management.

Ichimoku Cloud with RSI (By Coinrule)The Ichimoku Cloud is a collection of technical indicators that show support and resistance levels, as well as momentum and trend direction. It does this by taking multiple averages and plotting them on a chart. It also uses these figures to compute a “cloud” that attempts to forecast where the price may find support or resistance in the future.
The Ichimoku Cloud was developed by Goichi Hosoda, a Japanese journalist, and published in the late 1960s. It provides more data points than the standard candlestick chart. While it seems complicated at first glance, those familiar with how to read the charts often find it easy to understand with well-defined trading signals.
The Ichimoku Cloud is composed of five lines or calculations, two of which comprise a cloud where the difference between the two lines is shaded in.
The lines include a nine-period average, a 26-period average, an average of those two averages, a 52-period average, and a lagging closing price line.
The cloud is a key part of the indicator. When the price is below the cloud, the trend is down. When the price is above the cloud, the trend is up.
The above trend signals are strengthened if the cloud is moving in the same direction as the price. For example, during an uptrend, the top of the cloud is moving up, or during a downtrend, the bottom of the cloud is moving down.
This strategy combines the Ichimoku Cloud with the RSI indicator to better enter trades.
Long/Short orders are placed when three basic signals are triggered.
Long Position:
Tenkan-Sen is above the Kijun-Sen
Chikou-Span is above the close of 26 bars ago
Close is above the Kumo Cloud
RSI is greater less than 50
Short Position:
Tenkan-Sen is below the Kijun-Sen
Chikou-Span is below the close of 26 bars ago
Close is below the Kumo Cloud
RSI is greater than 50
The script is backtested from 1 June 2022 and provides good returns.
The strategy assumes each order is using 30% of the available coins to make the results more realistic and to simulate you only ran this strategy on 30% of your holdings. A trading fee of 0.1% is also taken into account and is aligned to the base fee applied on Binance.
This script also works well on SOL (45m timeframe), BNB (1h timeframe), and ETH (1h timeframe).

Gators Oscillator - Bitcoin Scalp Trader(T&M/e V3!!)Gator's Oscillator:
**For reference, all numbers, and settings displayed on the input screen are only what I HAVE FOUND to be profitable for my own strategy, Yours will differ. This is not financial advice and I am not a financial advisor. Please do your due diligence and own research before considering taking entries based on this strategy and indicator. I am not advertising investing, trading, or skills untaught, this is simply to help incorporate into your own strategy and improve your trading journey!**
INPUTS:
EV: This is an integer value set to default at 55. This value is equated to the lead value, volatility measurement, and standard deviation between averages
EV 2: This integer is used as the base value and is meant to always be GREATER THEN EV, the default is set at 163. There should be at least a 90+ integer difference between EVs for data accuracy.
EV TYPE & EV TYPE 2: This option only affects the output for the moving average histograms. (and data inserted for strategy)
Volatility Smoothing: This is the smoothness of the custom-made volatility oscillator. I have this default at 1 to show time-worthy-term (3.9%+) moves or significant trends to correspond with the standard deviation declination between EVMA and EVMA2.
Directional Length: This is the amount of data observed per candle in the bull versus bear indicator.
Take Profit: Pre-set takes profit level that is set to 4 but can be adjusted for user experience.
Style:
Base Length: Columns equated using a custom-made statistical equation derived from EV TYPE 2+EV2 to determine a range of differential in historic averages to a micro-scale.
Lead Length: Columns equated using a custom-made statistical equation derived from EV TYPE+EV to determine a range of differential in historic averages to a micro-scale.
Weighted EMA Differential: Equation expressing the differences between exponential and simple averages derived from EV+EV Type 2. Default is displaying none, but optional for use if found helpful.
Volatility: Represents volatility from multiple data sets spanning from Bollinger bands to HPV and translated through smoothing.
Bull Strength: The strength of Bulls in the current trend is derived from a DMI+RSI+MACD equation to represent where the trend lies.
Bear Strength: The strength of Bears in the current trend is derived from a DMI+RSI+MACD equation to represent where the trend lies.
(NEW) Standard Deviation between Moving Averages: Use this logarithmic indicator depicted as circles to help determine whether a move is a fake out or not. Compare the circles with the volatility line, if you see them deviating away, it is either a bull/bear trap or trend continuation is imminent until they correlate back together.
CHEAT CODE'S NOTES:
Do not use this indicator on high leverage. I have personally used this indicator for a week and faced a max of 8% drawdown, albeit painful I was on low leverage and still closed on my take profit level.
85% is not 100% do not overtrade using this indicator's entry conditions if you have made 4 consecutive profitable trades.
Mess around with the input values and let me know if you find an even BETTER hit rate, 30+ entries, and a good drawdown!!
V2 UPGRADES:
*Increased Opacity on Bull Bear Columns
*Removed the Stop Loss Input option
*Decreased EV2 to a default of 143 for accuracy
*Added additional disclaimers in the description
* Removed Bull/Bear offset values for accuracy
V3 UPGRADES:
*ADDED THE EMA DIFFERENTIAL FROM SMA STANDARD DEVIATION INDICATOR. REPRESENTED BY PURPLE BARS THAT PLOT BRIGHT AT EXTREME LEVELS (Translate this to the EMA's and SMA's are very far apart) This is a fantastic way to resolve volatility and momentum in one indicator!!
*Line Width increased for volatility
*plot's for Oversold Alma reduced to 3, also adjusted the plot shape to arrows corresponding to 'overbought/oversold values. Look for a cross-over from green/red plot to transparent for best signals.
*Histograms for bull/bear strength correspond to an increase or decrease in value
*Input screen converted into groups, with bull/bear color inline
*Converted base/lead length value's into areas with breaks. IF YOU SEE WHITE (Short/Lead Length), IT IS A SHORT TERM MOVE AND SCALPING OPPORTUNITY. IF YOU SEE BLUE(Long/Base Length) IT MEANS IT IS A MACRO MOVE, WHICH MAY LAST LONGER
-Cheat Code
BINANCE:BTCUSDT BYBIT:BTCUSDT COINBASE:BTCUSD

RSI Improved strategySet a Horizontal Ray at the price that relates highest / lowest RSI .
It 's more clear to decide when to open long / short position manually.
It's a scalping strategy that works in 15min chart(basically works in most of timeframe , if you don't look it as a scalping strategy), when RSI hits Highest / Lowest value , the strategy will open a Long / Short position.
The Default Risk Reward Ratio was 1 (1600 points : 1600 points) you can adjust it in settings
You guys can look it as a RSI alert indicator
Think before you do , use it wisely. Thanks a lot!
There is a lot of useless words in Pine if you wanna look it please ignore it.

Bollinger Bands and RSI Short Selling (by Coinrule)The Bollinger Bands are among the most famous and widely used indicators. A Bollinger Band is a technical analysis tool defined by a set of trendlines plotted two standard deviations (positively and negatively) away from a simple moving average ( SMA ) of a security's price, but which can be adjusted to user preferences. They can suggest when an asset is oversold or overbought in the short term, thus provide the best time for buying and selling it.
The relative strength index ( RSI ) is a momentum indicator used in technical analysis . RSI measures the speed and magnitude of a security's recent price changes to evaluate overvalued or undervalued conditions in the price of that security. The RSI can do more than point to overbought and oversold securities. It can also indicate securities that may be primed for a trend reversal or corrective pullback in price. It can signal when to buy and sell. Traditionally, an RSI reading of 70 or above indicates an overbought situation. A reading of 30 or below indicates an oversold condition.
The short order is placed on assets that present strong momentum when it's more likely that it is about to decrease further. The rule strategy places and closes the order when the following conditions are met:
ENTRY
The closing price is greater than the upper standard deviation of the Bollinger Bands
The RSI is less than 70
EXIT
The trade is closed in profit when the RSI is less than 70
Upper standard deviation of the Bollinger Band is greater than the the closing price.
This strategy comes with a stop loss and a take profit, and as you can see by the results, it is well suited for a bear market.
This trade works very well with ETH (1h timeframe), AVA (4h timeframe), and SOL (3h timeframe) and is backtested from the 1 December 2021 to capture how this strategy would perform in a bear market.
To make the results more realistic, the strategy assumes each order to trade 30% of the available capital. A trading fee of 0.1% is taken into account. The fee is aligned to the base fee applied on Binance, which is the largest cryptocurrency exchange.

T&M/E Wave V2Trend and Momentum With Exception Wave Indicator and Strategy:
This strategy is hand made and I have spent days and many hours making it. The strategy is meant to determine the power between buyers and sellers, match the current power with a historic trend (through a moving average statistical equation), and finally volatility (measured with a mix between standard deviation from Bollinger Bands and HPV). Below will be a list of how to determine the inputs for the indicator
**For reference, all numbers, and settings displayed on the input screen are only what I HAVE FOUND to be profitable for my own strategy, Yours will differ. This is not financial advice and I am not a financial advisor. Please do your due diligence and own research before considering taking entries based on this strategy and indicator. I am not advertising investing, trading, or skills untaught, this is simply to help incorporate into your own strategy and improve your trading journey!**
INPUTS:
EV: This is an integer value set to default at 55. This value is equated to the lead value, volatility measurement, and standard deviation between averages
EV 2: This integer is used as the base value and is meant to always be GREATER THEN EV, the default is set at 163. There should be at least a 90+ integer difference between EVs for data accuracy.
EV TYPE & EV TYPE 2: This option only affects the output for the moving average histograms. (and data inserted for strategy)
Volatility Smoothing: This is the smoothness of the custom-made volatility oscillator. I have this default at 1 to show time-worthy-term (3.9%+) moves or significant trends to correspond with the standard deviation declination between EVMA and EVMA2.
Directional Length: This is the amount of data observed per candle in the bull versus bear indicator.
Take Profit: Pre-set takes profit level that is set to 4 but can be adjusted for user experience.
Style:
Base Length: Columns equated using a custom-made statistical equation derived from EV TYPE 2+EV2 to determine a range of differential in historic averages to a micro-scale.
Lead Length: Columns equated using a custom-made statistical equation derived from EV TYPE+EV to determine a range of differential in historic averages to a micro-scale.
Weighted EMA Differential: Equation expressing the differences between exponential and simple averages derived from EV+EV Type 2. Default is displaying none, but optional for use if found helpful.
Volatility: Represents volatility from multiple data sets spanning from Bollinger bands to HPV and translated through smoothing.
Bull Strength: The strength of Bulls in the current trend is derived from a DMI+RSI+MACD equation to represent where the trend lies.
Bear Strength: The strength of Bears in the current trend is derived from a DMI+RSI+MACD equation to represent where the trend lies.
CHEAT CODE'S NOTES:
Do not use this indicator on high leverage. I have personally used this indicator for a week and faced a max of 8% drawdown, albeit painful I was on low leverage and still closed on my take profit level.
85% is not 100% do not overtrade using this indicator's entry conditions if you have made 4 consecutive profitable trades.
Mess around with the input values and let me know if you find an even BETTER hit rate, 30+ entries and a good drawdown!!
V2 UPGRADES:
*Increased Opacity on Bull Bear Columns
*Removed the Stop Loss Input option
*Decreased EV2 to a default of 143 for accuracy
*Added additional disclaimers in the description
* Removed Bull/Bear offset values for accuracy
-Cheat Code
BYBIT:BTCUSDT

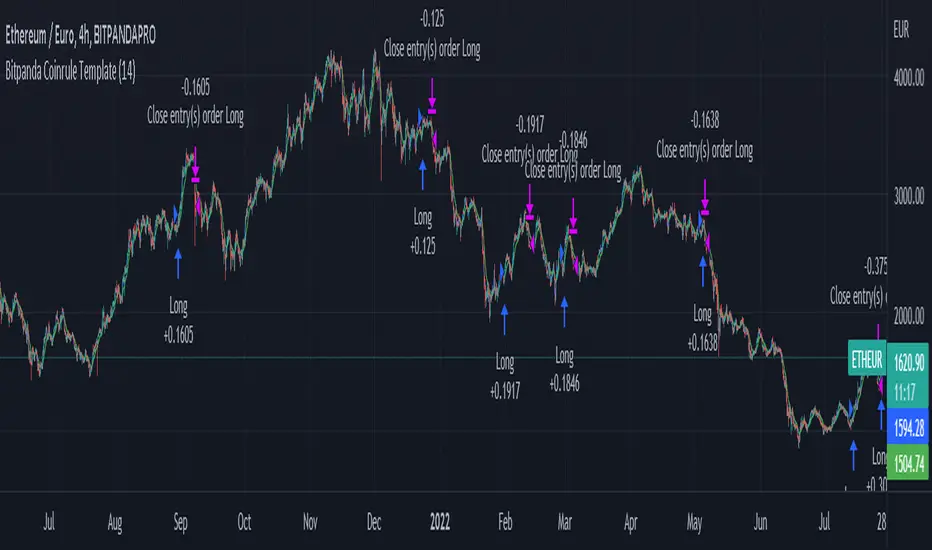
Bitpanda Coinrule TemplateThis strategy for Bitpanda on the Coinrule platform utilises 3 different conditions that have to be met to buy and 1 condition to sell. This strategy works best on the ETH/EUR pair on the 4 hour timescale.
In order for the strategy to enter the trade it must meet all of the conditions listed below.
ENTRY
RSI increases by 5
RSI is lower than 70
MA9 crosses above MA50
EXIT
MA50 crosses above MA9
This strategy works well on LINK/EUR on the 1 day timeframe, MIOTA/EUR on the 2 hour timeframe, BTC/EUR on the 4 hour timeframe and BEST/EUR on the 1 day timeframe (and 4h).
Back tested from 1 January 2020.
The strategy assumes each order is using 30% of the available coins to make the results more realistic and to simulate you only ran this strategy on 30% of your holdings. A trading fee of 0.1% is also taken into account and is aligned to the base fee applied on Binance.
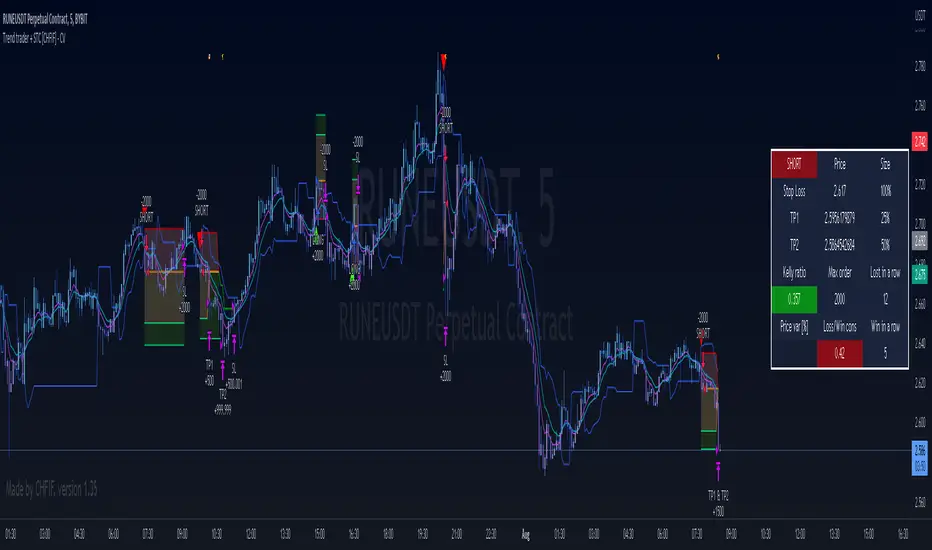
Trend trader + STC [CHFIF] - CV This script is my first strategy script coupling the Trend trader (indicator developed by Andrew Abraham in the Trading the Trend article of TASC September 1998.) and Schaff Trend Cycle . The STC indicator is widely used to identify trends and their directions. It is sometimes used by traders to predict trend reversals as well. Based on the movement of the Schaff Trend Cycle , buy or sell signals are generated, which are then used by traders to initiate either long or short positions.
Around I built a user interface to help you in creating a customized strategy to your need.
My idea behind doing this was to make customizable parameters and back testing easier than manually with a lot of flexibility and options. More possibility we have, more solutions we find right? So I started this script few weeks ago to be my first script (second in reality, but first to be published.)
Strategy it self is made out of 2 simple step:
1→ STC gives a Buy/Sell signal.
2→Price is closing above the TT (Buy) or below (Sell) and the signal is the same as given by the STC .
To complete your strategy in order to reach the best result, I added few options:
→ Money management: Define the type of risk you want to take (entry risk will always risk the same percentage of your portfolio disregarding the size of the SL, Fix amount of money, fix amount of the capital (portfolio). NOTE: Margin is not coded yet, target is to show liquidation price. Please keep an eye on the releases to know when it is released.
→ Stop loss and Take profit management: Define the type of target you want to use (ATR, fixed percentage, pivots points) and even customise different take profit level or activate the trailing. Each type of target is customizable via the menu
→ Moving average: You can also complete the strategy using different moving average. To draw it tick the box on the left, to use it in the calculation of the result, tick the box "Price>MA" in front of the needed EMA . You can select different type of MA ( SMA , EMA , DEMA , TEMA , RMA, HMA , WMA , VWAP , VWMA , etc...)
→ RSI: 4 possible approach to use the RSI to complement the strategy:
• OB/OS => short position will be taken only if RSI goes under the lower limit. Long if the RSI goes above the limit. Ticking confirmation will wait to cross back the limit to validate the condition
• Rev OB/OS => Short will be taken if RSI is below lower limit and stays below. Long will be taken if RSI is above upper limit and stays above.
• MA dominance => RSI has to be above MA for long, below for short. Confirmation box ticked requires 2 bars with the RSI on a side to validate signal.
• MA Dominance + limit => It is a combination of the requirement of the provious option and also Rev. OB/OS
→ Volume confirmation => This will consider the volume MA for entry confirmation. The volume will have to be above the MA define by the value entered in the field.
→ Waddah Attar explosion indicator can also be used as a filter for entries in this way:
• Explosion line > dead zone to validate entries
• Trend > dead zone to validate entry
• Both > dead zone is a compound of both rules above to get entry confirmation
→ ADX can also be used as a filter. I added 2 Threshold in order to have a minimum level of acceptance for valid entry but also a maximum level.
When your strategy is setup, you can setup alerts and I would recommend to setup the date range before doing the alerts. Why? Simply because the script do not cover pyramiding and will give a signal only if a trade is not ongoing.
In setting up the sessions at which you would want to trade, no signal within those range can be missed. You can setup 2 sessions, the days and also the global range of backtesting.
Smoothed Heikin Ashi Trend on Chart - TraderHalai BACKTESTSmoothed Heikin Ashi Trend on chart - Backtest
This is a backtest of the Smoothed Heikin Ashi Trend indicator, which computes the reverse candle close price required to flip a Heikin Ashi trend from red to green and vice versa. The original indicator can be found in the scripts section of my profile.
This particular back test uses this indicator with a Trend following paradigm with a percentage-based stop loss.
Note, that backtesting performance is not always indicative of future performance, but it does provide some basis for further development and walk-forward / live testing.
Testing was performed on Bitcoin , as this is a primary target market for me to use this kind of strategy.
Sample Backtesting results as of 10th June 2022:
Backtesting parameters:
Position size: 10% of equity
Long stop: 1% below entry
Short stop: 1% above entry
Repainting: Off
Smoothing: SMA
Period: 10
8 Hour:
Number of Trades: 1046
Gross Return: 249.27 %
CAGR Return: 14.04 %
Max Drawdown: 7.9 %
Win percentage: 28.01 %
Profit Factor (Expectancy): 2.019
Average Loss: 0.33 %
Average Win: 1.69 %
Average Time for Loss: 1 day
Average Time for Win: 5.33 days
1 Day:
Number of Trades: 429
Gross Return: 458.4 %
CAGR Return: 15.76 %
Max Drawdown: 6.37 %
Profit Factor (Expectancy): 2.804
Average Loss: 0.8 %
Average Win: 7.2 %
Average Time for Loss: 3 days
Average Time for Win: 16 days
5 Day:
Number of Trades: 69
Gross Return: 1614.9 %
CAGR Return: 26.7 %
Max Drawdown: 5.7 %
Profit Factor (Expectancy): 10.451
Average Loss: 3.64 %
Average Win: 81.17 %
Average Time for Loss: 15 days
Average Time for Win: 85 days
Analysis:
The strategy is typical amongst trend following strategies with a less regular win rate, but where profits are more significant than losses. Most of the losses are in sideways, low volatility markets. This strategy performs better on higher timeframes, where it shows a positive expectancy of the strategy.
The average win was positively impacted by Bitcoin’s earlier smaller market cap, as the percentage wins earlier were higher.
Overall the strategy shows potential for further development and may be suitable for walk-forward testing and out of sample analysis to be considered for a demo trading account.
Note in an actual trading setup, you may wish to use this with volatility filters, combined with support resistance zones for a better setup.
As always, this post/indicator/strategy is not financial advice, and please do your due diligence before trading this live.
Original indicator links:
On chart version -
Oscillator version -
Update - 27/06/2022
Unfortunately, It appears that the original script had been taken down due to auto-moderation because of concerns with no slippage / commission. I have since adjusted the backtest, and re-uploaded to include the following to address these concerns, and show that I am genuinely trying to give back to the community and not mislead anyone:
1) Include commission of 0.1% - to match Binance's maker fees prior to moving to a fee-less model.
2) Include slippage of 10 ticks (This is a realistic slippage figure from searching online for most crypto exchanges)
3) Adjust account balance to 10,000 - since most of us are not millionaires.
The rest of the backtesting parameters are comparable to previous results:
Backtesting parameters:
Initial capital: 10000 dollars
Position size: 10% of equity
Long stop: 2% below entry
Short stop: 2% above entry
Repainting: Off
Smoothing: SMA
Period: 10
Slippage: 10 ticks
Commission: 0.1%
This script still remains to shows viability / profitablity on higher term timeframes (with slightly higher drawdown), and I have included the backtest report below to document my findings:
8 Hour:
Number of Trades: 1082
Gross Return: 233.02%
CAGR Return: 14.04 %
Max Drawdown: 7.9 %
Win percentage: 25.6%
Profit Factor (Expectancy): 1.627
Average Loss: 0.46 %
Average Win: 2.18 %
Average Time for Loss: 1.33 day
Average Time for Win: 7.33 days
Once again, please do your own research and due dillegence before trading this live. This post is for education and information purposes only, and should not be taken as financial advice.

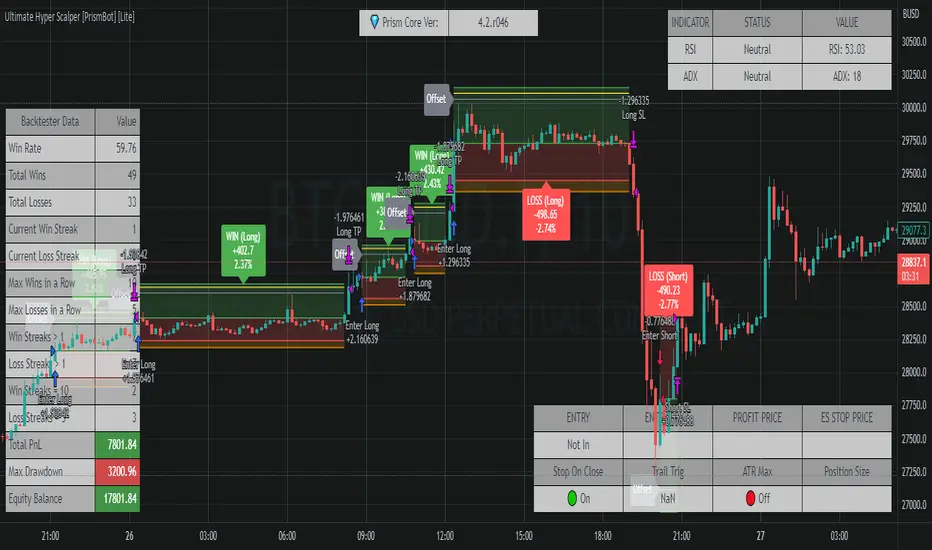
Ultimate Hyper Scalper Strategy [PrismBot] [Lite]💎 Prism Core Initial Release
ver 3.4.r379
This strategy is built on on a modified and reworked older version of the Waddah Attar Explosion strategy. It contains several confluence indicators such as Triple EMAs, volume, consolidation, ADX, and Bull Bear Power.
The Waddah Attar Indicator strategy is based on the following conditions:
LONG
trend is up
explosion line is greater than the dead zone line or a set threshold
SHORT
trend is down
explosion line is greater than the dead zone line or a set threshold
While this is a very simple strategy on the surface, the WAE indicator is great for finding strong trending markets and as it can be considered high frequency, can be paired with other confluence such as the ADX indicator to find high volatility movements.
This strategy also contains a myriad of custom order features, such as controlling the type of position sizes you open with Risk %, volatility, ATR based stops, and much more.
If you have any questions about this strategy or its features, you can ask in the comments below, or DM me here on Tradingview.
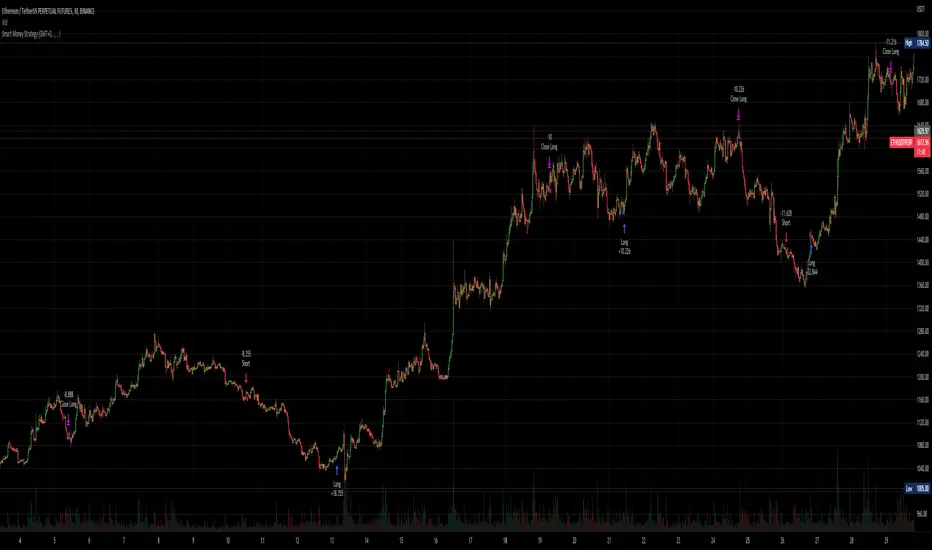
Smart Money - Oscillator and Volume StrategyOverview
This is a no-repaint strategy that is highly optimized for BINANCE:ETHUSDTPERP 30m, normal candles. It is a long/short strategy that is based on CMF, ADX/DMI, Keltner Channels, and other oscillators to identify smart money.
The overall idea of the strategy is to effectively capture the beginnings and ends of trends in price action, and go long/short accordingly. To achieve this, potential entry points are identified with various oscillators and these are then filtered using a variety of moving averages and strength/momentum indicators.
Short and sell inflections are found when ADX, DMI, and/or CMF oscillate below a specified threshold, and Keltner Channels are also used to indicate potential trades.
The indicator will continue to be updated and optimized for current and future market conditions.
If purchased, access to the indicator will be available within 24 hours.
Backtest Results
Parameters:
- 2021-01-01 to present (19 months)
- 100% equity order size
- 0.04% commission fees
- No leverage
17,089% net profit through 296 trades with 60.47% of trades being profitable.
Profit factor of 2.862, Sharpe Ratio of 1.158
Parameters:
- 2021-01-01 to present (19 months)
- $1,000 initial capital
- $1,000 order size
- 0.04% commission fees
- No leverage
584% net profit through 296 trades with 60.47% of trades being profitable.
Parameters:
- 2021-01-01 to present (19 months)
- 500% equity order size
- 0.04% commission fees
- 5x leverage
8,587,557% net profit through 299 trades with 59.87% of trades being profitable.
3C Crossover with TTP & TSLThis is not a set and forget strategy. It needs constant tweaking to maintain a high winrate. Also what works on one pair can be horrible on another.
This strategy works best on the 1 min or 5 min TF but also works well on the 15 min. Haven't done any testing in higher TF's as im only interested in scalping.
If enabled you can retrive data for the filters on any TF.
The strategy do not repaint.
You do not need a 3c subscription to run this strategy as the bot turns on and off the bot itself.
Instructions for the 3commas connector:
1. First, you need to prepare 3commas Long/Short bots that will only listen to custom TV signals.
2. Inputs for the 3commas bot can be found at the end of the user inputs.
3. Once you have entered the required details into the inputs, turn on 3commas comments. They should appear on the chart (looks messy).
4. Now you can add the alert where you should paste the 3commas Webhook URL: 3commas.io
5. For the alert message text insert the placeholder {{strategy.order.comment}} and delete the rest. 6. Once the alert is saved, you can turn off those 3commas comments to have a clearer chart.
7. With a new alert, the bot and trade should launch.
Long or Short trades are determined with a crossing of the fast MA over the slow MA for Long and the opposite for Short. By checking Close position on MA cross the deal will close on a crossover/under of the 2 MA's
You can select from various different MA's and of course lenghts. You can add both EMA filter on any lenght aswell as ATR to determine to go long or short.
Using the MA gap can help you to not enter trades in a low volatile ranging market.
The RSI filter, sets the maximum RSI threshold for a long position and the minimum for a short. By default and what i recomend is that you enter Longs when RSI is above 50 and shorts when RSI are below 50.
-You can set confirmation of the trade direction with RSI , i.e. for Long the RSI must rise a specified number of bars back, vice versa for Short.
Enabling the pullback filter is great to avoid Longing tops and Shorting bottoms.
Stop loss can be set be either a fixed percentage or by using ATR
Take profit can be set by using percentage, ATR or RiskReward ratio(RR). if you use ATR as a stoploss i recomend using RR as the TP.
Yu can choose to trail the TP with either Percentage or ATR
Whats ahead. I really want to incorporate RSI divergencies, but haven't figured out how yet. Any other ideas would be greatly appreciated.
Have a look at my other strategies. They are similar to this but works abit differently.

3C MACD & RSI Scalper no repaintThis is not a set and forget strategy. It needs constant tweaking to maintain a high winrate. Also what works on one pair can be horrible on another.
This strategy works best on the 1 min or 5 min TF but also works well on the 15 min. Haven't done any testing in higher TF's as im only interested in scalping.
If enabled you can retrive data on the MACD and RSI from any timeframe.
The strategy do not repaint.
You can filter on sessions as well as days. Often trading during say only the EU times and not trading during weekends yields better results. This is because weekeds and eg. the Asia Sessions are alot less volatile.
You do not need a 3c subscription to run this strategy as the bot turns on and off the bot itself.
Instructions for the 3commas connector:
1. First, you need to prepare 3commas Long/Short bots that will only listen to custom TV signals.
2. Inputs for the 3commas bot can be found at the end of the user inputs.
3. Once you have entered the required details into the inputs, turn on 3commas comments. They should appear on the chart (looks messy).
4. Now you can add the alert where you should paste the 3commas Webhook URL: 3commas.io
5. For the alert message text insert the placeholder {{strategy.order.comment}} and delete the rest. 6. Once the alert is saved, you can turn off those 3commas comments to have a clearer chart.
7. With a new alert, the bot and trade should launch.
Long or Short trades are determined with a crossing of the fast MA over the slow MA for Long and the opposite for Short. Trades should only happen close to the crossovers.
You can select from various different MA's and of course lenghts. I often find that using HEMA as the fast MA and DEMA as the slow give more trades while also maintaining a high winrate.
Then for Long we use the MACD indicator where we look for high peaks in negative values for Long and vice versa for Shorts. These should be significantly higher than other peaks (or if you will lower peaks for a Long).
The key is to detect high peaks on the histogram, which we will try to achieve by checking if the last 2 values were higher than X bars back. If you want to make it even more specific, then you can turn on the additional checkbox which compares the current value to the average value of X bars back, and if it is greater than, say, 72% the value of the average then it's ok to enter the trade.
The RSI filter, sets the maximum RSI threshold for a long position and the minimum for a short. By default and what i recomend is that you enter Longs when RSI is above 50 and shorts when RSI are below 50.
-You can set confirmation of the trade direction with RSI, i.e. for Long the RSI must rise a specified number of bars back, vice versa for Short.
Enabling the pullback filter is great to avoid Longing tops and Shorting bottoms.
Whats ahead. I really want to incorporate RSI divergencies, but haven't figured out how yet. Any other ideas would be greatly appreciated.
Have a look at my other strategies. They are similar to this but works abit differently.
The 3 strike line and the engulfing candles are not something that has an impact on the script yet, and might never be. But i do like to turn them on for a visual to see if the trade the strategy opened is a good one.

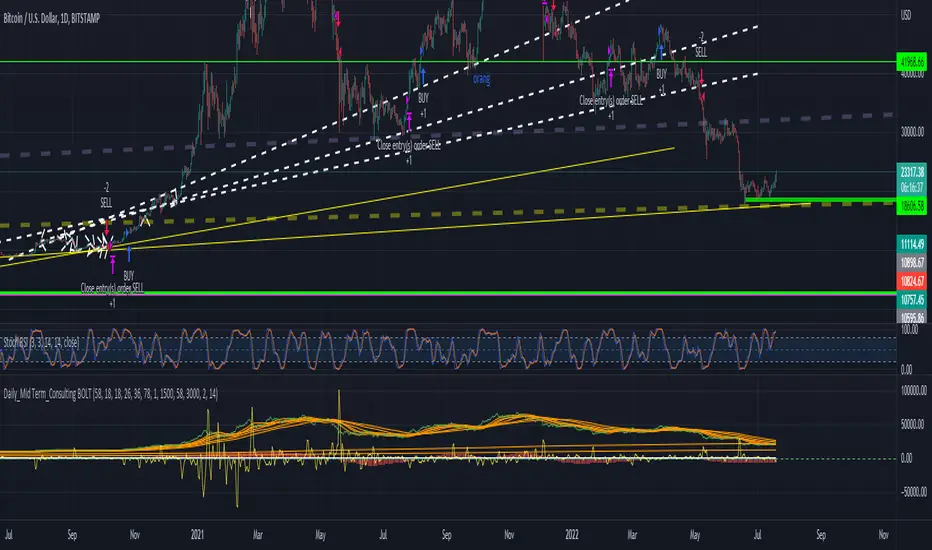
Daily_Mid Term_Consulting BOLTDaily Mid Term Consulting BOLT es una estrategia a mediano y largo plazo creada para detectar los cambios tendenciales en zonas de tiempo diarias. se basa en el análisis de los cambios porcentuales que sufre el precio contra las distintas medias móviles simples definidas en la estrategia. el uso de osciladores como el MACD , RSI y EFI apoyan la decisión de entrada a la estrategia.
actualmente esta en construcción la colocación de stop losses para aumentar la eectividad de la misma.
Inverse MACD + DMI Scalping with Volatility Stop (By Coinrule)This script is focused on shorting during downtrends and utilises two strength based indicators to provide confluence that the start of a short-term downtrend has occurred - catching the opportunity as soon as possible.
This script can work well on coins you are planning to hodl for long-term and works especially well whilst using an automated bot that can execute your trades for you. It allows you to hedge your investment by allocating a % of your coins to trade with, whilst not risking your entire holding. This mitigates unrealised losses from hodling as it provides additional cash from the profits made. You can then choose to hodl this cash, or use it to reinvest when the market reaches attractive buying levels.
Alternatively, you can use this when trading contracts on futures markets where there is no need to already own the underlying asset prior to shorting it.
ENTRY
The trading system uses the Momentum Average Convergence Divergence (MACD) indicator and the Directional Movement Index (DMI) indicator to confirm when the best time is for selling. Combining these two indicators prevents trading during uptrends and reduces the likelihood of getting stuck in a market with low volatility.
The MACD is a trend following momentum indicator and provides identification of short-term trend direction. In this variation it utilises the 12-period as the fast and 26-period as the slow length EMAs, with signal smoothing set at 9.
The DMI indicates what way price is trending and compares prior lows and highs with two lines drawn between each - the positive directional movement line (+DI) and the negative directional movement line (-DI). The trend can be interpreted by comparing the two lines and what line is greater. When the negative DMI is greater than the positive DMI, there are more chances that the asset is trading in a sustained downtrend, and vice versa.
The system will enter trades when two conditions are met:
1) The MACD histogram turns bearish.
2) When the negative DMI is greater than the positive DMI.
EXIT
The strategy comes with a fixed take profit combined with a volatility stop, which acts as a trailing stop to adapt to the trend's strength. Depending on your long-term confidence in the asset, you can edit the fixed take profit to be more conservative or aggressive.
The position is closed when:
Take-Profit Exit: +8% price decrease from entry price.
OR
Stop-Loss Exit: Price crosses above the volatility stop.
In general, this approach suits medium to long term strategies. The backtesting for this strategy begins on 1 April 2022 to 18 July 2022 in order to demonstrate its results in a bear market. Back testing it further from the beginning of 2022 onwards further also produces good returns.
Pairs that produce very strong results include SOLUSDT on the 45m timeframe, MATICUSDT on the 2h timeframe, and AVAUSDT on the 1h timeframe. Generally, the back testing suggests that it works best on the 45m/1h timeframe across most pairs.
A trading fee of 0.1% is also taken into account and is aligned to the base fee applied on Binance.

Rajiv Patel Strategy with ATR RSI CCI MACD EMA IchimokuRajiv Patel Strategy with alerts helps to identify entry and exit levels based on following Indicators.
1. ATR Trailing Stoploss
2. RSI
3. CCI
4. MACD
5. EMA
6. SMA
7. Ichimoku
This Strategy is fully customizable as per your trading style. Below are some examples of how once can use the Strategy.
Options Based on Each Indicator Individually.
1. ATR Trailing Stoploss – When price is above ATR Trailing Stoploss line its in buy zone and when below its in sell zone. The setting of ATR Trailing Stoploss are customizable like ATR Periods and ATR Multiplier. Suggest increasing ATR Multiplier with lower timeframe. Aggressive buyers can decrease ATR Period in higher timeframe as per trade plan.
2. RSI – RSI above EMA Length is buy zone and below is sell zone. Conservative buyers can increase the RSI & EMA Length period while aggressive and reduce. Higher the timeframe gives better results.
3. CCI – Similar to RSI the buy zone is when CCI crosses above EMA Length. Again CCI & EMA Length can be customised as per trade plan. Higher timeframe is advised.
4. MACD – MACD parameters default settings are based on trying to get early entry. One can change to 26, 13 and 9 in lower timeframe. When MACD crosses above Signal line its buy zone and when below its sell zone.
5. EMA – 5 EMA lines and 2 SMA lines can be plotted. The settings of both EMA lines and SMA lines can be adjusted based on timeframe and trade plan.
6. EMA – EMA line 1 and 2 can be used as buy when EMA1 crosses above EMA2 and sell when below. The length of EMA1 & 2 is adjustable. Suggest modifying based on timeframe and trade plan.
7. SMA – SMA1 can also be used as solo indicator. If price is below SMA1 then its no buy area and if above, then in buy area. SMA2 can be used to identify if trend is upward or downward based on user settings.
8. Ichimoku – It predicts price movements bit like moving averages. Offers a unique perspective of support and resistance levels.
Conversion Line (Tenkan Sen)
- Measures Short Term Trend
- Signals an area of minor support and resistance
Base Line (Kijun Sen)
- Measures Medium term trend
- Used as Trailing Stop Level
Lagging Span (Chikou Span)
- Used for confirmation of signals
- Can also serve as Support and Resistance Level
Kumo Cloud
- Formed of two lines: Senkou Span A (Green Line) and Senkou Span B (Red Line)
- Dynamic Support and Resistance
HOW TO READ ICHIMOKU INDICATOR
Conversion Line (Tenkan Sen)
- If Price is above the Conversion Line = Short term upward movement
- If Price is below the Conversion Line = Short term downward movement
- Increasing Conversion Line = Short term uptrend
- Decreasing Conversion Line = Short term downtrend
Base Line (Kijun Sen)
- If Price is above the baseline = Medium term uptrend
- If the Market price is below the baseline = Medium term downtrend
- Increasing Base Line = Medium term uptrend
- Decreasing Base Line = Medium term downtrend
Lagging Span
- The Evolution of the current price action in relation to previous price action
- If the Lagging span is above the current price = Bullish Bias
- If the Lagging span is below the current price = Bearish Bias
- Lagging span near the current price = Trading range
Kumo Cloud
- Dynamic Support and Resistance based upon price action.
- The longer the price stays below/above the Kumo cloud, stronger the trend
- When the cloud is wide, the expected support or resistance is strong
- When the cloud is thin, the expected support or resistance is weak
- Never trade when price is inside Kumo Cloud
HOW TO TRADE WITH ICHIMOKU CLOUD
1. Baseline and conversion Line crossover (Lagging Span as a Filter)
crossover (conversion line, baseline) = Buy
crossunder (conversion line, baseline) = Sell
FILTER
Crossover (conversion line, baseline) and lagging span is Bullish (i.e above the price) = Buy
Crossunder (conversion line, baseline) and lagging span is Bearish (i.e below the price) = Sell
2. Baseline - Conversion line crossover (Kumo cloud Filter)
Crossover (conversion line, baseline) above the Kumo Cloud = Strong Buy
Crossover (conversion line, baseline) below the Kumo cloud = Weak Buy
Crossunder (conversion line, baseline) below the Kumo Cloud = Strong Sell
Crossunder (conversion line, baseline) above the Kumo Cloud = Weak Sell
3. Kumo Cloud Breakout
When the price enters the Kumo Cloud, and breaks its Upper wall upward = Bullish Signal
When the price enters the Kumo Cloud, and breaks its Lower wall downward = Bearish Signal
4. Kumo Cloud Crossover
When Span A crosses the Span B from below to the upside and prices are positioned above the Kumo Cloud = Strong Buy Signal
When Span A crosses the Span B from upside to the bottom and the prices are positioned below the Kumo Cloud = Strong Sell
When Span A crosses Span B from bottom to the upside and prices are positioned below the Kumo Cloud = Weak Buy Signal
When Span A crosses Span B from the upside to the bottom and the prices are positioned above the Kumo Cloud = Weak Sell Signal
Options Based on Combining Multiple Indicators.
One can select and combine multiple conditions based on above understanding of individual indicator to create a strong Long Entry, Short Entry, Long Exit and Short Exit. This Strategy also provides Alert signal for all entry and exit based on the combinations of conditions selected.
Since this is a strategy one can use STRATEGY TESTER to understand how the strategy has performed over the selected time span. This however does not guarantee similar results in present or future trades.
Please enter commission or total charges charged by your broker in “Properties” Tab of the strategy. Modify all parameters of “Properties” Tab as needed. Note, this can affect the performance results of the strategy.
Need to be very careful in selecting conditions as it becomes very complex with many options available.
Note:
Triangles at the top and bottom indicates the zone. Can be turned on / off using condition “Show Conditions Visually”.
1. Red triangle at top pointing down with ‘S’ indicates in Long Exit zone.
2. Red triangle at top pointing down with ‘EnS’ indicates in Enter Short zone.
3. Green triangle at bottom pointing up with ‘B’ indicates in Long Entry zone.
4. Green triangle at bottom pointing up with ‘ExS’ indicates in Exit Short zone.
5. When the is no triangle either at top or bottom means there is no zone.
Send me your suggestions, will try to incorporate the same in next revision.

TASC 2022.08 Trading The Fear Index█ OVERVIEW
TASC's August 2022 edition of Traders' Tips includes an article by Markos Katsanos titled "Trading The Fear Index". This script implements a trading strategy called the “daily long/short trading system for volatility ETFs” presented in this article.
█ CONCEPTS
This long-term strategy aims to capitalize on stock market volatility by using exchange-traded funds (ETFs or ETNs) linked to the VIX index.
The strategy rules (see below) are based on a combination of the movement of the Cboe VIX index, the readings of the stochastic oscillator applied to the SPY ETF relative to the VIX, and a custom indicator presented in the article and called the correlation trend . Thus, they are not based on the price movement of the traded ETF itself, but rather on the movement of the VIX and of the S&P 500 index. This allows the strategy to capture most of the spikes in volatility while profiting from the long-term time decay of the traded ETFs.
█ STRATEGY RULES
Long rules
Rising volatility: The VIX should rise by more than 50% in the last 6 days.
Trend: The correlation trend of the VIX should be 0.8 or higher and also higher than yesterday's value.
VIX-SPY relative position: The 25-day and 10-day VIX stochastics should be above the 25-day and 10-day SPY stochastics respectively. In addition, the 10-day stochastic of the VIX should be above its yesterday's value.
Long positions are closed if the 10-day stochastic of the SPY rises above the 10-day stochastic of the VIX or falls below the yesterday's value.
Short rules
Declining volatility: The VIX should drop over 20% in the last 6 days and should be down during the last 3 days.
VIX threshold: The VIX should spend less than 35% of time below 15.
VIX-SPY relative position: The 10-day VIX stochastic should be below the 10-day SPY stochastic. In addition, the 10-day SPY stochastic should be higher than the yesterday's value.
Long positions are closed if the first two Long rules are triggered (Rising volatility and Trend).
The script allows you to display the readings of the indicators used in the strategy rules in the form of oscillator time series (as in the preview chart) and/or in the form of a table.
