Ultimate Bullish Divergence for RSI MFI RVSI OBV w/ Buy SignalsThis strategy is based on the Indicator below and includes all of its features.
This version Includes the Strategy tester and a dynamic SL
The only drawdown of this version is that Alerts are not as customizable
Ultimate Bullish Divergence for RSI OBV RVSI MFI w/ Buy Alerts
Oscillators

Rising ADX strategyI have always been a huge fan of ADX. Its good for finding out good trending moves.
But it has been said that only ADX after 20 or 25 is good for trending market, but few trend gets completed at that level.
So I have come up with a logic to find out the rising ADX. This could be used to determine the trending moves from the start.
Buy signal:
When close is greater than moving average 1 and 2. This moving average can be SMA, EMA, WMA or HMA.
When ADX is greater than the threshold range. I have taken 10 as my minimum range.
Of course important of all ADX should be rising which implies trend is about to start.
Buy exit:
When close is less than moving average 1 and 2. This moving average can be SMA, EMA, WMA or HMA.
When ADX is lesser than the threshold range. I have taken 10 as my minimum range.
ADX falling which implies trend is about to end.
Sell signal:
I don't repeat the above logic again.
Everything similar to buy signal except above moving average. For selling it should be below moving average.
Strategy can be tested for long and short sides.
Note: No Repainting as the logic is very simple.
Using this script we can identify the best timeframe the script trend yields profit.
Test and provide your comments.

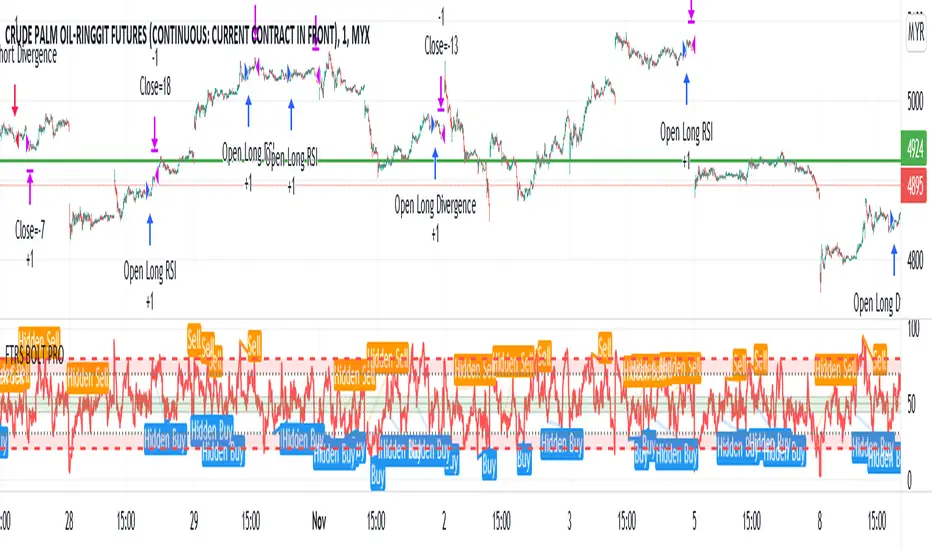
FTRS BOLT PRO
The script uses RSI as major trend identification and supported by RSI divergence for take profit, and also counter trend in certain cases.
Uses EMA 200 for major trend identification to filter false signals, Average Volume as confirmation and faster signal detection to the change of trend.
The indicator detects immediate change of trend and immediately opens position for the major trend.
User can enjoy the RSI with labels of divergence to do manual judgement.
Existing risk to reward ratio based on amount of money instead of ticks count. The currency is depending on the chart's trading currency.
This strategy mainly built for FCPO and its for 1 min settings only. User can toggle the sessions as per users preferences
The default risk to reward ratio is 1:1.5. However, there is a risk management using RSI levels to
Cumulative RSI StrategyI suppose nothing drives a point home like a 10+ year backtest! A couple of weeks ago I published a custom indicator called the Cumulative RSI. This indicator was straight out of chapter 9 of "Short Term Trading Strategies That Work." Today I am publishing a basic sample strategy in that uses the Cumulative RSI as its only entry and exit signals on a Nasdaq 100 leveraged index ETF (TQQQ). In this example, the indicator is being used as a longer term strategy with just 10% leverage over the account equity and a $25k start balance.
If I had it 10 years ago I would probably be retired! I'm sharing because I've found that it can provide an edge when determining exit/take profit points for trades. Many traders wait for a price reversal / trailing-stop to exit a trade when it starts losing. I've found that, using tools like the Cumulative RSI, you can achieve better exit points over the long term. Disclaimer: Even though this example significantly beats buy and hold, I wouldn't advise using it as a stand-alone strategy without significant additions/modifications to strategy and risk management functions.

GEMA-Estrategia por neil-------------------
DESCRIPTION
GEMA-STRATEGY is a strategy generator based on SMA, EMA, WMA, RMA that considers elements such as ADX, DMI, RSI, stochastic, Stoploss, Takeprofit, angles and values at present point.
HOW DOES IT WORK
The component works as an assistant to which you configure the previous elements and you see the performance that it offers you, in such a way that you pass that configuration to GEMA-INDICATOR so that you can receive alerts and do visual trading with notifications or automated trading by sending messages to platforms like 3Commas.
WHY USE IT
The resource operates with one of the most important strategies in the market, which is the price tracking line, which means that if prices go up, we follow it, if prices go down, we follow it; in this way you do not need to make large investments as is often the case with pure BOTs, which require large reserves for security orders.
HOW TO USE IT
Press the "Indicators" option, go to the "Public Library" segment, write the name "GEMA-Estategia por Neil", double click on the record in question and you will have it added in your work panel, now, it only remains to use it and configure its parameters.
-------------------
DESCRIPCIÓN
GEMA-ESTRATEGIA en un generador de estrategias basado en SMA, EMA, WMA, RMA que considera elementos como ADX, DMI, RSI, Estocastico, Stoploss, Takeprofit, ángulos y valores a punto presente.
COMO FUNCIONA
El componente funciona como un asistente al que vas configurando lo elementos anteriores y vas viendo el rendimiento que te ofrece, de manera tal, que pases esa configuración a GEMA-INDICADOR para que puedas recibir alertas y hagas trading visual con notificaciones o trading automatizado enviando mensajes a plataformas como 3Commas.
POR QUÉ USARLO
El recurso opera con una de las estrategias mas importantes del mercado, que es la linea de seguimiento de precio, lo que significa que si los precios suben, lo seguimos, si los precios bajan, lo seguimos; de esta manera no necesita realizar grandes inversiones como suele ocurrir con los BOT puros, que exigen grandes reservas para las ordenes de seguridad.
COMO USARLO
Presione la opción "Indicadores", ubíquese en el segmento "Libreria Publica", escriba el nombre "GEMA-Estrategia por Neil", haga doble clic sobre el registro en cuestión y lo tendrá agregado en su panel de trabajo, ahora, solo resta usarlo y configurar sus paramertos.

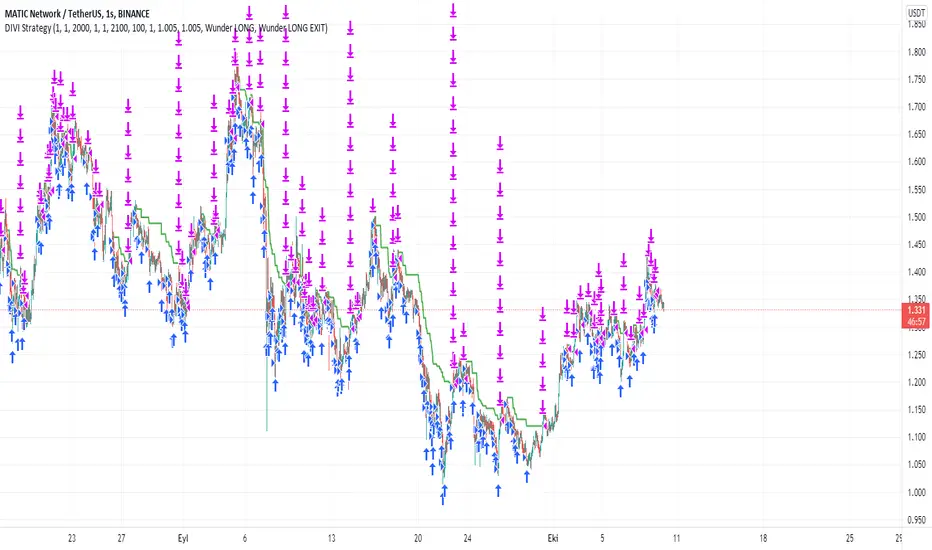
DIVI Wunder StrategyAs it is known, divergence is a situation we encounter very often on graphs. Various divergencies may occur according to many indicators. MACD divergence, RSI divergence... In the strategy I use only positive divergence. What is positive divergence I will explain on MACD positive divergence A MACD positive divergence is a situation in which the MACD does not reach a new low, despite the fact that the price of the stock reached a new low. This is seen as a bullish trading signal—hence, the term “positive divergence.” So I thought of these divergencies and came up with a new strategy. Combining the divergencies with the VOLPIN strategy I wrote earlier, a great strategy has emerged. When the divergence signals are came from MACD,RSI,CCI,OBV,Chaikin Money Flow, VWmacd and Money Flow Index all these indicators I sent a buy signal until the 40 times completed. ThenI sent to sell signal when the price come to take profit level. In this strategy, you divide your principal into as many parts as you want. For example, let's say that you have 1000 dollars of money and you make purchases by dividing this money into 40 equal parts in the default settings of the indicator. $25 per purchase. After each purchase is made as 25 dollars, you can adjust your profit rate from the profit taking settings. When you look at the results of the strategy, your profit rate will be very high. I usually use this strategy in one hour periods. Of course you change it whatever you want. Also change all settings from panel to get more profit. Have fun :)
RSI Overbought Oversold Divergence Strategy w/ Buy/Sell SignalsThis indicator is a copy of my RSI Overbought/Oversold Divergence Indicator with-Alerts
Only difference is that the alerts are disabled, instead it uses tradingviews strategy tester signals
If you want alerts just use the other indicator

Williams Fractals StrategyThis indicator made with using Williams Fractals, 20 50 100 Moving Averages and Relative Strength Index. You can easily find entry points by using Long (L), Short (S) signals.
Note : Settings are optimized for BTC:USDT Perpetual 15min TF. For use different pairs or TFs you may need to change settings.

Dagger V1 strategyThe "Dagger V1 strategy" strategy is used for the backtest of the "Dagger V1 indicator & alerter" indicator. Their algorithm is identical. Further, all descriptions of the settings are the same for the strategy and the indicator.
Dagger is used for trading on the cryptocurrency spot market, but it can also be used for any other fairly volatile pairs.
Dagger shows the best results on the H1 timeframe, but you can experiment with other timeframes.
The logic of Dagger's work is based on the search for the optimal entry point into the market and the best moment to close a deal. Stochastic oscillator and exponential moving EMA are used for this. Also, the exit from the transaction can be optimized using several parameters.
The strategy can use trailing up to one or more red bars in order not to miss the sharp growth of the currency.

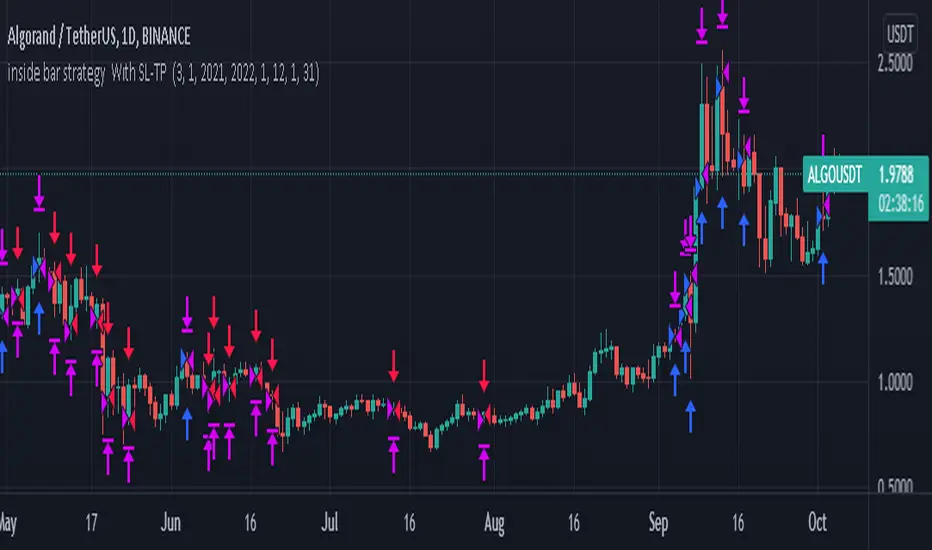
inside bar strategy Wıth SL-TP Based on strat bars to enter trades, you can use it with very low stop loss level and try all coins in daily frequency
TemaVWAPRSI StrategyExchange: Kraken
Timeframe: 5m
Pair: ETH/USD
If you use this for any other exchange or pair, you'll have to tweak the settings, most importantly are the trailing stop ticks. This strategy is currently in what I would call beta mode. It uses the volume weighted average price indicator, rate of change, two triple exponential moving averages and the relative strength index to find buy and sell signals.

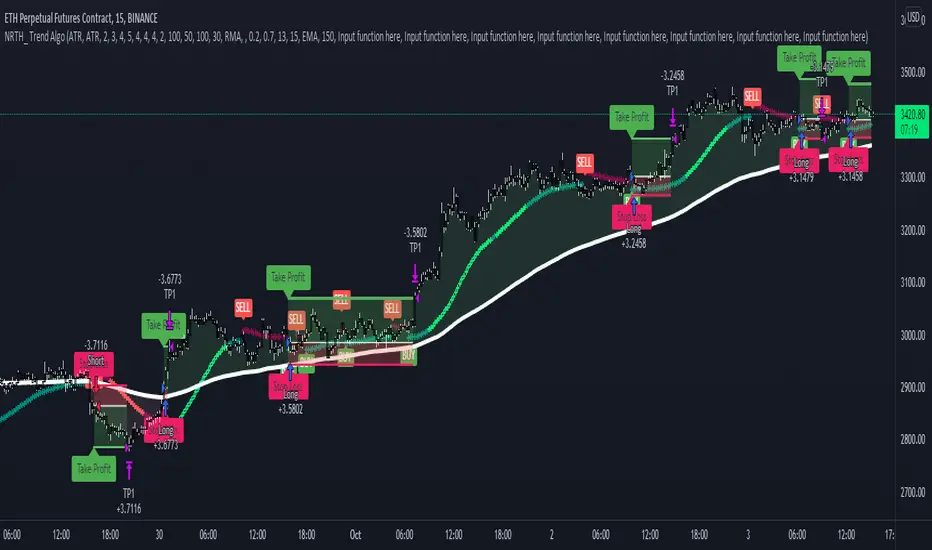
Trend AlgoA NRTH_ Premium Momentum Based Strategy
Comes included with the Premium Package.
Indicator features
Built-In Alerts
Visual Risk Management
Customizable Entry Rules
Usage Tips
This strategy works on timeframes as low as 5m, great for scalping or day trading.
The algo identifies price momentum with strict entry signal settings (can be made more or less sensitive).
Works for all markets with the ability to customize to your liking.
Backtesting Results Info
Period 1/1/2021-1/10/2021
Entry value at $1000 with 10x leverage
Binance standard taker fee rate (0.04%)
ATR Exits : 1:2 RR
-------------------------------------------
Disclaimer
Copyright NRTH_ Indicators 2021.
NRTH_ and all affiliated parties are not registered as financial advisors. The products & services NRTH_ offers are for educational purposes only and should not be construed as financial advice. You must be aware of the risks and be willing to bear any level of risk to invest in financial markets. Past performance is not necessarily indicative of future results. NRTH_ and all individuals associated assume no responsibility for your trading results or investments.
All investments involve risk, and the past performance of a security, industry, sector, market, financial product, trading strategy, or individual’s trading does not guarantee future results or returns. Investors are fully responsible for any investment decisions they make. Such decisions should be based solely on an evaluation of their financial circumstances, investment objectives, risk tolerance, and liquidity needs.
MA&AOThat is quit simple strategy, which combines only two indicators: AO and MA. The logic of trades is also clear, when AO is bullish; slow ma is under the close price; fast ma > slow ma - buy.

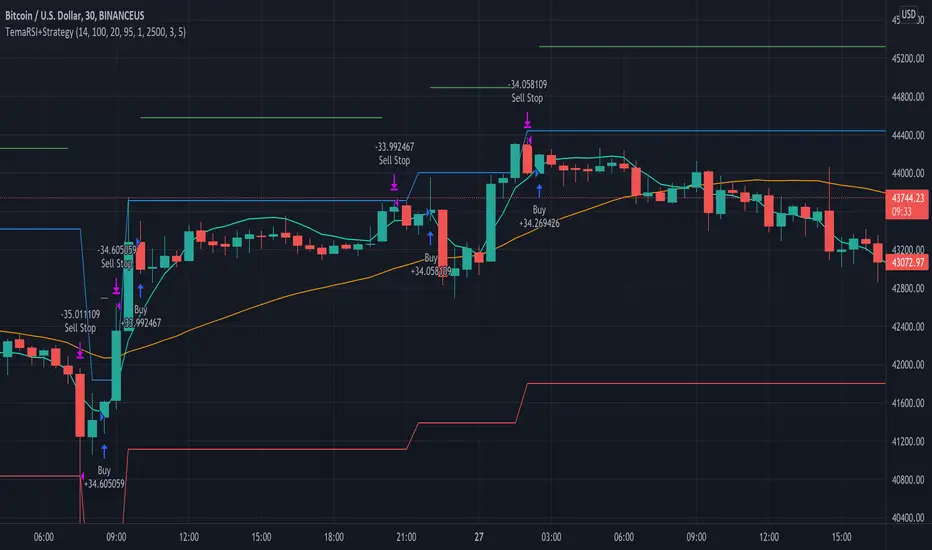
TemaRSI StrategyThis strategy uses a triple exponential moving average (Tema) and RSI to find buy points and uses stops, trailing stops and take profit to exit. Draft 1.
Take Profit On Trend (by BHD_Trade_Bot)The purpose of strategy is to detect long-term uptrend and short-term downtrend so that you can easy to take profit.
The strategy also using BHD unit to detect how big you win and lose, so that you can use this strategy for all coins without worry about it have different percentage of price change.
ENTRY
The buy order is placed on assets that have long-term uptrend and short-term downtrend:
- Long-term uptrend condition: ema200 is going up (rsi200 greater than 51)
- Short-term downtrend condition: 2 last candles are down price (use candlestick for less delay)
CLOSE
The sell order is placed when take profit or stop loss:
- Take profit: price increase 1 BHD unit
- Stop loss: price decrease 2 BHD units
The strategy use $15 and trading fee is 0.1% for each order. So that, in the real-life, if you are using trade bot, it will need $1500 for trading 100 coins at the same time.
Pro tip : The 1-hour time frame for altcoin/USDT has the best results on average.

RSI+CMO Hybrid StrategyThis strategy is based on the RSI+CMO Hybrid Index I created. I modified both the original RSI and CMO so that the RSI+CMO Index value ranges from -100 to +100 and defined as follows. When the RSI+CMO Hybrid Index values close above the Bull Level and below the Bear Level, the strategy will trigger long and short signals respectively. This newly defined hybrid RSI+CMO indicator showed better win rates and better profits than the original CMO strategy. The default setting for this strategy is optimized for an 8-hour candle. For candles at different times, try to find the optimal value yourself.
* I was going to open the script, but recently there was a case of stealing my script and publishing it without permission, so I decided not to disclose it.
▶ Modified RSI = Original RSI - 50
Therefore,
Original RSI (0 ~ 100) → Modified RSI (-50 ~ +50)
▶ Modified CMO = Original CMO * 0.5
Therefore,
Original CMO (-100 ~ +100) → Modified CMO (-50 ~ +50)
▶ RSI+CMO Hybrid Index = Modified RSI + Modified CMO
Therefore,
RSI+CMO Hybrid Index (-100 ~ +100)
________________________________________________________
이 전략은 기존의 RSI와 CMO 지표를 수정하여 새롭게 정의한 하이브리드 RSI+CMO 지표를 기반으로 만들어졌습니다. 지표 값의 범위가 -100에서 100의 범위를 가질 수 있도록 기존의 RSI와 CMO를 수정하여 만들었습니다. RSI+CMO Hybrid Index 값이 Bull Level 이상과 Bear Level 아래에서 봉마감을 하면 이 전략은 각각 롱과 숏 신호를 트리거합니다. 이렇게 새롭게 정의된 RSI+CMO 지표는 기존 CMO 전략 대비 승률과 수익이 더 우수합니다. 이 전략의 세팅 기본값은 8시간봉에 최적화 되어있습니다. 다른 시간대 봉에서는 최적값을 직접 찾아보십시오. 그리고 이전략은 RSI+CMO Hybrid Index와 함께 사용하면 Long과 Short 신호를 예측할 수 있어 편리합니다.
* 최근에 제 스크립트를 도용/표절하여 무단으로 퍼블리쉬한 사례가 발생하여 더 이상 스크립트는 공개하지 않기로 하였습니다.

PSAR + EMA/TEMA/RSI/OBVThe Parabolic Stop-and-Reservse (PSAR) is a trend indicator, intended to capture reversal signals and show entry and exit points. The PSAR is bullish when the PSAR is below the candle body (usually indicated by a dot) and bearish when the PSAR is above the candle body. The PSAR generally only moves in the direction of the trend, making it useful for markets with an upward or downward trend, as well as swing markets. It is weaker when the market it sideways, as it can be prone to frequent flips (bull-to-bear or vice versa) in markets where a predominant trend is not present.
In order to combat the tendency for rapid swings in the PSAR, it is commonly paired with a second indicator. Often, this is a moving average (MA) to confirm the PSAR signal. Here is a common example:
PSAR + 2 EMAs: A trade would consider entering long when the PSAR is bullish and the fast EMA is above the short EMA.
PSAR + 3 EMAs: As above, but the trader could also add a very long EMA (200, for example) and use that as an additional filter.
In addition to using EMA, other MAs can be used and may be more appropriate to certain instruments and timeframes. Using TEMA, for example, may result in less lag but introduce more noise. Likewise, the Ehler's MAMA is an option.
Some traders use other indicators as PSAR confirmation signals, such as the relative strength index (RSI) on on-balance volume (OBV). The strategy is similar:
bullish PSAR + RSI oversold = consider long entry
bullish PSAR + OBV oscillator > 0 = consider long entry
The strategy presented here is based on my PSAR + EMA + TEMA study. Any of the above strategies are supported by this script:
1. The PSAR is the primary signal.
2. Confirmation is provided by any of the following: EMA , TEMA , Ehler's MAMA , RSI , or OBV.
3. You may use a third EMA (set to 200 as the default) to filter entries -- if used, the strategy will only show signals if the price is above the third (additional) EMA .
For example, a normal long signal would be a bullish PSAR + fast EMA > slow EMA + price > ema 200.
In addition, you may use a SL, which is set to the PSAR dots shown. You may also limit the backtesting dates. (Please note in the chart above, I do not have a limit on the trading dates. I believe this exaggerates the success of the strategy, but the house rules demand I not limit the timeframe to show you a more accurate picture.)

3Commas DCA Bot Strategy v1.0Introduction
The strategy attempts to implement a majority all of the settings found on the 3Commas DCA Bot setting page that can be implemented within a TradingView indicator. Specifically, it will implement the "Open new trade ASAP" and "Trading View Custom Signal" deal start conditions. In this way, you can leverage the power of TradingView's backtester to model your settings and analysis past performance as well as leverage TradingView's alert notification subsystem to send Deal Start and Close signals to 3Commas using almost any of the thousands of scripts found in the Public Library (see "What does it do and how does it do it?" section below for more information on how to do this using the RSI indicator as an example).
How is it original and useful?
This strategy is unique in that it's the only one (as of the initial publications) that can handle 28 out of 32 bot settings (88% coverage) that are found on the 3Commas bot settings page. In addition, because it is a TradingView script, you will benefit from the following:
Model your bot's configuration using the backtester on any timeframe and evaluate its performance using the chart's history.
View a table of detailed statistics pertaining to deals started and completed, win/loss rates, daily P&L, true max drawdown, and detailed statistics on bars in deal along with safety orders filled.
View a table of "Used amount for each step" as presented in 3Commas as well.
Ability to link to almost any TradingView chart indicator that provides a single data point for buy/sell signals.
Make use of the 3Commas TA Start Conditions indicator to emulate the 3Commas built-in indicators for further performance evaluation with the backtester.
How does it compare to other scripts in the Public Library?
This strategy offers a very detailed, comprehensive settings and maybe the only one (as of the initial publication) that can handle 28 out of the 32 bot settings that are found on the 3Commas bot settings page (that can be handled within TradingView, because some cannot be modeled due to chart and language constraints). Specifically, the following 3Commas bot settings and inputs are addressed with asterisks denoting specific limitation due to TradingView's platform architecture and/or constraints:
Main settings
✅ Name
❌ Exchange* (Not handled since it is inherited from chart)
⚠ Bot type* (Only Single-pair because you simply apply the indicator to as many pairs you desire in separate charts to simulate a Multi-pair setting)
Pairs
❌ Pairs* (Not handled since it is inheriting the symbol from the chart)
Strategy
✅ Strategy
❌ Profit currency* (Not handled since there is no equivalence in TradingView)
✅ Base order size / unit
✅ Safety order size / unit
✅ Start order type
Deal start condition
⚠ TradingView* (You can modify the "Technical Rating" indicator by TradingView to output a signal yourself like @TheTradingParrot has done in the TV signal for DCA backtest script)
⚠ QFL* (See Quickfingers Luc's Base Breaking Strategy v2.5 - 3Commas Edition for an alternative)
❌ Manually/API* (Not handled since there is no equivalence in TradingView)
✅ Trading View custom signal
✅ Open new trade asap
Take profit
✅ Take profit (%)
✅ Take profit type
✅ Trailing
⚠ Trailing deviation* (modified to handle TradingView's broker emulator properly)
Stop loss
✅ Stop Loss (%)
✅ Stop Loss action
⚠ Stop Loss timeout* (modified to use "bars" as the unit of measure)
Safety orders
✅ Max safety trades count (a total of 100 safety orders are supported!)
⚠ Max active safety trades count* (Not handled since there is no equivalence in TradingView)
✅ Price deviation to open safety orders (% from initial order)
✅ Safety order volume scale
✅ Safety order step scale
Advanced settings
✅ Don't start deal(s) if the daily volume is less than
✅ Minimum price to open deal
✅ Maximum price to open deal
⚠ Deal start delay (QFL and standard TV signals only)* (modified to use "bars" as the unit of measure)
✅ Cooldown between deals
✅ Open deals & stop
Close deal after timeout
⚠ The time after which, deal will be closed automatically* (modified to use "bars" as the unit of measure)
In addition to the above inputs, the script will also support the same output data points that are found on the bot settings page, which are:
Assistant
✅ Balance
✅ Max amount for bot usage (Based on current rate)
✅ Max safety order price deviation
✅ % of available balance to be used by the bot
Table (Used amount for each step)
✅ Order No.
✅ Deviation %
✅ Order Size (Base currency)
✅ Order Volume (Quote currency)
✅ Price
✅ Average price
✅ Required price
✅ Required change
✅ Total Size (Base currency)
✅ Total Volume (Quote currency)
What does it do and how does it do it?
When applied to the chart for the first time, the default settings will work to execute the "Open new trade asap" deal start condition using a take profit of 4%, a base order size of 1.335% of equity (initial capital + net profit), a safety order size of 2.003% of equity (initial capital + net profit), a safety order volume scale of 1.5, a safety order step scale of 1.21, and a max safety trades count of 8. With these settings, as you scroll through the chart's history you should see price action crossing the DCA layers (denoted with blue triangles), and a green take-profit price line will render (with green triangle denoting the crossings). Lastly, in the upper-right corner of the chart the table of DCA statistics will render showing you all the gathered data that took place since the chart's starting history until the current time.
Using the "TV Custom Signal" section will allow you to "link" other chart indicators to supply "Start" and "Close" signals for the script. For example, here's how you can use the standard RSI indicator to generate an entry signal:
1) Add the stock RSI indicator and configure it to your desire.
2) Select the "RSI" indicator in the "Chart/Indicator Data Point" input.
3) Select "Chart/Indicator Data Point" in the "Start Deal When" input.
4) Select "Less Than" in the "Is" input.
5) Select "Custom Value(s)" in the "The Value Of" input.
6) Enter "25" in the "Custom Value 1 (Single or Lower Bound)" input.
7) Select "Trading View Custom Signal" in the "Open new trade" input (in the DEAL START CONDITION section).
8) Lastly, check the checkbox with a horizontal straight line above the "Start Deal When" input.
This means that the indicator will start a deal when the "RSI indicator" is "Less Than" the value of "25".
Strategy Results
The default settings are designed to ensure that the indicator will render chart elements when first loaded as well as to allow the backtester to gather order executions and display performance summary. The chart above is is using $10,000 initial capital, a commission rate of 0.1% for both entries and exits, and a 1 tick slippage setting. It is also using 3.22581% of the equity for the Base Order Size, 6.45161% of equity for the first Safety Order Size. The Maximum Safety Trade Count is 4 with a Safety Order Volume Scale of 2, a Safety Order Step Scale of 1.53, Price Deviation To Option Safety Orders at 5.3, and a take profit of 4.5% with Trailing turned on at a deviation of 1.5%. All other settings are defaults.
It is recommended that the indicator be "tuned" for your specific market in order to best implement the strategy and obtain better desirable results. You do so by using the backtester and statistics table and observe the output values and learn how the indicator is performing in the chart history. Using this information, you can adjust the settings accordingly until you find the settings acceptable to your trading goals and risk tolerance.
Always keep in mind that past performance may not be indicative of future results. Settings that seem favorable for one market may be found to be disastrous in another. Therefore, do take the time needed to understand how the settings will behave with the given chart symbol.
Enjoy! 😊👍
How to obtain access to the script?
You have two choices:
Use the "Website" link below to obtain access to this indicator, or
Send us a private message (PM) in TradingView itself.

Go_up vwap-rsiIt is the popular RSI indicator with VWAP as a source instead of close.
VWAP (Volume Weighted Average Price) is one of the derived moving average indicators that takes volumes into account in price averaging. VWAP stands for Volume Weighted Average Price.
//LOGIC ENTRY:
Length RSI+VWAP
Oversold - bottom line RSI-VWAP
//EXIT SETTING:
Take profit and stop loss when a certain percentage is reached
//Settings next entry and grid:
Allow signal lower than,% - the next entry into a trade from logic occurs only when a decrease by a certain percentage
Allow grid,% - when the price drops by the percentage specified in the settings, the entry will take place, but only on the next bar.
//DATA RANGE:
-Testing results for any period of time
//PS:
For this strategy, we use pyramiding, we adjust the number of inputs in the "properties" section, by default left 20.
Look at the results in the past and adjust the settings for your capabilities and pitfalls. The default costs 25 entries for $ 400
Change the settings - find better results. share in the comments

[TVExtBot]Heikinashi Upswing Strategy(30m&1h&2h)The Heikin-Ashi Upswing Strategy is a trend-following strategy suitable for short-term trading that utilizes Heikin-Ashi to follow an upward trend and realizes profits only in a rising market.
하이킨아시 업스윙 전략은 하이킨아시를 활용하여 상승하는 추세를 따라가며 상승장에서만 수익을 실현하는 단기매매에 적합한 추세추종 전략입니다.
* Buy Signal
The close price of the Heikin-Ashi candle was higher than the open price, and a golden cross occurred in the short-term EMA.
하이킨아시 캔들의 종가가 시가보다 크고 단기 EMA에 골든클로스가 발생.
* Sell Signal
The open price of the Heikin-Ashi candle is higher than the close price, the short-term EMA is dead cross, and overbought occurs.
하이킨아시 캔들의 시가가 종가보다 크고 단기 EMA가 데드클로스이고 과매수가 발생.
※Long만 사용가능한 전략입니다.(This is a strategy that only Long can use.)
Default Options(기본설정)
Short-Term Volatility (단기변동성) : 96 (※1)
Long-Term Volatility (장기변동성) : 97 (※1)
Take Profit (%) (익절) : 15%
Trailing Stop(%) (트레일링 스탑) : 10%
(※1) The lower the value, the more aggressive the buy.(값이 낮을수록 매수가 공격적입니다.)

Hophop Reversion Strategy
█ OVERVIEW
Mean reversion is a financial term assuming that an asset's price will tend to converge to the average price over time.
Due to the trending nature of the crypto markets, mean reversion on a high timeframe could be pretty dangerous. When it comes to running mean reversion strategy on low timeframe, commission and slippage may cost more than strategy gains.
In this strategy, I tried to achieve being conservative in the trending market while avoiding trades if necessary and trading high probability reversion opportunities .
█ CONCEPTS
Strategy is build based on the combination of the momentum and the historical / implied volatility; when the price exceeds the potential volatility range, the strategy places the orders, and the target point is the mean of the expected range high and range low.
The range low and high lines displayed on the chart shows where to short or long, to make sure that the orders are limit orders; orders are placed 0.5% above/below the ranges!
Key information about the strategy
• All the orders are limit entry
• 0.02% commission is included in the backtest
• 30 ticks set for Verify Price Limit for Orders
• 30 ticks set for Slippage
• Initial version does not include the money management and hard stops hence you need to be extra cautious in trending markets
• Restricted to be used for BTC and ETH for 15 min timeframe
█ Ozet
Ortalamaya dönme, bir varlığın fiyatının zaman içinde ortalama fiyata yakınsama eğiliminde olacağını varsayan bir finansal terimdir.
Kripto piyasalarının trend egilimli doğası nedeniyle, yüksek zaman diliminde ortalamaya dönüş oldukça tehlikeli olabilir.
Ortalama geri dönüş stratejisini düşük zaman diliminde calistirmak söz konusu olduğunda, komisyon ve kayma, strateji kazanımlarından daha pahalıya mal olabilir.
Bu stratejide, gerektiğinde alım satımlardan kaçınırken ve yüksek olasılıklı ortalamaya dönüş fırsatlarını degerlendiren, trend olan piyasada ise isleme girerken temkinli olmasi uzerine calistim
█ Aciklama
Strateji, momentum ve tarihsel / zımni oynaklığın birleşimine dayalı olarak inşa edilmistir; fiyat potansiyel oynaklık aralığını aştığında, strateji emirleri verir ve hedef nokta, beklenen yüksek aralığın ve düşük aralığın ortalamasıdır.
Grafikte görüntülenen aralık alt ve üst satırları,
Stratejiye ait onemli bilgiler/b]
• Tüm emirler limit emirdir girişlidir
• Backtest performansinda %0.02 komisyon dahildir
• Limit Emir fiyat dogrulamasi icin 30 tick bekleme kullanilmistir
• Slippage için 30 tick bekleme kullanilmistir
• İlk sürüm para yönetimini ve stoploss içermez, bu nedenle trend olan piyasalarda ekstra dikkatli olmanız gerekir.
• 15 dakikalık zaman dilimi ile BTC ve ETH için kullanımla sınırlıdır
Emirlerin limit emir olduğundan emin olmak için nerede short veya long isleme girilecegini gosteren cizgilerin %0.5 üstünde/altında verilir!

Combo Backtest 123 Reversal & T3 Averages This is combo strategies for get a cumulative signal.
First strategy
This System was created from the Book "How I Tripled My Money In The
Futures Market" by Ulf Jensen, Page 183. This is reverse type of strategies.
The strategy buys at market, if close price is higher than the previous close
during 2 days and the meaning of 9-days Stochastic Slow Oscillator is lower than 50.
The strategy sells at market, if close price is lower than the previous close price
during 2 days and the meaning of 9-days Stochastic Fast Oscillator is higher than 50.
Second strategy
This indicator plots the moving average described in the January, 1998 issue
of S&C, p.57, "Smoothing Techniques for More Accurate Signals", by Tim Tillson.
This indicator plots T3 moving average presented in Figure 4 in the article.
T3 indicator is a moving average which is calculated according to formula:
T3(n) = GD(GD(GD(n))),
where GD - generalized DEMA (Double EMA) and calculating according to this:
GD(n,v) = EMA(n) * (1+v)-EMA(EMA(n)) * v,
where "v" is volume factor, which determines how hot the moving average’s response
to linear trends will be. The author advises to use v=0.7.
When v = 0, GD = EMA, and when v = 1, GD = DEMA. In between, GD is a less aggressive
version of DEMA. By using a value for v less than1, trader cure the multiple DEMA
overshoot problem but at the cost of accepting some additional phase delay.
In filter theory terminology, T3 is a six-pole nonlinear Kalman filter. Kalman
filters are ones that use the error — in this case, (time series - EMA(n)) —
to correct themselves. In the realm of technical analysis, these are called adaptive
moving averages; they track the time series more aggres-sively when it is making large
moves. Tim Tillson is a software project manager at Hewlett-Packard, with degrees in
mathematics and computer science. He has privately traded options and equities for 15 years.
WARNING:
- For purpose educate only
- This script to change bars colors.
EMR Strategy [H1 Backtesting]EMR Strategy base on EMA, MACD and RSI to supply signal on time frame H1.
Details of Rule as below:
===
1.EMA
+ Time frame: H1
+ Periods: 25, 100 (~ EMA 25 H4), 600 (~ EMA 25 D1)
===
2.MACD
+ Time frame: H1
+ Periods: 12,26,9
===
3.RSI
+ Time frame: H1
+ Periods: 14
===
4.Trading Rule
4.1.Long Position
+ MACD>0 and RSI>50 and close price moving above EMA 25
+ Close price crossed EMA 100 or crossed EMA 600 at the first time
4.2.Short Position
+ MACD<0 and RSI<50 and close price moving below EMA 25
+ Close price crossed EMA 100 or crossed EMA 600 at the first time
===
5.Money Management
+ This strategy concentrate into winrate.
+ So use trailing stop to protect your profits.
+ And use stoploss to avoid big loss on trades.
