Backtest Signal To Noise This source code is subject to the terms of the Mozilla Public License 2.0 at mozilla.org
© HPotter 05/01/2021
The signal-to-noise (S/N) ratio.
And Simple Moving Average.
Thank you for idea BlockchainYahoo
WARNING:
- For purpose educate only
- This script to change bars colors.
Oscillators
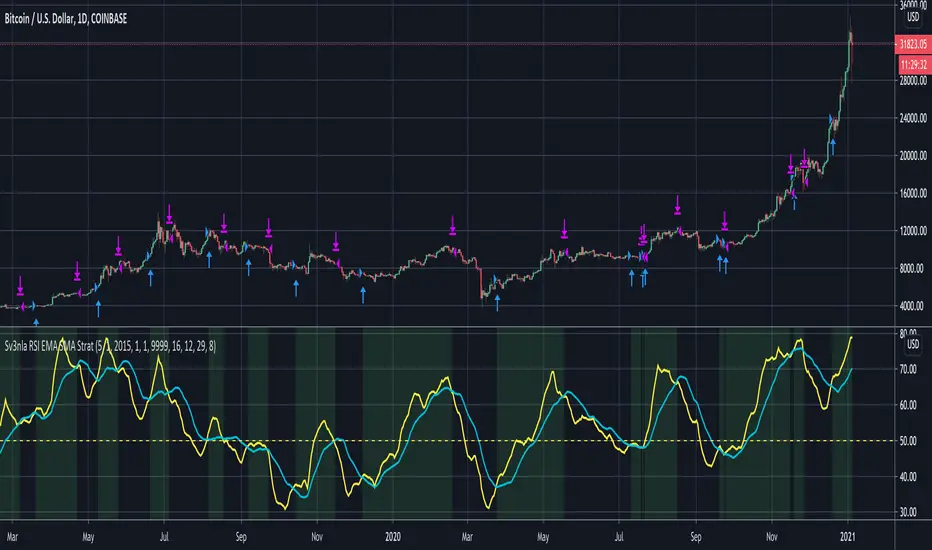
RSI EMA SMA StratThis script looks at the RSI EMA and RSI SMA crossovers when above a certain price EMA
It was mainly written for swingtrading and only for long positions on a daily timeframe for BTC and ETH. They idea is to have a script that indicates when to convert your BTC /ETC to a stable coin and when to buy in again.
You could try to use it for other positions (short, long, etc..) and other coins but I didn't test these.
When the RSI EMA & SMA hover around 50 for a few days in flat lines and you get a buy signal it may be best to wait a few days longer to see what direction they take.
The default values for RSI EMA , RSI SMA and price EMA gave the best return (start out with an amount of x coins in 2015 and end up with the biggest possible amount of coins today). Again, this was only tested on daily. Feel free to tweak these when using other timeframes or other coins
CHOP Zone Entry Strategy + DMI/PSAR ExitThis is a Strategy with associated visual indicators and Long/Short and Reverse/Close Position Alerts for the Choppiness Index (CHOP) . It is used to determine if the market is choppy (trading sideways) or not choppy (trading within a trend in either direction). CHOP is not directional, so a DMI script was ported into this strategy to allow for trend confirmation and direction determination; it consists of an Average Directional Index (ADX) , Plus Directional Indicator (+DI) and Minus Directional Indicator (-DI) . In addition, a Parabolic SAR is also included to act as a trailing stop during any strong trends.
Development Notes
---------------------------
This indicator, and most of the descriptions below, were derived largely from the TradingView reference manual. Feedback and suggestions for improvement are more than welcome, as well are recommended Input settings and best practices for use.
www.tradingview.com
www.tradingview.com
www.tradingview.com
Recommend using the below DMI and PSAR indicators in conjunction with this script to fully visualize and understand how entry and exit conditions are chosen. Variable inputs should correlate between the scripts for uniformity and visual compatibility.
THANKS to LazyBear and his Momentum Squeeze script for helping me quickly develop a momentum state model for coloring the Chop line by trend.
Strategy Description
---------------------------
CHOP produces values that determine whether the market is choppy or trending . The closer the value is to 100 , the higher the choppiness levels , while the closer it is to 0 , the stronger the market is trending . Territories for both levels, and their associated upper and lower thresholds, are popularly defined using the Fibonacci Retracements, 61.8 and 38.2.
Basic Use
---------------------------
CHOP is often used to confirm the market condition to help you stay out of sideways markets and only enter when there is movement or imminent explosions. When readings are above the upper threshold, continued sideways movement may be expected, while readings below the lower threshold are typically indicative of a continuing trend. It is also used to anticipate upcoming trendiness changes, with the general belief that extended periods of consolidation (sideways movement) are followed by extended periods of strong, trending, directional movement, and vice versa.
One limitation in this index is that you must be cautious in deciding whether the range or trend will likely continue, or if it will reverse.
Confidence in price action and trend is higher when two or more indicators are in agreement -- while this strategy combines CHOP with both DMI and PSAR, we would still recommend pairing with other indicators to determine entry or exit trade opportunities.
Recommend also choosing 'Once Per Bar Close' when creating alerts.
Inputs
---------------------------
Strategy Direction - an option to only trade Short, Long, Both, or only in the direction of the Trend (Follow Trend is the Default).
Sensitivity - an incremental variable to test whether the past n candles are in the same trend state before triggering a delayed long or short alert (1 is the Default). Can help filter out noise and reduces active alerts.
Show Chop Index - two visual styles are provided for user preference, a visible Chop line with a background overlay, or a compact column and label only view.
Chop Lookback Period - the time period to be used in calculating CHOP (14 is the Default).
Chop Offset - changing this number will move the CHOP either forwards or backwards relative to the current market (0 is the Default).
Smooth Chop Line and Length - if enabled, the entered time period will be used in calculating a smooth average of the index (Enabled and 4 are the Defaults).
Color Line to Trend Direction - toggles whether the index line is colored to visually depict the current trend direction (Enabled is the Default).
Color Background - toggles the visibility of a background color based on the index state (Enabled is the Default).
Enable DMI Option - if enabled, then entry will be confirmed by and dependent on the ADX Key Level, with any close or reversal confirmed by both ADX and +/-DI to determine whether there is a strong trend present or not (Enabled is the Default).
ADX Smoothing - the time period to be used in calculating the ADX which has a smoothing component (14 is the Default).
DI Length - the time period to be used in calculating the DI (14 is the Default).
ADX Key Level - any trade with the ADX above the key level is a strong indicator that it is trending (23 to 25 is the suggested setting).
Enable PSAR Option - enables trailing stop loss orders (Enabled is the Default).
PSAR Start - the starting value for the Acceleration Force (0.015 is our chosen Default, 0.02 is more common).
PSAR Increment - the increment in which the Acceleration Force will move (0.001 is our chosen Default, 0.02 is more common).
PSAR Max Value - the maximum value of the Acceleration Factor (0.2 is the Default).
Color Candles Option - an option to transpose the CHOP condition levels to the main candle bars. Note that the outer red and green border will still be distinguished by whether each individual candle is bearish or bullish during the specified timeframe.
Note too that if both DMI and PSAR are deselected, then close determinations will default to a CHOP reversal strategy (e.g., close long when below 38.2 and close short when above 61.8). Though if either DMI or PSAR are enabled, then the CHOP reversal for close determination will automatically be disabled.
Indicator Visuals
---------------------------
For the candle colors, black indicates tight chop (45 to 55), yellow is loose chop (38.2 to 45 and 55 to 61.8), dark purple is trending down (< 38.2), and dark blue is trending up (> 61.8).
The background color has additional shades to differentiate a wider range of more levels…
• < 30 is dark purple
• 30 to 38.2 is purple
• 38.2 to 45 is light purple
• 45 to 55 is black
• 55 to 61.8 is light blue
• 61.8 to 70 is blue
• > 70 is dark blue
Long, Short, Close, and Reverse labels are plotted on the Chop line, which itself can be colored based on the trend. The chop line can also be hidden for a clean and compact, columnar view, which is my preferred option (see example image below).
Visual cues are intended to improve analysis and decrease interpretation time during trading, as well as to aid in understanding the purpose of this strategy and how its inclusion can benefit a comprehensive trading plan.
DMI and Trend Strength
---------------------------
To analyze trend strength, the focus should be on the ADX line and not the +DI or -DI lines. An ADX reading above 25 indicates a strong trend , while a reading below 20 indicates a weak or non-existent trend . A reading between those two values would be considered indeterminable. Though what is truly a strong trend or a weak trend depends on the financial instrument being examined; historical analysis can assist in determining appropriate values.
DMI exits trade when ADX is below the user selected key level (e.g., default is 25) and when the +/- DI lines cross (e.g., -DI > +DI exits long position and +DI > -DI exits short position).
PSAR and Trailing Stop
---------------------------
PSAR is a time and price based indicator that excels at measuring direction and duration, though not the actual strength of a trend, which is why we use this in conjunction with DMI. It is also included in this script as a trailing stop option to maximize gains during strong trends and to mitigate any false ADX strengthening signals.
This creates a parabola that is located below the candle during a Bullish trend and above during a Bearish trend. A buy or reversal is signaled when the price crosses above or below the Parabolic SAR.
Long/Short Entry
---------------------------
1. CHOP must be over 61.8 (long) or under 38.2 (short).
2. If DMI is enabled, then the ADX signal line must be above the user selected Key Level (default is 25).
3. If Sensitivity is selected, then that past candle must meet the criteria in step 1, as well as all the intermediate candles in between.
4. If "Follow Trend" is selected and PSAR is enabled, then a long position can only open when the momentum and PSAR are in an uptrend, or short when both are in a downtrend, to include all intermediate candles if the Sensitivity option is set on a past candle.
Close/Reverse
---------------------------
1. If DMI is enabled, then a close flag will be raised when the ADX signal drops below the Key Level (of 25), and -DI crosses over +DI (if long), or +DI crosses over -DI (if short).
2. If PSAR is enabled, then a close flag will be raised when the current trend state is opposite the last state.
3. If both DMI and PSAR are disabled, then a close flag will be raised if the Chop line drops under 38.2 (if long) or goes over 61.8 (if short).
4. If a Long or Short Entry is triggered on the same candle as any of the above close flags, then the position will be reversed, else the position will be closed.
Strategy Alerts
---------------------------
1. Long Entry
2. Short Entry
3. Reverse
4. Close
The provided backtest result is based on a position sizing of 10% equity with 100k initial capital. When testing SPX, disabling the DMI performed the best, but EURUSD performed poorly without it enabled, and TSLA had a small reduction in net profit. Timeframe likewise differed between commodities with TSLA performing best at 30M, SPX at 15M, and EURUSD at 4H. I do not plan on using this as a standalone strategy, but I also was expecting better results with the inclusion of EMI and PSAR to compliment the CHOP. Key elements of this script will likely be included in future, more holistic strategies.
Disclaimer
---------------------------
Past performance may not be indicative of future results. Due to various factors, including changing market conditions, the strategy may no longer perform as well as in historical backtesting. This post and the script are not intended to provide any financial advice. Trade at your own risk.
No known repainting, though there may be if an offset is introduced in the Inputs. I did my best not to code any other variables that repaint, but cannot fully attest to this fact.

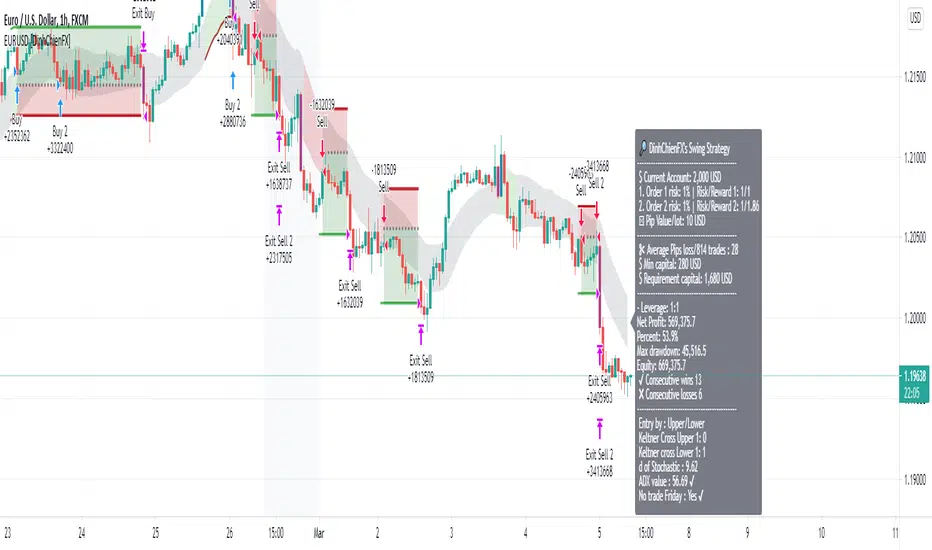
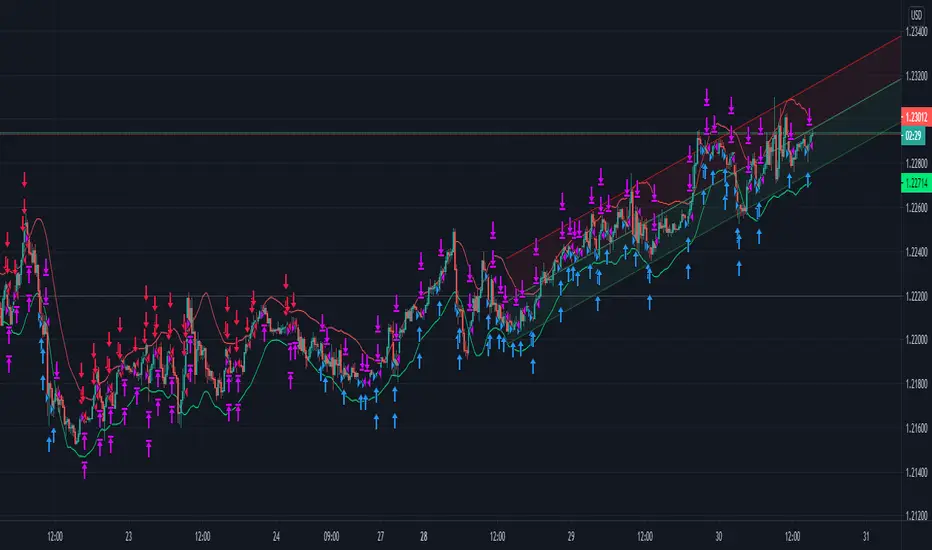
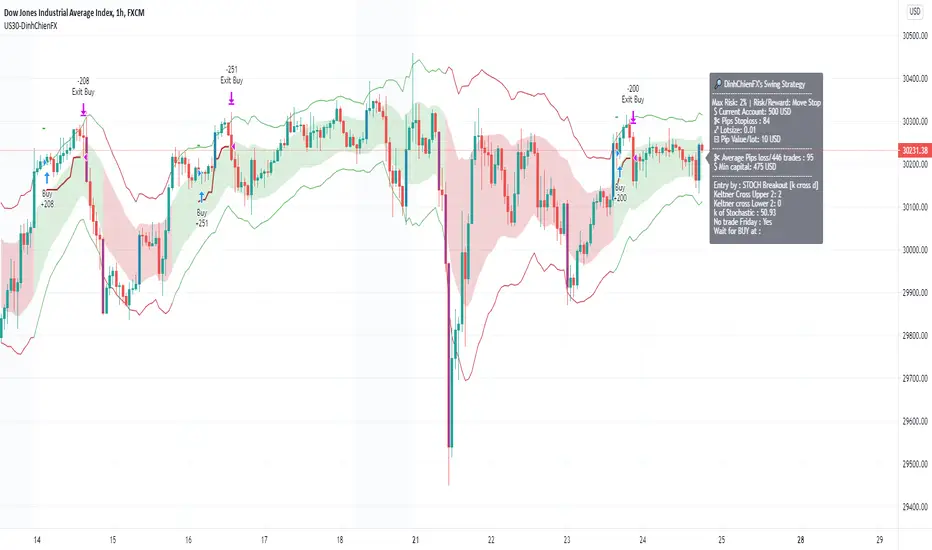
EURUSD DinhChienFX's signal V4.0Risk/reward: 1/1.3 | Entry by: Upper/Lower | Keltner crossing: 2 | Candle not entry: 80% | Stochastic: 70/15 | Adx: 31/9/9 | Notrade friday
Max risk: 3% - Risk / reward: 1 / 1.3.
1. Trend identification:
... Keltner: Price Through Upper / Lower 1 gives 1 point. 2 points are eligible for entry.
... Stochastic:
...... k> 70: Uptrend. k <15: Down trend.
... ADX: 31 provides strong trend following signal.
2. Entry point:
... Price corrects to Upper / Lower when 3 conditions Keltner , Stochastic & ADX indicator meet.
3. Not trade friday.
-------------
"Use the link below to obtain access to this indicator" or "PM us to obtain access"
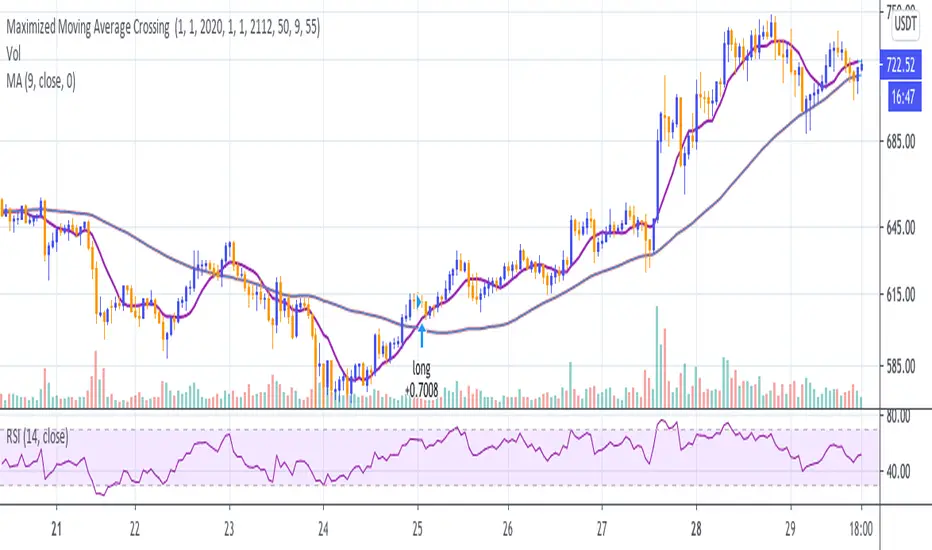
Maximized Moving Average Crossing (by Coinrule)Using the crossings of two Moving Averages to trade in a trading strategy is a Trend-Following approach. As the name would suggest, to be successful, it requires the asset to be on-trend.
The general limit of a common strategy based on Moving Averages is that they underperform when the market is less volatile or trading sideways. When volatility compresses, the indicators get very close one to another, crossing each other very often. That's exactly the condition when trend-following strategies underperform.
To improve this strategy, it's useful to filter the buy signal using the RSI. When the RSI is close to overbought conditions, that means that the coin is likely trading in an uptrend. Strong uptrends usually come with RSI values that stay overbought for long periods, creating interesting opportunities.
Setup
Buy condition: the MA9 crosses above the MA50, and at the same time, the RSI has a value greater than 55.
Sell condition: the MA9 crosses below the MA50.
The strategy is optimized to provide better results on the 1-hr time frame, but it could work well also on higher time frames, such as the 4-hrs.
The strategy assumes each order to trade 30% of the available capital and opens a trade at a time. A trading fee of 0.1% is taken into account.
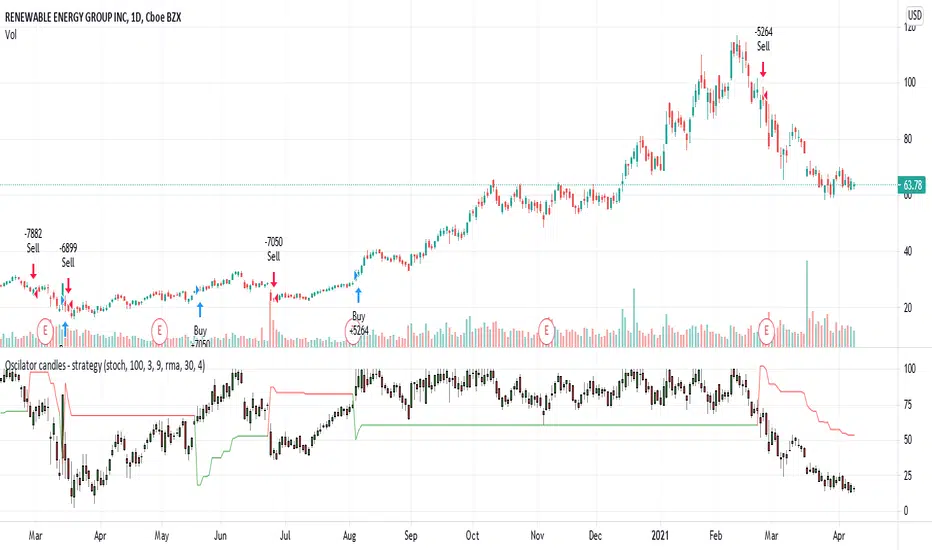
Oscilator candles - momentum strategyThis is momentum based strategy based on indicators published earlier:
Also trying to use delayed supertrend based on steps as mentioned in the published indicator:
Added option to filter trade entries based on higher timeframe pivots. But, it is not so effective and may need further optimization.
MrBS:Directional Movement Index [Trend Friend Strategy]This goes with my MrBS:DMI+ indicator. I originally combined them into one, but then you cannot set alerts based on what the ADX and DMI is doing, only strategy alerts, so separate ones have more flexibility and uses.
Indicator Version is found under "MrBS:Directional Movement Index " ()
//// THE IDEA
The majority of profits made in the market come from trending markets. Of course there are strategies that would say otherwise but for the majority of people, THE TREND IS YOUR FRIEND (until the end). The idea is to follow the trend, entering once it has established its self and exiting positions when the trend weakens. This strategy gives a rough idea of the returns produced from following purely the ADX signals. At first Heikin Ashi values were used for the calculation but the results show it's not that effective. The functionality to switch between calculation types has been left in, so we can uses HA candle data to generate signals from while looking at an OHLC chart, if we want to experiment. Due to the way strategies work, we are unable to get reliable results when running the strategy on the HA chart even if we are calculating the signals from the real OHLC values. It is best to always run strategies on standard charts.
When using this strategy, I look for confirmation of the signal based on stochastic (14:3:6) direction, reversal level of stochastic, and divergance, to add confidence and adjust position size accordingly. I am going to try and code some version of that in future updates, if anyone can help or has suggestions please drop me a message.
//// INDICATOR DETAILS
- The default settings are for optimized Daily charts, for 4 hour I would suggest a smoothing of 2.
- The default values used for calculation are the Real OHLC, we can change this to Heikin Ashi in the menu.
- The strategy enters a position when ADX crosses the threshold level, and closes the position when ADX starts to fall.
- There is a signal filter in the form of a 377 period Hull Moving Average, which the price must be above or bellow for long and short positions respectively.
- The strategy closes the position when a cross-under of the ADX and its 4 period EMA. This is an attempt to stay into positions longer as sometimes the ADX will fall for 1 bar and then keep rising, while the overall trend is strong. The downside to this is that we exit trades later and this affects our max drawdown.

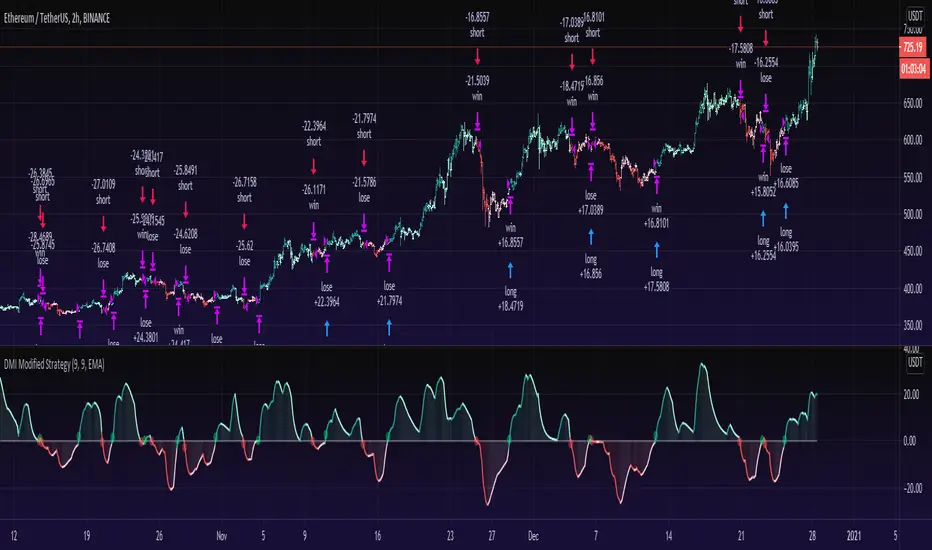
DMI Modified StrategyAs promised a strategy of my DMI Modified indicator! (See link below for indicator).
=== How does it work? ===
Instead of plotting the positive direction of +DI and negative direction for -DI, we subtract the +DI with the -DI on scales of 100 to -100.
The result is plotted with a oscillator to identify the current trend.
DMI Modified supports multiple moving averages (default is EMA with length of 9). You can disable moving averages smoothing in settings.
//== About the Strategy ==
Buys when the line crosses over the Zero line.
Sells when the line crosses under the Zero line.
The DMI modified strategy is pretty much clean, without any filtering besides the DMI Modified and a moving average to smooth it.
Works best to catch a trend and more suitable for 1 hour and above time frame. Stay tuned for updates.
On sideways you will get more false signals. as i said , it's a clean version without much bells and whistles for you to experiment.
== Oscillator Colors ==
GREEN : Strong Up Trend as DMI Modified is above zero line and DMI modified is ascending.
LIGHT GREEN: Still up trend but weakening as DMI modified is above zero but descending.
RED: Strong Downtrend as DMI Modified is below zero line and DMI modified is descending.
LIGHT RED: Still down trending but weakening as DMI modified is below zero but ascending.
== Notes ==
Short is enabled by default.
Bar coloring is disabled by default.
== Links ==
DMI modified indicator:
Like if you like and Enjoy! Follow for more upcoming indicators/strategies: www.tradingview.com
Linear Regression - Reverse Up/Down StrategyFor my first foray into pine script I took the code from the generic "Consecutive up/down" and flipped the logic. I added a linear regression filter to try and stay with the overall trend. ATR added for visual, I eventually want to use it as part of the money management.
Rules to open trade or close the opposite:
IF the linear regression slope is >=0 AND the last candle closes lower, BUY
IF the linear regression slope is <=0 AND the last candle closes higher SELL
Rules to close the opposite:
IF the linear regression slope is >=0 AND the last candle closes higher, close any open SELL
IF the linear regression slope is <=0 AND the last candle closes lower, close any open BUY
US30-DinhChienFX's Followtrend V2.0+ A Long trend is when the price close & crossover the Keltner Upper 2 + k value of Stochastic indicator crossover 80.
+ A Short trend is when the price close & crossunder the Keltner Lower 2 + k value of Stochastic indicator crossunder 20.
+ to Entry when k value (Stoch indicator) make correction and cross the d value (Stoch indicator)
- Buy: k & d > 79
- Sell: k & d < 17
+ No trade Friday.
*** Use the link below to obtain access to this indicator
Momentum Strategy for cryptos (V7.B.4)Here's a strategy for low time frames (30min suggested) for BTC, based on momentum Analysis using Stochastic RSI
By default the strategy will use the 50% of the specified capital for each trade; if "Gamble Sizing" is enabled, it will add the specified amount of capital (25% by default, until reaching the 100% limit or lower) for the next trade after having detected a loss in the previous trade; if the next trade is successful, the size for the next trade comes back to 50%
• Trend Filter LONG: If the fast exponential moving average is UNDER the slow exponential moving average, it won't open LONG positions
• Trend Filter SHORT: If the fast exponential moving average is ABOVE the slow exponential moving average, it won't open SHORT positions
• Bars delay: the strategy will wait the specified amount of bars before closing the current position; the counter is triggered as soon as the closing trade condition is verified
BY MAKING USE OF THIS STRATEGY, YOU ACKNOWLEDGE AND AGREE THAT: (1) YOU ARE AWARE OF THE RISKS ASSOCIATED WITH TRANSACTIONS OF DIGITAL CURRENCIES AND THEIR DERIVATIVES; (2) YOU SHALL ASSUME ALL RISKS RELATED TO THE USE OF THIS STRATEGY AND TRANSACTIONS OF DIGITAL CURRENCIES AND THEIR DERIVATIVES; AND (3) I SHALL NOT BE LIABLE FOR ANY SUCH RISKS OR ADVERSE OUTCOMES.

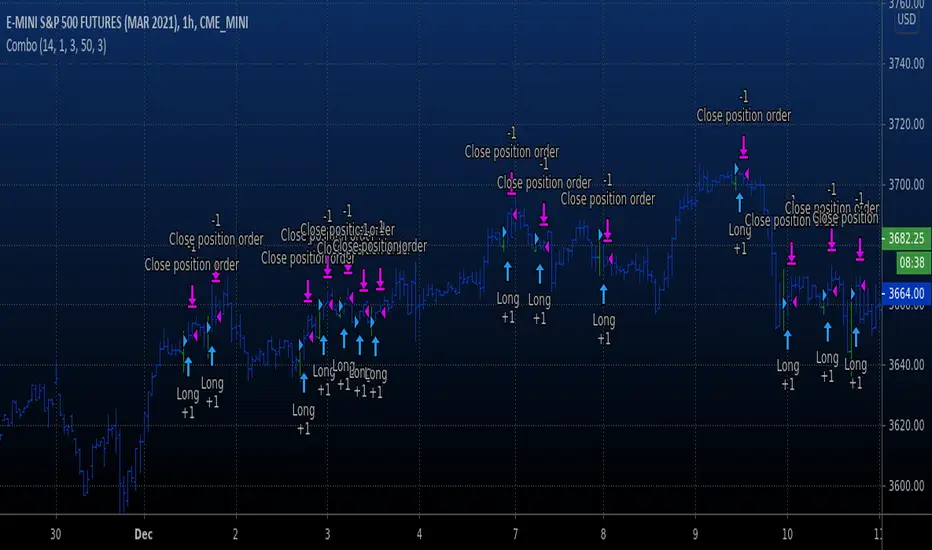
Combo Backtest 123 Reversal & Klinger Volume Oscillator This is combo strategies for get a cumulative signal.
First strategy
This System was created from the Book "How I Tripled My Money In The
Futures Market" by Ulf Jensen, Page 183. This is reverse type of strategies.
The strategy buys at market, if close price is higher than the previous close
during 2 days and the meaning of 9-days Stochastic Slow Oscillator is lower than 50.
The strategy sells at market, if close price is lower than the previous close price
during 2 days and the meaning of 9-days Stochastic Fast Oscillator is higher than 50.
Second strategy
The Klinger Oscillator (KO) was developed by Stephen J. Klinger. Learning
from prior research on volume by such well-known technicians as Joseph Granville,
Larry Williams, and Marc Chaikin, Mr. Klinger set out to develop a volume-based
indicator to help in both short- and long-term analysis.
The KO was developed with two seemingly opposite goals in mind: to be sensitive
enough to signal short-term tops and bottoms, yet accurate enough to reflect the
long-term flow of money into and out of a security.
The KO is based on the following tenets:
Price range (i.e. High - Low) is a measure of movement and volume is the force behind
the movement. The sum of High + Low + Close defines a trend. Accumulation occurs when
today's sum is greater than the previous day's. Conversely, distribution occurs when
today's sum is less than the previous day's. When the sums are equal, the existing trend
is maintained.
Volume produces continuous intra-day changes in price reflecting buying and selling pressure.
The KO quantifies the difference between the number of shares being accumulated and distributed
each day as "volume force". A strong, rising volume force should accompany an uptrend and then
gradually contract over time during the latter stages of the uptrend and the early stages of
the following downtrend. This should be followed by a rising volume force reflecting some
accumulation before a bottom develops.
WARNING:
- For purpose educate only
- This script to change bars colors.

Combo Backtest 123 Reversal & Key Reversal Up This is combo strategies for get a cumulative signal.
First strategy
This System was created from the Book "How I Tripled My Money In The
Futures Market" by Ulf Jensen, Page 183. This is reverse type of strategies.
The strategy buys at market, if close price is higher than the previous close
during 2 days and the meaning of 9-days Stochastic Slow Oscillator is lower than 50.
The strategy sells at market, if close price is lower than the previous close price
during 2 days and the meaning of 9-days Stochastic Fast Oscillator is higher than 50.
Second strategy
A key reversal is a one-day trading pattern that may signal the reversal of a trend.
Other frequently-used names for key reversal include "one-day reversal" and "reversal day."
How Does a Key Reversal Work?
Depending on which way the stock is trending, a key reversal day occurs when:
In an uptrend -- prices hit a new high and then close near the previous day's lows.
In a downtrend -- prices hit a new low, but close near the previous day's highs
WARNING:
- For purpose educate only
- This script to change bars colors.
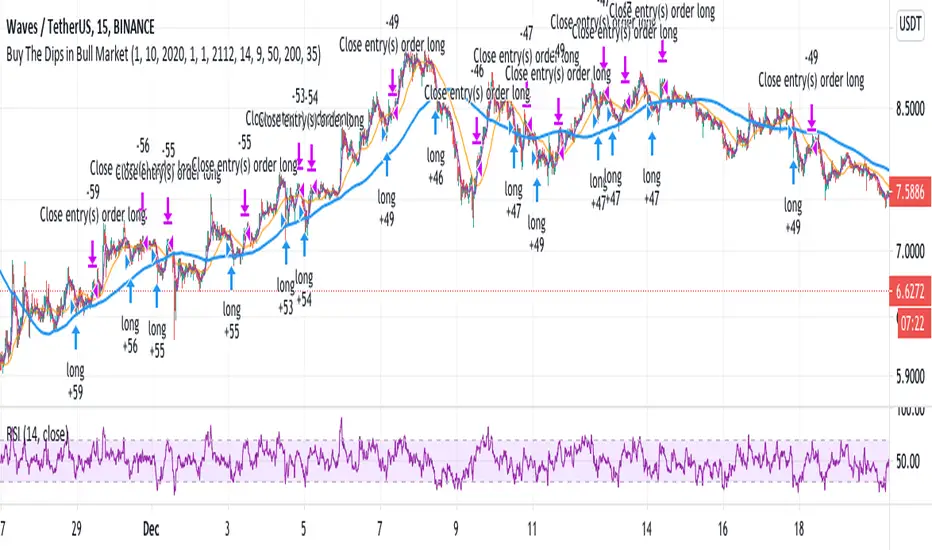
Buy The Dips in Bull Market (by Coinrule)During a Bull market, beating the market, it's challenging. Trading strategies that buy the dips represent one of the best approaches to surf the trend and optimize the returns.
The main obstacle is to gauge the dip's magnitude properly and set up the take profit level accordingly. The RSI is an excellent tool to catch price drops as it adjusts the entry to the asset's current volatility. Nevertheless, using the RSI as an indicator for exit is not an optimal solution in trending markets as it may end up with two scenarios:
The price reverts before reaching overbought conditions. That is the case when the trend is not that strong at that moment. Leaving the position open could result in missed profit opportunities.
The price rebounds strongly, leading the RSI quickly in overbought conditions too soon so that the strategy sells too early.
One interesting option is to combine a trigger based on the RSI to catch the dip and then use two moving averages to spot the right time to seel when the price is entirely back on-trend.
The Setup
The entry-signal comes when the RSI is lower than 35 and the MA9 is above the MA200, indicating that the asset is currently in an uptrend.
The sell-signal comes when at the same time, the price is above the MA9, and the MA9 is above the MA50.
This setup was optimized on the 15-min time frame after over 150 backtests.
A trading fee of 0.1% is taken into account. The fee is aligned to the base fee applied on Binance, which is the largest cryptocurrency exchange.
Vortex and RSI ts 2020* System long only (for shares).
* Enter if Vortex up crosses up vortex down and there is the classical second test of a close higher than previous' high
* Exit if
a) RSI crosses under 70 OR
b) on the contrary, Vortex down crosses up vortex up and there is the classical second test of a close lower than previous' low
* fixed money management to be optimized added.

Combo Backtest 123 Reversal & Key Reversal Down This is combo strategies for get a cumulative signal.
First strategy
This System was created from the Book "How I Tripled My Money In The
Futures Market" by Ulf Jensen, Page 183. This is reverse type of strategies.
The strategy buys at market, if close price is higher than the previous close
during 2 days and the meaning of 9-days Stochastic Slow Oscillator is lower than 50.
The strategy sells at market, if close price is lower than the previous close price
during 2 days and the meaning of 9-days Stochastic Fast Oscillator is higher than 50.
Second strategy
A key reversal is a one-day trading pattern that may signal the reversal of a trend.
Other frequently-used names for key reversal include "one-day reversal" and "reversal day."
How Does a Key Reversal Work?
Depending on which way the stock is trending, a key reversal day occurs when:
In an uptrend -- prices hit a new high and then close near the previous day's lows.
In a downtrend -- prices hit a new low, but close near the previous day's highs
WARNING:
- For purpose educate only
- This script to change bars colors.

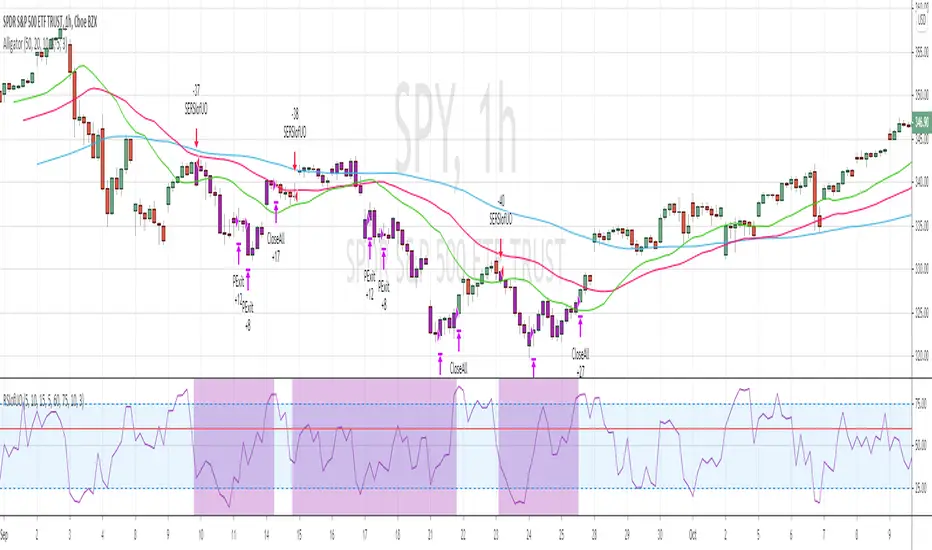
RSI of Ultimate Oscillator [SHORT Selling] StrategyThis is SHORT selling strategy with Ultimate Oscillator. Instead of drectly using the UO oscillator , I have used RSI on UO (as I did in my previous strategies )
Ultimator Oscillator settings are 5, 10 and 15
RSI of UO setting is 5
Short Sell
==========
I have used moving averages from WilliamAlligator indicator --- settings are 10(Lips), 20(teeth) and 50 (Jaw)
when Lips , Teeth and Jaw are aligned to downtrend (that means Lips < Teeth < Jaw )
Look for RSIofUO dropping below 60 ( setting parameter is Sell Line )
Partial Exit
==========
When RSIofUO crossing up Oversold line i.e 30
Cover Short / Exit
=================
When RSIofUO crosisng above overbought line i.e 70
StopLoss
========
StopLoss defaulted to 3 % , Though it is mentioned in settings , it has not been not used to calcuate and StopLoss Exit... Reason is, when RSIofUO already crossed 60 line (for SHORTING) , then it would take more efforts go up beynd 60. There is saying price takes stairs to climb up but it takes elevator to go down. I have not purely depend on this to exit stop loss, however noticed the trades in this stratgey did not get out with loss higher than when RSIofUO reaching 70 level.
Note
======
Williams Alligator is not drawn from the script. It is manually added to chart for illustration purpose. Please add it when you are using this strategy , whch woould give an idea how the strategy is taking Short Trades.
This is tested on Hourly chart for SPY
Bar color changes to purple when the strategy is in SHORT trade
Warning
========
For the eductional purposes only
Escaping of Rate from Avarage By Mustafa OZVER StrategyI simulated the EoRfA indicator with the gold price
For details about the indicator, visit my profile on tradingview
For Simulation, with default settings, we order
if Eorfa > 1 and change(eorfa) < 0
sell
if Eorfa < -1 and change(eorfa) > 0
buy
And we got
- 2.49 % profit
- 74 % profittable order from all
But only this value can not guarantee good results for trading. BE CAREFUL

Quansium Series A BacktestThis comes with preconfigured setups or strategies. Simply choose one from our list based on the timeframe it was made for. Leverage can be changed; to keep trading safe, a maximum of 2 is allowed. In our findings, this was able to trade crypto (specifically BTC ), MES (Micro E-mini S&P 500 Index Futures ), and stocks. It is important to know that setups A, B, C, and D use variable position sizing, and dynamic stop loss/trailing stop/take profit, these parameters are provided through the alerts. The rest of the strategies were created with a simpler approach in mind, just plainly entry/exits signals.
Quansium as a framework:
Price reformat: we take the price source (Open, Close, High, Low) and remove any noise that affects the accuracy of our signals.
Time awareness: we take several time periods of the data on the chart such as start, end, and whole. We use this to add more depth to our signals.
Position size: our backtest tries to recreate as much as the real world trades as possible so our position is determined by the current equity. We also use the volatility of the market to increase or decrease our exposure or risk.
Risk awareness: stop loss, take profit, trailing stop are the risk exits we use to provide our users some peace of mind. These parameters are totally dynamic and follow the same behavior of the market.
Signals filtering: to make almost non-existent any errors and increase the quality of our trades, our indicators go through multiple phases, this avoid double entries or early exits, and help maintain a record of what has transpired and what’s currently taking place.
Indicators: whenever we can we use custom code or our own functions instead of the defaults ones provided. This gives us total control of what we’re trying to achieve. In many cases we tend to combine several indicators’ logic into one creating a more personalized take on it.
Easiness: since we started our main goal has been to provide the easiest and fastest way to alerts’ creation. It has taken us years to reach this level where now we already provide a list of preset strategies so the user doesn’t have to spend much time tinkering with scripts and more on other matters, because we know life is more than just trading.
Raw signals: we provide the option to turn off as much of our advanced features such as stop loss, take profit, trailing stop, dynamic sizing, etc, etc for a simple approach. Trade signals still go through the signals filtering method mentioned above,
Timeframe pairing: we take trading very seriously, by no way we’ll want the user to lose money (although such thing is expected because past results aren’t an indicative of futures ones), through years of experience we have found what are usually common mistakes the user makes, this feature allows us to only activate the strategy if the right timeframe is chosen.
Trend filters: through the years we have improved the arts of the trend. We like to keep things simple but yet powerful. We observe the macro and micro trend of the security. This helps confirm we are entering at the desirable timing. We also incorporate volume and volatility into decision making, we simply programmed it to trade when these are increasing and higher than the average values observed in both the short and long term. Finally we take into account the strength of the pair to make our final choice of whether to enter or wait, and if anything flashes contrary movement then we cancel the upcoming signal and stop monitoring until the next one comes along.
Full automated risk: stop loss, take profit, and trailing stops usually are set in percentages, and optimized even more using the current market behavior to become more adaptive. But always remains some sort of fixation, so the user must choose a value somewhere. This is where our framework shines the most, as previously mentioned before when we take time into our calculations, we use several periods to observe performance and get values that keep our risk exits natural and closest to the flow of the market itself.
Setups:
A: Centered oscillator with the difference of several moving averages with more sensitive settings. Momentum focused.
B: Centered oscillator using simple moving averages. Trend-Following focused.
C: Centered oscillator using smoothed data with the help of faster moving averages. Trend-Following focused.
D: Centered oscillator with the difference of several moving averages with less sensitive settings. Trend-Following focused.
E: Centered oscillator with the difference of moving averages where the standard deviation is applied first. It uses less sensitive settings. Trend-Following focused.
F: Finds the relationship between multiple readings of the price’s relative strength to better pin-point downs and ups. Trend-Following focused.
G: Centered oscillator with the difference of moving averages where the standard deviation is applied first. It uses more sensitive settings. Momentum focused.
H: Multiple centered oscillators using various moving averages. Trend-Following focused.
I: Centered oscillator using simple moving averages. Momentum focused.
Note: The framework is composed of almost 1000 lines of code as compared to each indicator that makes up the setup which is around 10. The power from Quansium doesn't come from the strategies themselves but rather the overall system that turns simple signals into complex and advanced trades.
Strategy Tester:
Initial Capital: chosen value is $20,000, as an approximate to Bitcoin’s ATH (All-Time High). In previous iterations we noticed some trades won’t go through if the capital was less than the ATH.
Order Size: 100% of equity (although the script controls this, and this is of no regards to the results).
Pyramiding: 1, system doesn’t place multiple entries in a row, only one at a time.
Commission: This simulates order execution with custom trading fees. Commissions are turned off by default because this script works in various markets and each operates differently. In order to reach results that are close to real world conditions, it is imperative the user fills this based upon their broker or exchange data.
When we started, we were focused on finding the best indicator, or creating it ourselves. After years we came to realize that the secret is not in which indicator you use but the framework behind it. All strategies have bad, good, best, worst performance periods. The key of a good system is to help keep you safe when it’s down and maximize your potential when it’s up. We hope this material at the very minimum inspires you to keep going and not lose faith, because it is not the smartest who win but those who persevere.

Optimized RSI Strategy - Buy The Dips (by Coinrule)Buy low and sell high is every trader's mantra. While this approach looks straightforward in theory, it's sometimes challenging to put into practice. That requires stress-management to buy when price drops and resolution in selling when the price is rising. RSI is a useful tool to implement long-term and effective trading strategies. The script presents an optimized RSI trading strategy that uses a Moving average to spot the best time to buy the dip.
The strategy buys when the RSI is lower than 35, and at the same time, the price is below the MA100. In this way, the approach helps avoid catching early dips, increasing buying when the bottom approaches.
The position closes when the RSI value is above 65 . Depending on the volatility of the coins that the strategy will trade, it's possible to adjust the RSI exit value to chase larger profits.
The setup is optimized on a 15-minutes time frame and trading cryptocurrencies versus USD or stable coins.
The strategies was backtested over 150 times with multiple setups and coin to assess the best long-term system.
The strategy assumes each order to trade 30% of the available capital. A trading fee of 0.1% is taken into account. The fee is aligned to the base fee applied on Binance, which is the largest cryptocurrency exchange.

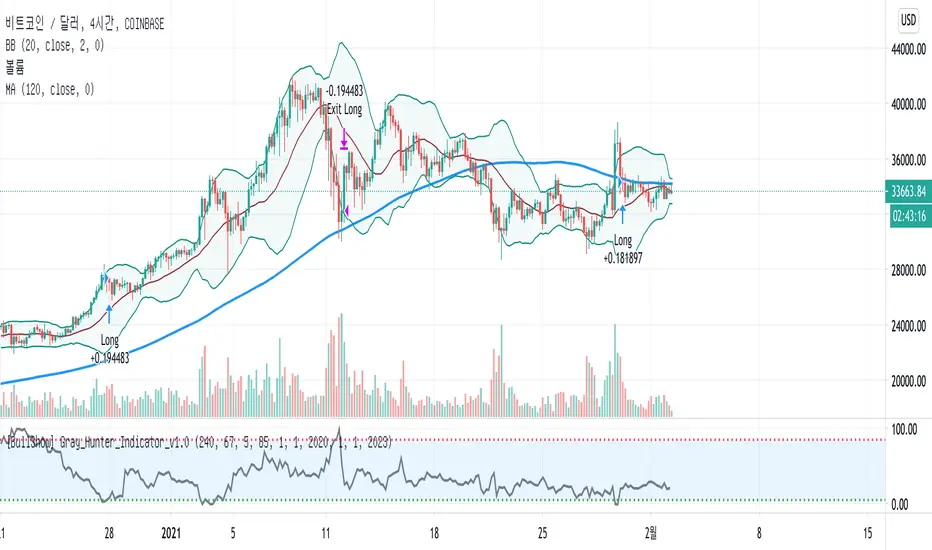
[BullShow] Gray_Hunter_Indicator_v1.0 - Legendary ProfitOver the past 10 years, the price of Bitcoin and cryptocurrency has been dominated by miners. However, since the coronavirus, as the money supply of each government increases and the value of the money decreases accordingly, institutional investors are increasingly intervening in the price of bitcoin. In particular, it is no exaggeration to say that the rise of Bitcoin in recent years was led by institutional investors.
Accordingly, in the past, the indicator of HashRate or Profitability of Mining was an important index for cryptocurrency investment, but now is the time to examine the investment movement of institutions.
This idea is an idea to follow the movement of institutional investors.
I created an index based on the correlation and disparity between the price of institutional investors and the price of bitcoin.
Accuracy increases after the corona, when institutional investors start buying in earnest.
There is no repainting on the chart.
If you are interested in my strategy, Use the link below to obtain access to this indicator or PM me to obtain access
Indicators are shared only with supporters.
Bless you and thanks all!
지난 10년동안 비트코인 및 암호화폐의 가격은 채굴자에 의해 좌지우지 되어 왔습니다. 그러나 코로나바이러스 이후 각 정부의 화폐 공급이 많아지고 그에 따라 화폐가치가 하락하면서 기관투자자의 개입이 조금씩 많아지고 있는 상황입니다. 특히 2020년 최근들어 비트코인의 상승은 기관투자자가 이끌었다고 해도 과언이 아닙니다.
이에따라 과거에는 HashRate 또는 Profitability of Mining의 지표가 암호화폐 투자에 있어서 큰 index였지만 이제는 기관의 투자동향을 보다 더 살펴야 할 때입니다.
그래서 오늘 소개 해 드리고 싶은 전략은 기관의 움직임을 추종하는 전략입니다.
기관투자자들의 매수가격과 비트코인가격의 상관관계 및 이격도를 가지고 지표를 만들었습니다.
기관 투자자들이 본격적으로 매수를 시작하는 코로나 이후 부터 정확도가 증가합니다.
차트에 리페인팅은 없습니다.
Indicator의 공유는 Supporter 분들에게만 해 드리고 있습니다.
축복합니다 언제나 승리하세요!
Indicator Information
* Indicator is only working on the time frame (not support D,W,M and Seconds)
* Initial indicator sets under 1 to buy, over 85 sell
* The accuracy and reliability of indicators rise sharply from 2020, From the point when institutional market intervention increases rapidly
* Other altcoins buy and sell at the same time frame as Bitcoin.
* 해당 인디케이터는 시간 범위에서만 작동합니다 (D, W, M 및 초는 지원하지 않음).
* 초기 지표셋팅은 1아래에서 매수, 85 이상에서 매도
* 지표의 정확성과 신뢰성은 기관의 시장 개입이 급격히 증가하는 2020 년부터 급격히 증가합니다.
* 다른 알트 코인은 비트 코인과 동시에 매매합니다.
Back Testing
Back testing start from 2020. 01 . 01
Initial_capital: 1000
percent_of_equity: 100%
Commission: 0.2%
Profit
BTCUSDT: 559.12%
ETHUSDT: 1675.08%
XRPUSDT: 1121.74%
XLMUSDT: 1003.23%
LINKUSDT: 2087.28%
LTCUSDT: 781.35%
BCHUSDT: 310.89%
BNBUSDT: 706.14%
XMRUSDT: 667.08%
DASHUSDT: 570.35%
TRXUSDT: 796.54%
ADAUSDT: 1352.74%
CIVICUSDT: 3259.17%
IOTAUSDT: 935.22%
WAVESUSDT: 4187.95%
Combo Backtest 123 Reversal & Keltner Channel This is combo strategies for get a cumulative signal.
First strategy
This System was created from the Book "How I Tripled My Money In The
Futures Market" by Ulf Jensen, Page 183. This is reverse type of strategies.
The strategy buys at market, if close price is higher than the previous close
during 2 days and the meaning of 9-days Stochastic Slow Oscillator is lower than 50.
The strategy sells at market, if close price is lower than the previous close price
during 2 days and the meaning of 9-days Stochastic Fast Oscillator is higher than 50.
Second strategy
The Keltner Channel, a classic indicator
of technical analysis developed by Chester Keltner in 1960.
The indicator is a bit like Bollinger Bands and Envelopes.
WARNING:
- For purpose educate only
- This script to change bars colors.
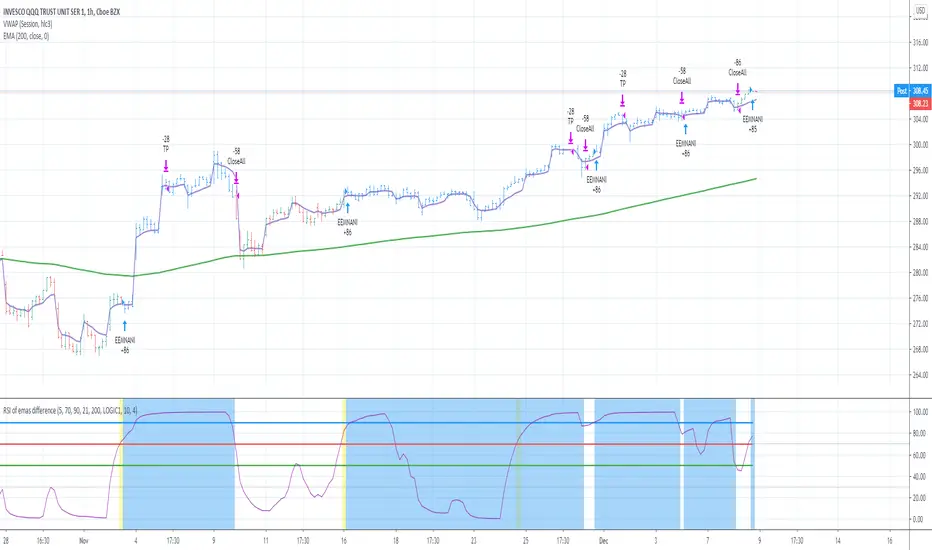
RSI of emas difference [ EEMANI ]This strategy is found by error.
Initially I started to find the weekly version of RSIofVWAP strategy. somehow I didn't see good results. Then , on the same script I did change it to find rsi emas difference strategy.
while changing the code , for the long term ema /slow ema input , I had entered fastema value instead of the price close. That is the error.
But strategy showed good results , then I extended it to add stop loss and take profits. Since this is found by error, I cant explain much how it is working.
Please check if your symbol works with this strategy and let me know ... your feedback is greatly appreciated to improve the strategy ...
I name it as EEMANI strategy
BUY
======
When the RSIofEMAsdiff is crossing above 70 (buy Line) and fastEma is rising
Note:
On the indicator it shows yellow background ... thats the entry point ....
when strategy is already in Long position , if you see yellow back ground thats where you can add or enter if you missed earlier signal
background and bar color color changes to blue when strategy is in Long position
Partial Exit
=========
when RSI value reaches 99 , 1/3 of the position si closed with profit
Close
======
when RSI value crossing down 90 (exitLine)
Stop Loss
=========
defaulted to 4% (increasing this value might improve the performance , but number of bars will go high , that means you need to wait longer time to get out of the trade ... Thats boring !!!
Note :
I have added two formulas , both of them are produce similar results. But different equities on different logic. check which formula is working for you
LOGIC1 => fastEMAval-slowEMAval
LOGIC2 => (slowEMAval+fastEMAval)/weeklyVwap
Warning
=========
For the use of educational purposes only