PowerTrend Pro Strategy – Gold OptimizedTired of false signals on Gold?
PowerTrend Pro combines VWAP, Supertrend, RSI, and smart MA filters with trailing stops & break-even logic to deliver high-probability trades on XAUUSD.
PowerTrend Pro Strategy is a professional-grade trading system designed to capture high-probability swing and intraday opportunities on XAUUSD (Gold) and other volatile markets.
🔑 Core Features
VWAP Anchoring – institutional fair value reference to filter trades.
Supertrend (ATR-based) – adaptive trend filter tuned for Gold’s volatility.
Multi-Timeframe RSI – confirms momentum alignment across intraday and higher timeframe.
EMA + SMA Combo – ensures trades follow strong directional bias, reducing false signals.
Dynamic Risk Management
Adjustable Take Profit / Stop Loss (%)
Trailing Stop that locks in profits on extended moves
Break-Even Logic (stop loss moves to entry once price is in profit)
⚡ Gold-Tuned Presets
XAUUSD 1H → tighter TP/SL & faster entries for active intraday trading.
XAUUSD 4H → wider ATR filter & trailing stops to capture bigger swings.
Generic Mode → works on Forex, Indices, and Crypto (fully customizable).
🎯 Why It Works
Gold is notoriously volatile — quick spikes wipe out weak strategies. PowerTrend Pro solves this by combining:
✅ Institutional bias (VWAP)
✅ Adaptive trend filter (Supertrend)
✅ Momentum confirmation (RSI MTF)
✅ Robust trend structure (EMA + SMA)
✅ Smart exits (TP, SL, trailing & breakeven)
This multi-layer confirmation makes entries stronger and keeps risk under control.
🛠️ Usage
Add the strategy to your chart.
Choose a preset (XAUUSD 1H, 4H, or Generic).
Run Strategy Tester for performance metrics.
Optimize TP/SL and ATR values for your broker & market conditions.
🔥 Pro Tip: Combine this strategy with a session filter (London/NY overlap) or volume confirmation to boost accuracy in Gold.
Indicators and strategies

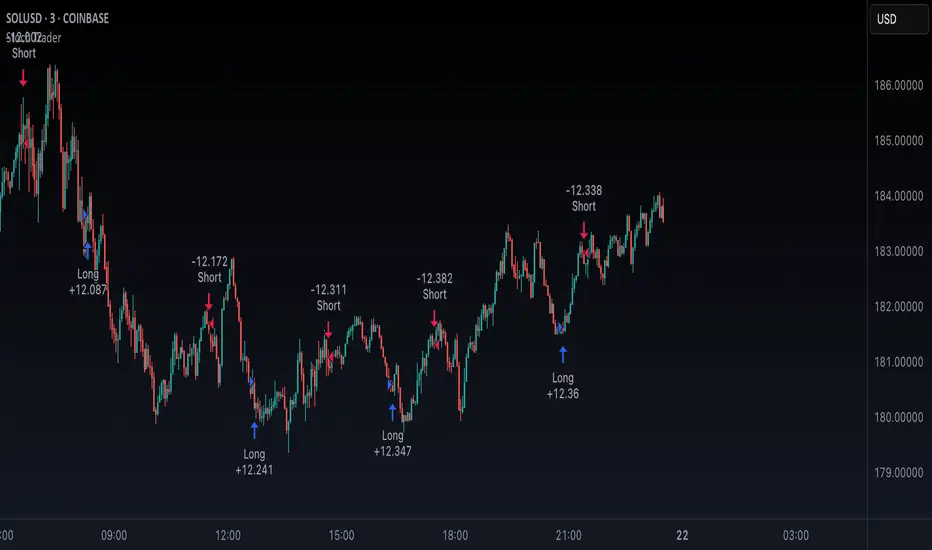
Stoch TraderSimple example strategy that has greater than 60% win rate on 1m, 3m, and 5m views. Using something as simple as this with leverage can produce decent returns within 15-30min. It's also very easy to lose money doing this.
Composite TECH Line (Debug) – v0.2 [Strategy]You can check now first version of strategy - Composite TECH Line V0.2

VWAP Executor — v6 (VWAP fix)tarek helishPractical scalping plan with high-rate (sometimes reaching 70–85% in a quiet market)
Concept: “VWAP bounce with a clear trend.”
Tools: 1–3-minute chart for entry, 5-minute trend filter, VWAP, EMA(50) on 5M, ATR(14) on 1M, volume.
When to trade: London session or early New York session; avoid 10–15 minutes before/after high-impact news.
Entry rules (buy for example):
Trend: Price is above the EMA(50) on 5M and has an upward trend.
Entry zone: First bounce to VWAP (or a ±1 standard deviation channel around it).
Signal: Bullish rejection/engulfing candle on 1M with increasing volume, and RSI(2) has exited oversold territory (optional).
Order: Entry after the confirmation candle closes or a limit close to VWAP.
Trade Management:
Stop: Below the bounce low or 0.6xATR(1M) (strongest).
Target: 0.4–0.7xATR(1M) or the previous micro-high (small return to increase success rate).
Trigger: Move the stop to breakeven after +0.25R; close manually if the 1M candle closes strongly against you.
Filter: Do not trade if the spread widens, or the price "saws" around VWAP without a trend.
Sell against the rules in a downtrend.
Why this plan raises the heat-rate? You buy a "small discount" within an existing trend and near the institutional average price (VWAP), with a small target price.
مواقعي شركة الماسة للخدمات المنزلية
شركة تنظيف بالرياض
نقل عفش بالرياض

Instant Breakout Strategy with RSI & VWAPInstant Breakout Strategy with RSI & VWAP
This TradingView strategy (Pine Script v6) trades breakouts using pivot points, with optional filters for volume, momentum, RSI, and VWAP. It’s optimized for the 1-second timeframe.
Overview
The strategy identifies breakouts when price crosses above resistance (pivot highs) or below support (pivot lows). It can use basic pivot breakouts or add filters for stronger signals. Take-profit and stop-loss levels are set using ATR, and signals are shown on the chart.
Inputs
Left/Right Pivot Bars: Bars to detect pivots (default: 3). Lower values increase sensitivity.
Volume Surge Multiplier: Volume threshold vs. 20-period average (default: 1.5).
Momentum Threshold: Minimum % price change from bar open (default: 1%).
Take-Profit ATR Multiplier: ATR multiplier for take-profit (default: 9.0).
Stop-Loss ATR Multiplier: ATR multiplier for stop-loss (default: 1.0).
Use Filters: Enable/disable volume, momentum, RSI, and VWAP filters (default: off).
How It Works
1. Pivot Detection
Finds pivot highs (resistance) and lows (support) using ta.pivothigh and ta.pivotlow.
Tracks the latest pivot levels.
2. Volume Surge
Compares current volume to a 20-period volume average.
A surge occurs if volume exceeds the average times the multiplier.
3. Momentum
Measures price change from the bar’s open.
Bullish: Price rises >1% from open.
Bearish: Price falls >1% from open.
4. RSI and VWAP
RSI: 3-period RSI. Above 50 is bullish; below 50 is bearish.
VWAP: Price above VWAP is bullish; below is bearish.
5. ATR
14-period ATR sets take-profit (close ± atr * 9.0) and stop-loss (close ± atr * 1.0).
Trading Rules
Breakout Conditions
Bullish Breakout:
Price crosses above the latest pivot high.
With filters: Volume surge, bullish momentum, RSI > 50, price > VWAP.
Without filters: Only the crossover is needed.
Bearish Breakout:
Price crosses below the latest pivot low.
With filters: Volume surge, bearish momentum, RSI < 50, price < VWAP.
Without filters: Only the crossunder is needed.
Entries and Exits
Long: Enter on bullish breakout. Set take-profit and stop-loss. Close any short position.
Short: Enter on bearish breakout. Set take-profit and stop-loss. Close any long position.
Visuals
Signals: Green triangles (bullish) below bars, red triangles (bearish) above bars.
Pivot Levels: Green line (resistance), red line (support).
Indicators: RSI (blue, separate pane), VWAP (purple, on chart).
How to Use
Apply to a 1-second chart in TradingView for best results.
Adjust inputs (e.g., pivot bars, multipliers). Enable filters for stricter signals.
Watch for buy/sell triangles and monitor RSI/VWAP.
Use ATR-based take-profit/stop-loss for risk management.
Notes
Best on 1-second timeframe due to fast RSI and responsiveness.
Disable filters for more signals (less confirmation).
Backtest before live trading to check performance.
This strategy uses pivots, volume, momentum, RSI, and VWAP for clear breakout trades on the 1-second timeframe.


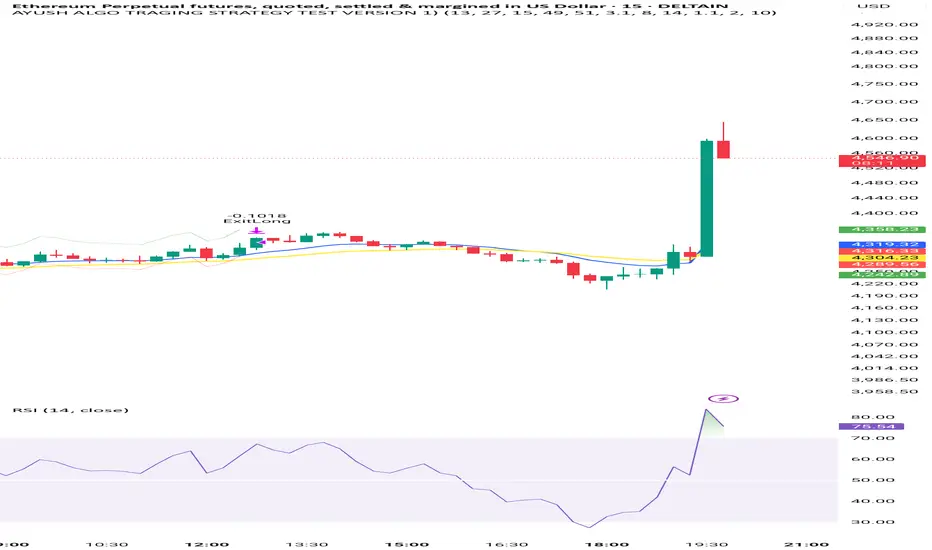
AYUSH ALGO TRAGING STRATEGY TEST VERSION 1)Very good strategy , it uses two moving avg crossovers and also rsi and atr for confirmation, this strategy is fully automated

US100 Liquidity Precision StrategyScalping strategy 5-10 point sl / 17 points tp
Automatic BE
Consistent money over time

Range FinderRange Finder Strategy for TradingView
Overview
The Range Finder Strategy is a sophisticated trading system designed for forex and cryptocurrency markets, leveraging dynamic range detection, wick-based rejection patterns, and EMA confluence to execute high-probability trades. This strategy identifies key price ranges using pivot points and triggers trades when price rejects from these boundaries with significant wick formations, aligning with the broader market trend as confirmed by EMA crossovers. It incorporates robust risk management, customizable parameters, and visual aids for clear trade visualization, making it suitable for both manual and automated trading on platforms like Bitget via webhook alerts.
Strategy Components
1. Dynamic Range Detection
Pivot Points: The strategy identifies range boundaries using pivot highs and lows, calculated with a user-defined Pivot Length (default: 5 bars left/right). These pivots mark significant swing points, defining the upper (range high) and lower (range low) boundaries of the price range.
Visualization: The range high is plotted as an orange line, and the range low as a purple line, using a broken line style (plot.style_linebr) to show only confirmed pivot levels, providing a clear visual of the trading range.
2. Wick-Based Rejection Pattern
Wick Detection: The strategy looks for rejection candles at the range boundaries, characterized by significant wicks. A wick is considered valid if its size is at least the user-defined Wick to Body Ratio (default: 1.1, or 10% larger than the candle body).
Sell Signal: Triggered when the high exceeds the range high, the candle closes bearish (close < open), and the upper wick meets the ratio requirement.
Buy Signal: Triggered when the low falls below the range low, the candle closes bullish (close > open), and the lower wick meets the ratio requirement.
Purpose: These wicks indicate strong rejection at key levels, often signaling a reversal back into the range, providing high-probability entry points.
3. EMA Trend Confirmation
EMA Calculation: Uses two Exponential Moving Averages (EMAs) calculated on a user-selectable timeframe (default: 5-minute):
EMA 200: Long-term trend indicator (plotted in red).
EMA 50: Short-term trend indicator (plotted in green).
Crossover Logic:
A bullish trend is confirmed when the EMA 50 crosses above the EMA 200 (ema_trend_up = true).
A bearish trend is confirmed when the EMA 50 crosses below the EMA 200 (ema_trend_down = true).
Confluence Requirement: Trades are only executed when the wick rejection aligns with the EMA trend (e.g., sell signals require close < ema200 and bearish trend; buy signals require close > ema200 and bullish trend).
4. Risk Management
Position Sizing: Calculated based on the user-defined Account Balance (default: $10,000) and Risk Per Trade (default: 2%). The position size is determined as risk_amount / stop_distance, where stop_distance is derived from the Average True Range (ATR, default period: 14).
Stop Loss (SL): Set using an ATR-based multiplier (SL Multiplier, default: 9.0). For sells, SL is placed above the high; for buys, below the low.
Take Profit (TP): Set using an ATR-based multiplier (TP Multiplier, default: 6.0) scaled by the Risk:Reward Ratio (default: 6.0), ensuring a favorable reward-to-risk profile.
Example: For a $10,000 account with 2% risk, if ATR is 0.5, the position size is 400 units, with SL and TP dynamically adjusted to market volatility.
5. Trade Execution
Sell Entry: Triggered on a wick rejection above the range high, with bearish EMA confluence (ema_trend_down and close < ema200). Enters a short position with calculated SL and TP.
Buy Entry: Triggered on a wick rejection below the range low, with bullish EMA confluence (ema_trend_up and close > ema200). Enters a long position with calculated SL and TP.
Exit Logic: Uses strategy.exit to set SL and TP levels, closing trades when either is hit.
6. Visual Feedback
Lines and Labels: Upon trade entry, the strategy plots:
Red SL line and label (e.g., "SL: 123.45").
Green TP line and label (e.g., "TP: 120.00").
Entry line (red for sell, green for buy) labeled with "Sell (Range Rejection)" or "Buy (Range Rejection)".
Customization: Users can adjust the Line Length (default: 25 bars) for how long lines persist and Label Position (left or right) for optimal chart visibility.
7. Alert Conditions
Webhook Integration: Generates alerts for Bitget webhook integration, providing JSON-formatted messages with trade details (action, contracts, market position, size, price, symbol, and timestamp).
Usage: Traders can set up automated trading by connecting these alerts to trading bots or platforms supporting webhooks.

RSI-MACD-trade"Strategic trading strategy using RSI and MASCD
Highest returns when applied to weekly charts"
Pivot Distance Strategy# Multi-Timeframe Pivot Distance Strategy
## Core Innovation & Originality
This strategy revolutionizes moving average crossover trading by applying MA logic to **pivot distance relationships** instead of raw price data. Unlike traditional MA crossovers that react to price changes, this system reacts to **structural momentum changes** in how current price relates to recent significant pivot levels, creating earlier signals with fewer false positives.
## Methodology & Mathematical Foundation
### Pivot Distance Oscillator
The strategy calculates:
- **High Pivot Percentage**: (Current Close / Last Pivot High) × 100
- **Low Pivot Percentage**: (Last Pivot Low / Current Close) × 100
- **Pivot Distance**: High Pivot Percentage - Low Pivot Percentage
This creates a standardized oscillator measuring market structure compression/expansion regardless of asset price or volatility.
### Multi-Timeframe Filter
Higher timeframe analysis provides directional bias:
- **HTF Long** → Allow long entries, force short exits
- **HTF Short** → Allow short entries, force long exits
- **HTF Squeeze** → Block all entries, force all exits
## Signal Generation Methods
### Method 1: Dual MA Crossover (Primary/Default)
**Fast MA (14 EMA)** and **Slow MA (50 SMA)** applied to pivot distance values:
- **Long Signal**: Fast MA crosses above Slow MA (accelerating bullish pivot momentum)
- **Short Signal**: Fast MA crosses below Slow MA (accelerating bearish pivot momentum)
**Key Advantage**:
- Traditional: Fast MA(price) crosses Slow MA(price) - reacts to price changes
- This Strategy: Fast MA(pivot distance) crosses Slow MA(pivot distance) - reacts to structural changes
- Result: Earlier signals, better trend identification, fewer ranging market whipsaws
### Method 2: MA Cross Zero
- **Long**: Pivot Distance MA crosses above zero
- **Short**: Pivot Distance MA crosses below zero
### Method 3: Pivot Distance Breakout (Squeeze-Based)
Uses dynamic threshold envelopes to detect compression/expansion cycles:
- **Long**: Distance breaks above dynamic breakout threshold after squeeze
- **Short**: Distance breaks below negative breakout threshold after squeeze
**Note**: Only the Breakout method uses threshold envelopes; MA Cross modes operate without them for cleaner signals.
## Risk Management Integration
- **ATR-Based Stops**: Entry ± (ATR × Multiplier) for stops/targets
- **Trailing Stops**: Dynamic adjustment based on profit thresholds
- **Cooldown System**: Prevents overtrading after stop-loss exits
## How to Use
### Setup (Default: MA Cross MA)
1. **Strategy Logic**: "MA Cross MA" for structural momentum signals
2. **MA Settings**: 14 EMA (fast) / 50 SMA (slow) - both adjustable
3. **Multi-Timeframe**: Enable HTF for trend alignment
4. **Risk Management**: ATR stop loss, ATR take profit
### Signal Interpretation
- **Blue/Purple lines**: Fast/Slow MAs of pivot distance
- **Green/Red histogram**: Positive/negative pivot distance
- **Triangle markers**: MA crossover entry signals
- **HTF display**: Shows higher timeframe bias (top-left)
### Trade Management
- **Entry**: Clean MA crossover with HTF alignment
- **Exit**: Opposite crossover, HTF change, or risk management triggers
## Unique Advantages
1. **Structural vs Price Momentum**: Captures market structure changes rather than just price movement, naturally filtering noise
2. **Multi-Modal Flexibility**: Three signal methods for different market conditions or strategies
3. **Timeframe Alignment**: HTF filtering improves win rates by preventing counter-trend trades


Volume Spike Strategy - Black GUIA volume spike strategy that buys when the volume is 150% above the 20-day average and the price is increasing.
The strategy uses a black-themed GUI for better visibility.
You can customize the volume spike multiplier and the length of the volume moving average using the input parameters.
This strategy is effective for identifying potential breakout points in the market. Always backtest the strategy before applying it to live trading.
Visit - for more such strategies.

Parabolic SAR Trend Following - Black GUIA Parabolic SAR-based strategy that buys when the SAR dots are below the price and sells when they are above.
The strategy uses a black-themed GUI for better visibility.
You can customize the input parameters for the SAR calculation.
This strategy is effective for trending markets.
Always backtest the strategy before applying it to live trading.
Visit - for more such strategies.

M1 Countertrend Scalping (Best-effort)M1 Countertrend Scalping (Best-effort)
M1 Countertrend Scalping (Best-effort)
Imbalance No SL📊 Strategy Name: Imbalance No SL
This strategy specially trades on price jumps (true imbalances) in the market, takes advantage of momentum only, and as soon as the opposite signal and profit is received, the trade is closed immediately.
Imbalance No SL strategy specially generates buy and sell signals based on "Imbalance" logic, without any fixed Stop Loss.
🔍 Core Logic
Imbalance Detection
Bullish Imbalance : When the low of the current candle is above the high of the previous candle.
(i.e. a jump type gap occurred in the market – demand is high, price went straight up)
Bearish Imbalance : When the high of the current candle is below the low of the previous candle.
(i.e. the market suddenly fell down)
Creating Visual Box and Label on Signal:
As soon as bullish imbalance is found, green box & IMB BULL label is displayed on the chart.
Bearish has red box & IMB BEAR label.
Trade Entry Logic
BUY on Bullish Imbalance: If there is already a buy or neutral position, then a new “BUY” signal will fire.
SELL on Bearish Imbalance: If already in sell or neutral position, then new “SELL” signal will fire.
You can set quantity/lot size from ‘qty’ input field.
Trade Average Calculation
Buy/Sell maintains average price and their count (so that if averaging is done then correct P&L is calculated).
Trade Exit Logic (Profit Booking/Signal Reverse)
If your buy is going on and bearish imbalance is formed + price is above your average, then buy will be closed (profit condition).
If sell is going on and bullish imbalance is formed + price is below average, then sell will be closed.
Chart Cleaning/Management
Only keep the label and box of the latest signal on the chart, old boxes/labels are automatically deleted.
Alert
You can get alert on bullish or bearish signal (by using alert feature of TradingView).
✅ Simple Explanation for User
This strategy buys or sells directly at the gap (imbalance).
Whenever there is a clear signal of momentum in the market (breakout of the gap), then the trade entry takes place.
When there is an imbalance in the opposite direction and profit is made, the system closes the trade (closes).
There is no fixed stop-loss, risk management is handled by trade averaging/close.
You will know at every point on the visually chart that at which bar the buy, sell and exit took place.
⚠️ What to remember?
If the market is in trend then this script gives very good signals.
In choppy/sideways market, some loss trades can also come because there is no SL.
Big profit or big loss – both depend on the imbalance signal and market speed.

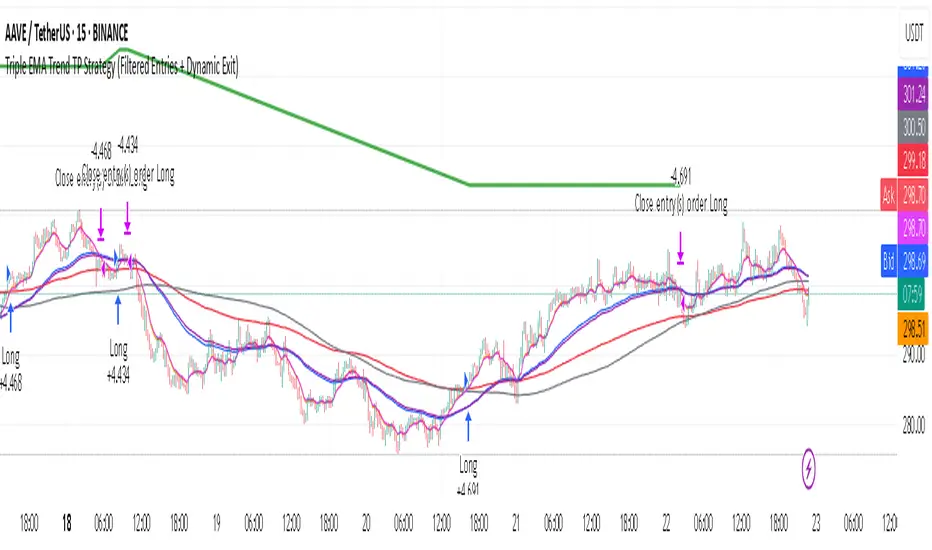
Triple EMA Trend TP Strategy (Filtered Entries + Dynamic Exit)Overview
The Triple EMA Trend TP Strategy is a robust trend-following approach designed for clear, disciplined entries and exits. It leverages a triple EMA crossover for entry signals, combined with a long‑term SMA trend filter, a fixed take‑profit percentage, and a dynamic dual‑EMA exit mechanism to optimize performance and risk management.
Key Features
Triple EMA Crossover Entry
Detects momentum shifts by waiting for the fast EMA to cross above the slow EMA, signaling bullish momentum buildup.
Trend Filter (SMA)
Ensures trades are only taken when price is above the long-term trend (SMA), filtering out low-probability setups.
Take Profit (TP)
Applies a customizable fixed TP, e.g., defaulting to 9.8%, allowing disciplined profit-taking.
Dual EMA Exit
Uses two EMAs on a separate exit logic—if the short exit EMA undercuts the mid exit EMA, the strategy closes the position.
Adjustable Parameters
All key lengths—including fast, mid, slow entry EMAs, trend SMA, exit EMAs, and TP percentage—are user-configurable to suit different assets and timeframes.
Date Range Control
Users can define a backtest window with start and end dates, preventing misleading performance outside intended periods.
Flexible Position Management
Supports full‑equity position sizing, pyramiding up to 10 entries, and runs every tick for high precision.
Setup & Inputs
fastLen: Entry Fast EMA
midLen: Entry Mid EMA
slowLen: Entry Slow EMA
trendLen: Trend Filter SMA
tpPercent: Take Profit Percentage
exitFastLen: Exit Fast EMA
exitMidLen: Exit Mid EMA
startDate / endDate: Backtest time range
Why This Strategy Stands Out
This strategy marries classic trend-following principles with modern risk-control tactics, making it both intuitive and advanced. It balances aggressive entry signals with safety checks via trend validation and layered exit logic. The inclusion of a TP ensures profits are locked in, while the dual EMA exit adds adaptive flexibility to close positions when momentum fades.
How to Use & Customize
Configure Inputs
Adjust EMAs, trend length, and TP percentage to fit your asset and timeframe. For example, shorter EMAs suit intraday trading; longer ones work well for swing strategies.
Set Backtest Range
Use the start/end date fields to limit your testing to the most relevant data, reducing noise from irrelevant market periods.
Backtest & Optimize
Review the Strategy Tester’s performance metrics—Equity curve, drawdown, profit factor, trade list—to assess effectiveness.
Fine‑Tune
Tweak TP, EMAs, or trend length to optimize drawdowns, win rate, or return profile.