Trendlines Oscillator [LuxAlgo]The Trendlines Oscillator helps traders identify trends and momentum based on the normalized distances between the current price and the most recently detected bullish and bearish trend lines.
The indicator features bullish and bearish momentum, a signal line with crossings, and multiple smoothing options.
🔶 USAGE
The indicator displays three lines: two for momentum and one for the signal. When one of the momentum lines (bullish or bearish) crosses the signal line, the tool displays a dot to indicate which momentum is gaining strength.
As a general rule, when the green bullish momentum line is above the red bearish momentum line, it indicates buyer strength. This means that the actual prices are farther from the support trend lines than the resistance trend lines. The opposite is true for seller strength.
To calculate bullish momentum, the tool first identifies bullish trend lines acting as support below the price. Then, it measures the delta between the price and those trend lines and normalizes the reading into the displayed momentum values.
The same process is used for bearish momentum, but with bearish trendlines acting as resistance above the price.
🔹 Length & Memory
Modifying the Length and Memory values will cause the tool to display different momentum values.
Traders can adjust the length to detect larger trendlines and adjust the memory to indicate how many trendlines the tool should consider.
As the chart above shows, smaller values make the tool more responsive, while larger values are useful for detecting larger trends.
🔹 Smoothing
By default, the data is not smoothed, and the signal uses a triangular moving average with a length of 10. Traders can smooth both the data and the signal line.
Traders can choose from up to ten different methods, or none. Some examples are shown on the chart above.
🔶 DETAILS
The steps for the calculations are as follows:
1. Gather the pivots, highs, and lows.
ph = fixnan(ta.pivothigh(lengthInput, lengthInput))
pl = fixnan(ta.pivotlow(lengthInput, lengthInput))
2. Calculate the slope and y-intercept for each trendline between contiguous lower highs (resistance) or higher lows (support).
if ph < ph
slope = (ph - ph )/(n-lengthInput - phx1)
res.unshift(l.new(ph - slope * phx1, slope))
if pl > pl
slope = (pl - pl )/(n-lengthInput - plx1)
sup.unshift(l.new(pl - slope * plx1, slope))
3. Calculate the value of each trendline on the current bar, then calculate the difference with the current price (delta). To calculate the relative sum of deltas, only consider trendlines below the price for support or above the price for resistance.
method get_point(l id, x)=>
id.slope * x + id.intercept
for element in sup
point = element.get_point(n)
if sourceInput > point
sup_sum += sourceInput - point
sup_den += math.abs(sourceInput - point)
for element in res
point = element.get_point(n)
if sourceInput < point
res_sum += point - sourceInput
res_den += math.abs(point - sourceInput)
4. Normalize the value from 0 to 100 by taking the sum of the relative values of the deltas divided by the sum of the absolute values of the deltas.
float supportLine = sup_sum / sup_den * 100
float resistanceLine = res_sum / res_den * 100
5. Smooth both values, then calculate the signal line as the difference between them.
float smoothSupport = smooth(supportLine,dataSmoothingInput,dataSmoothingLengthInput)
float smoothResistance = smooth(resistanceLine,dataSmoothingInput,dataSmoothingLengthInput)
float signal = math.abs(smoothSupport - smoothResistance)
float signalLine = smooth(signal,smoothingInput,smoothingLengthInput)
6. Calculate the crossing signals against the signal line, using only the first signal from each series of bullish or bearish crossings.
bullSignal = smoothSupport > signalLine and smoothSupport < signalLine
bearSignal = smoothResistance > signalLine and smoothResistance < signalLine
lastSignal := bullSignal and lastSignal == BEAR ? BULL : bearSignal and lastSignal == BULL ? BEAR : lastSignal
firstBull = ta.change(lastSignal) > 0
firstBear = ta.change(lastSignal) < 0
🔶 SETTINGS
Length: The size of the market structure used for trendline detection.
Memory: The number of trendlines used in calculations.
Source: The source for the calculations is closing prices by default.
🔹 Smoothing
Data Smoothing: Choose the smoothing method and length
Signal Smoothing: Choose the smoothing method and length
Indicators and strategies

ChopScore📝 Script Description: ChopScore – Candle-Based Choppiness Indicator
The ChopScore indicator helps traders assess the cleanliness and quality of recent price action by analyzing the relationship between candle body size and overall candle range (high-low).
Unlike traditional volatility or trend indicators, ChopScore does not assume trend direction. Instead, it focuses on how "clean" or "choppy" the price movement is, helping traders spot scrips and environments prone to shakeouts, fakeouts, or stop hunts.
📊 How It Works:
Calculates a custom choppiness score based on the ratio of the candle body to its full range (wicks included).
A smoothed average is plotted over a user-defined lookback period
.
The current score is displayed in a table on the chart, with colors indicating the choppiness level:
🔵 < 50: Cleaner price action (lower shakeout risk)
🟢 50–54.99: Moderate
🟠 55–59.99: Messier price action
🔴 ≥ 60: Very choppy (high shakeout potential)
⚙️ Inputs:
Lookback Period – Controls how many bars are used for averaging the choppiness.
Table Position – Choose where the score appears on the chart.
🎯 Use Case:
Use ChopScore to:
Identify scrips where price action is clean and decisive (e.g., safer entries).
Avoid scrips noise and shakeout potential.
Complement trend/momentum indicators without confusing direction with structure.
📌 Notes:
This script is for educational purposes and does not provide buy/sell signals.
Always confirm with additional tools or analysis before trading decisions.

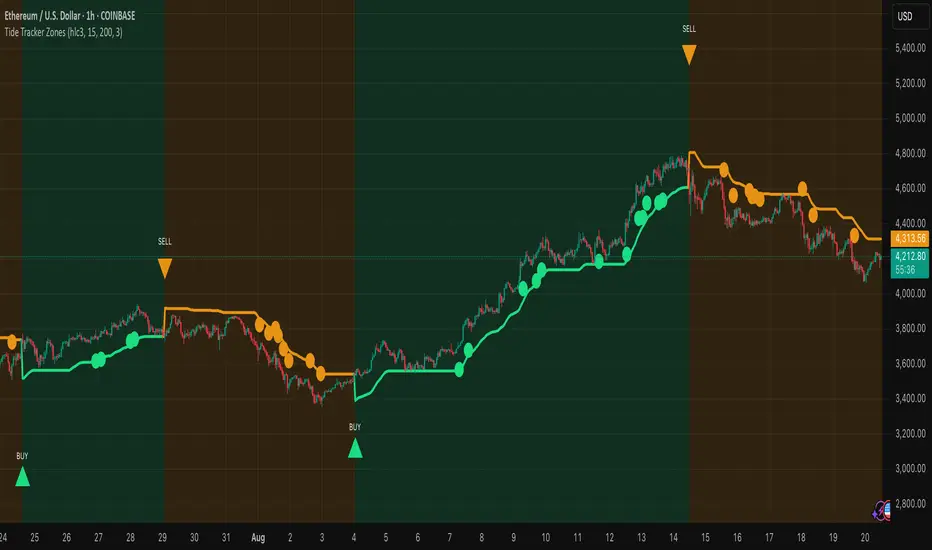
Tide Tracker ZonesTide Tracker Zones – Advanced Trend & Pullback Visualizer
Overview
Tide Tracker Zones is a sophisticated trading tool designed for traders who require clarity, precision, and actionable insights in real time. The indicator converts price action into dynamic trend zones, allowing users to instantly recognize market direction, potential reversals, and low-risk entry opportunities. By visualizing the market in this way, traders can focus on execution rather than deciphering complex charts.
Unlike static indicators, Tide Tracker Zones adapts to market volatility, providing a clear picture of bullish and bearish pressure across multiple timeframes. Its visual design, including color-coded trend zones, a prominent guide line, and carefully placed signals, ensures that market behavior is easy to interpret, making it suitable for scalping, swing trading, and longer-term strategies alike.
How It Works
The indicator relies on dynamic upper and lower bands derived from recent price ranges and a configurable multiplier. These bands expand during volatile periods and contract when price action stabilizes, creating flexible zones that reflect the dominant market tide.
A guide line tracks the active band, serving as a continuous reference for trend direction. Unlike traditional moving averages, the guide line does not clutter the chart but instead provides a subtle, intuitive indication of whether the market is in a bullish or bearish phase. Background shading reinforces this trend visually, highlighting bullish zones in one color and bearish zones in another, so the prevailing market flow is immediately clear.
The system continuously evaluates price relative to the bands to determine trend direction and detect potential reversals. When price crosses a band and flips the trend, the guide line updates, and signals are generated, providing traders with actionable information without overwhelming the chart.
Signals and Pullbacks
Tide Tracker Zones offers visual cues that make entry points more obvious and less speculative. Trend reversal arrows are plotted when the market changes direction: BUY arrows indicate a shift from bearish to bullish, and SELL arrows indicate a shift from bullish to bearish.
The indicator also highlights first pullbacks within an active trend. These pullback dots mark low-risk opportunities to enter a trend in progress, filtered to ensure that only the most relevant signals are displayed. The system uses ATR-based spacing to place arrows and dots vertically on the chart, preventing visual clutter and ensuring readability even during periods of high volatility.
Color-coded zones enhance situational awareness. Bullish zones are displayed in a customizable orange, while bearish zones are shown in green. Transparency is dynamically adjusted to maintain chart clarity while still providing a clear indication of trend strength.
Strategy Integration
Tide Tracker Zones can be used effectively for both trend-following and pullback strategies. Traders may enter positions in the direction of the guide line and colored zone, using trend reversal arrows for confirmation. First pullback dots offer tactical entries with reduced risk, allowing traders to enter a trend after a brief retracement.
Stop-loss levels can be placed just beyond the opposing trend zone, while take-profit targets may be determined using the width of the bands to account for market volatility. The indicator adapts seamlessly across multiple timeframes. Higher timeframes provide context and filter noise, while lower timeframes allow traders to refine entry timing. This makes it a versatile tool for scalping, swing trading, or longer-term positions.
Advanced Techniques
For traders seeking greater precision, Tide Tracker Zones can be combined with volume or momentum indicators to validate signals. Observing the sequence of trend arrows and pullback dots allows users to develop a systematic approach to entries and exits. Monitoring the width and behavior of the bands over time can also provide insights into periods of expanding or contracting volatility, helping traders anticipate market shifts.
Adjustments to the spread length and multiplier allow the indicator to be tuned for different assets and market conditions. By understanding the interaction between the guide line, trend zones, and pullback signals, traders can create a robust framework for decision-making, reducing guesswork and improving consistency.
Why Use Tide Tracker Zones
Tide Tracker Zones provides instant clarity and actionable insight in any market. Its dynamic zones and guide line give a clear visual understanding of trend direction, while trend reversal arrows and pullback dots highlight potential entry points. Unlike traditional indicators, it adapts to volatility and changing conditions, making it reliable across multiple asset classes and timeframes.
By combining trend detection, pullback analysis, and intuitive visual guidance, Tide Tracker Zones equips traders with a complete framework for disciplined, confident trading, transforming complex price action into a visual map of opportunity.
EMA21/SMA21 + ATR Bands SuiteThe EMA/SMA + ATR Bands Suite is a powerful technical overlay built around one of the most universally respected zones in trading: the 21-period moving average. By combining both the EMA21 and SMA21 into a unified framework, this tool defines the short-term mean with greater clarity and reliability, offering a more complete picture of trend structure, directional bias, and price equilibrium. These two moving averages serve as the central anchor — and from them, the script dynamically calculates adaptive ATR bands that expand and contract with market volatility. Whether you trade breakouts, pullbacks, or reversion setups, the 21 midline combined with ATR extensions offers a powerful lens for real-time market interpretation — adaptable to any timeframe or asset.
🔍 What's Inside?
✅ EMA21 + SMA21 Full Plots and Reduced-History Segments using arrays:
Enable full plots or segmented lines for the most recent candles only with automatic color coding. The reduced-history plots are perfect for reducing clutter on your chart.
✅ ATR Bands (2.5x & 5x):
Adaptive ATR-based volatility envelopes plotted around the midline (EMA21 + SMA21) to indicate:
🔸Potential reversion zones.
🔸Trend continuation breakouts.
🔸Dynamic support/resistance levels.
🔸 Expanding or contracting volatility states
🔸 Trend-aware color changes — yellow when both bands are rising, purple when falling, and gray when direction is mixed
✅ Dual MA Fills (EMA21/SMA21):
Visually track when short-term momentum shifts using a fill between EMA21 and SMA21
✅ EMA5 & EMA200 Labels:
Display anchored labels with rounded values + % difference from price, helping you track short-term + macro trends in real-time.
✅ Intelligent Bar Coloring
Bars are automatically colored based on both price direction and position relative to the EMA/SMA. This provides instant visual feedback on trend strength and structural alignment — no need to second-guess the market tone.
✅ Dynamic Close Line Tools:
Track recent price action with flexible close-following lines
✅ RSI Overlay on Candles:
Optional RSI + RSI SMA displayed above the current bar, with automatic color logic.
🎯 Use Cases
➖Trend Traders can identify when price is stacked bullishly across moving averages and breaking above ATR zones.
➖Mean Reversion Traders can fade extremes at 2.5x or 5x ATR zones.
➖Scalpers get immediate trend insight from colored bar overlays and close-following lines.
➖Swing Traders can combine multi-timeframe EMAs with volatility thresholds for higher confluence.
📌 Final Note:
As powerful as this script can be, no single indicator should be used in isolation. For best results, combine it with price action analysis, higher-timeframe context, and complementary tools like trendlines, moving averages, or support/resistance levels. Use it as part of a well-rounded trading approach to confirm setups — not to define them alone.

BUY AND SELL HFK//@version=5
indicator(title="Sniper Machine", shorttitle="Sniper Machine", overlay=true)
// UI Options for Auto Trend Detection and No Signal in Sideways Market
autoTrendDetection = input.bool(true, title="Auto Trend Detection")
noSignalSideways = input.bool(true, title="No Signal in Sideways Market")
// Color variables
upTrendColor = color.white
neutralColor = #90bff9
downTrendColor = color.blue
// Source
source = input(defval=close, title="Source")
// Sampling Period - Replaced with Sniper Machine
period = input.int(defval=100, minval=1, title="Sniper Machine Period")
// Trend Master - Replaced with Sniper Machine
multiplier = input.float(defval=3.0, minval=0.1, title="Sniper Machine Multiplier")
// Smooth Average Range
smoothRange(x, t, m) =>
adjustedPeriod = t * 2 - 1
avgRange = ta.ema(math.abs(x - x ), t)
smoothRange = ta.ema(avgRange, adjustedPeriod) * m
smoothRange
smoothedRange = smoothRange(source, period, multiplier)
// Trend Filter
trendFilter(x, r) =>
filtered = x
filtered := x > nz(filtered ) ? x - r < nz(filtered ) ? nz(filtered ) : x - r :
x + r > nz(filtered ) ? nz(filtered ) : x + r
filtered
filter = trendFilter(source, smoothedRange)
// Filter Direction
upCount = 0.0
upCount := filter > filter ? nz(upCount ) + 1 : filter < filter ? 0 : nz(upCount )
downCount = 0.0
downCount := filter < filter ? nz(downCount ) + 1 : filter > filter ? 0 : nz(downCount )
// Colors
filterColor = upCount > 0 ? upTrendColor : downCount > 0 ? downTrendColor : neutralColor
// Buy/Sell Signals - Adapted from Clear Trend Logic
trendUp = upCount > 0 // Equivalent to REMA_up in Clear Trend
newBuySignal = trendUp and not trendUp and barstate.isconfirmed
newSellSignal = not trendUp and trendUp and barstate.isconfirmed
initialCondition = 0
initialCondition := newBuySignal ? 1 : newSellSignal ? -1 : initialCondition
longSignal = newBuySignal and initialCondition == -1
shortSignal = newSellSignal and initialCondition == 1
// Alerts and Signals
plotshape(longSignal, title="Buy Signal", text="BUY🚀", textcolor=#000000, style=shape.labelup, size=size.small, location=location.belowbar, color=#fae104) // Bright yellow for Buy
plotshape(shortSignal, title="Sell Signal", text="SELL🚨", textcolor=#000000, style=shape.labeldown, size=size.small, location=location.abovebar, color=#fb0202) // Bright red for Sell
alertcondition(longSignal, title="Buy alert on Sniper Machine", message="Buy alert on Sniper Machine")
alertcondition(shortSignal, title="Sell alert on Sniper Machine", message="Sell alert on Sniper Machine")

CVD Absorption + Confirmation [Orderflow & Volume]This indicator detects bullish and bearish absorption setups by combining Cumulative Volume Delta (CVD) with price action, candlestick, and volume confirmations.
🔹 What is Absorption?
Absorption happens when aggressive buyers/sellers push CVD to new highs or lows, but price fails to follow through.
Bearish absorption: CVD makes a higher high, but price does not.
Bullish absorption: CVD makes a lower low, but price does not.
This often signals that limit orders are absorbing aggressive market orders, creating potential reversal points.
🔹 Confirmation Patterns
Absorption signals are only shown if they are validated by one of the following patterns:
Engulfing candle with low volume → reversal faces little resistance.
Engulfing candle with high volume → strong aggressive participation.
Pin bar with high volume → absorption visible in the wick.
CVD flattening / slope reversal → shift in aggressive order flow.
🔹 Signals
✅ Bullish absorption confirmed → Green label below the bar.
❌ Bearish absorption confirmed → Red label above the bar.
Each label represents a potential reversal setup after orderflow absorption is validated.
🔹 Alerts
Built-in alerts are included for both bullish and bearish confirmations, so you can track setups in real-time without watching the chart 24/7.
📌 How to Use:
Best applied at key levels (supply/demand, VWAP, OR, liquidity zones).
Look for confluence with your trading strategy before taking entries.
Works on all markets and timeframes where volume is reliable.

BitLogic Divergence SuiteRegular & hidden divergences on price using RSI or MACD histogram—non-repainting on pivot confirmation.
What it does
Detects bearish/bullish regular divergences (reversal risk).
Detects hidden divergences (continuation bias).
Marks signals on the price chart with labels; optional dashed connector lines.
Alerts for all four divergence types.
Non-repainting: signals confirm after the right pivot forms (rb bars).
How it works
Finds swing highs/lows on price and on the selected oscillator (RSI or MACD hist).
Compares the latest two pivots to classify divergence (HH vs LH, LL vs HL, etc.).
Uses offset=-rb so labels appear on the actual pivot bar once confirmed.
Inputs (key)
Oscillator: RSI (len) or MACD (fast/slow/signal).
Pivots: lb (left) & rb (right) control swing size/confirmation.
Hidden divergences toggle.
Visuals: show labels, draw lines, limit max objects.
Alerts: optional confirm on close to avoid intrabar flicker.
Usage tips
Intraday: try lb=3–5, rb=3–5. Higher TF: lb=8–12, rb=8–12.
Pair with BitLogic EMA Fusion (trend filter): take bullish divs mainly in bull regimes, and vice versa.
Consider adding structure confirmation (break of swing, volume).
Alerts included
Bearish Regular • Bullish Regular • Hidden Bearish • Hidden Bullish
Notes
No financial advice. Educational use only. Trading involves risk.
Signals confirm after rb bars and do not repaint once printed.

T-Virus Sentiment [hapharmonic]🧬 T-Virus Sentiment: Visualize the Market's DNA
Remember the iconic T-Virus vial from the first Resident Evil? That powerful, swirling helix of potential has always fascinated me. It sparked an idea: what if we could visualize the market's underlying health in a similar way? What if we could capture the "genetic code" of market sentiment and contain it within a dynamic, 3D indicator? This project is the result of that idea, brought to life with Pine Script.
The indicator's main goal is to measure the strength and direction of market sentiment by analyzing the "genetic code" of price action through a variety of trusted indicators. The result is displayed as a liquid level within a DNA helix, a bubble density representing buying pressure, and a T-Virus mascot that reflects the overall mood.
🧐 Core Concept: How It Works
The primary output of the indicator is the "Active %" gauge you see on the right side of the vial. This percentage represents the overall sentiment score, calculated as an average from 7 different technical analysis tools. Each tool is analyzed on every bar and assigned a score from 1 (strong bearish pressure) to 5 (strong bullish potential).
In this indicator, we re-imagine market dynamics through the lens of a viral outbreak. A strong bear market is like a virus taking hold, pulling all technical signals down into a state of weakness. Conversely, a powerful bull market is like an antiviral serum ; positive signals rise and spread toward the top of the vial, indicating that the system is being injected with strength.
This is not just another line on a chart. It's a comprehensive sentiment dashboard designed to give an immediate, at-a-glance understanding of the confluence between 7 classic technical indicators. The incredible 3D model of the vial itself was inspired by a design concept found here .
⚛️ The 4 Core Elements of T-Virus Sentiment
These four elements work in harmony to give a complete, multi-faceted picture of market sentiment. Each component tells a different part of the story.
The Virus Mascot: An instant emotional cue. This character provides the quickest possible read on the overall market mood, combining sentiment with volume pressure.
The Antiviral Serum Level: The main quantitative output. This is the liquid level in the DNA helix and the percentage gauge on the right, representing the average sentiment score from all 7 indicators.
Buy Pressure & Bubble Density: This visualizes volume flow. The density of bubbles represents the intensity of accumulation (buying) versus distribution (selling). It's the "power" behind the move.
The Signal Distribution: This shows the confluence (or dispersion) of sentiment. Are all signals bullish and clustered at the top, or are they scattered, indicating a conflicted market? The position of the indicator labels is crucial, as each is assigned to one of five distinct zones:
Base Bottom: The market is at its weakest. Signals here suggest strong bearish control and distribution.
Lower Zone: The market is still bearish, but signals may be showing early signs of accumulation or bottoming.
Neutral Core (Center): A state of balance or sideways consolidation. The market is waiting for a new direction.
Upper Zone: Bullish momentum is becoming clear. Signals are strengthening and showing bullish control.
Top Cap: The market is "heating up" with strong bullish sentiment, potentially nearing overbought conditions.
🐂🐻 The Virus Mascot: The At-a-Glance Indicator
This character acts as a shortcut to confirm market health. It combines the sentiment score with volume, preventing false confidence in a low-volume rally.
Its state is determined by a dual-check: the overall "Antiviral Serum Level" and the "Buy Pressure" must both be above 50%.
Green & Smiling: The 'all clear' signal. This means that not only is the overall technical sentiment bullish, but it's also being supported by real buying pressure. This is a sign of a healthy bull market.
Red & Angry: A warning sign. This appears if either the sentiment is weak, or a bullish sentiment is not being confirmed by buying volume. The latter could indicate a potential "bull trap" or an exhaustive move.
This mascot can be disabled from the settings page under "Virus Mascot Styling" if a cleaner look is preferred.
🫧 Bubble Density: Gauging Buy vs. Sell Pressure
The bubbles visualize the battle between buyers and sellers. There are two modes to control how this is calculated:
Mode 1: Visible Range (The 'Big Picture' View)
This default mode is best for getting a broad, contextual understanding of the current session. It dynamically analyzes the volume of every single candlestick currently visible on the screen to calculate the buy/sell pressure ratio. It answers the question: "Over the entire period I'm looking at, who is in control?" As you zoom in or out, the calculation adapts.
Mode 2: Custom Lookback (The 'Precision' View)
This mode is for traders who need to analyze short-term pressure. You can define a fixed number of recent bars to analyze, which is perfect for scalping or understanding the volume dynamics leading into a key level. It answers the question: "What is happening right now ?" In the example above, a lookback of 2 focuses only on the most recent action, clearly showing intense, immediate selling pressure (few bubbles) and a corresponding drop in the sentiment score to 29%.
ℹ️ Interactive Tooltips: Dive Deeper
We believe in transparency, not 'black box' indicators. This feature transforms the indicator from a visual aid into an active learning tool.
Simply hover the mouse over any indicator label (like EMA, OBV, etc.) to get a detailed tooltip. It will explain the specific data points and thresholds that signal met to be placed in its current zone. This helps build trust in the signals and allows users to fine-tune the indicator settings to better match their own trading style.
🎯 The Scoring Logic Breakdown
The "Antiviral Serum Level" gauge is the average score from 7 technical analysis tools. Each is graded on a 5-point scale (1=Strong Bearish to 5=Strong Bullish). Here’s a detailed, transparent look at how each "gene" is evaluated:
Relative Strength Index (RSI)
Measures momentum and overbought/oversold conditions.
Group 1 (Strong Bearish): RSI > 80 (Extreme Overbought)
Group 2 (Bearish): 70 < RSI ≤ 80 (Overbought)
Group 3 (Neutral): 30 ≤ RSI ≤ 70
Group 4 (Bullish): 20 ≤ RSI < 30 (Oversold)
Group 5 (Strong Bullish): RSI < 20 (Extreme Oversold)
Exponential Moving Averages (EMA)
Evaluates the trend's strength and structure based on the alignment of multiple EMAs (9, 21, 50, 100, 200, 250).
Group 1 (Strong Bearish): A perfect bearish sequence (9 < 21 < 50 < ...)
Group 2 (Bearish Transition): Early signs of a potential reversal (e.g., 9 > 21 but still below 50)
Group 3 (Neutral / Mixed): MAs are intertwined or showing a partial bullish sequence.
Group 4 (Bullish): A strong bullish sequence is forming (e.g., 9 > 21 > 50 > 100)
Group 5 (Strong Bullish): A perfect bullish sequence (9 > 21 > 50 > 100 > 200 > 250)
Moving Average Convergence Divergence (MACD)
Analyzes the relationship between two moving averages to gauge momentum.
Group 1 (Strong Bearish): MACD & Histogram are negative and momentum is falling.
Group 2 (Weakening Bearish): MACD is negative but the histogram is rising or positive.
Group 3 (Neutral / Crossover): A crossover event is occurring near the zero line.
Group 4 (Bullish): MACD & Histogram are positive.
Group 5 (Strong Bullish): MACD & Histogram are positive, rising strongly, and accelerating.
Average Directional Index (ADX)
Measures trend strength, not direction. The score is based on both ADX value and the dominance of DI+ vs DI-.
Group 1 (Bearish / No Trend): ADX < 20 and DI- is dominant.
Group 2 (Developing Bearish Trend): 20 ≤ ADX < 25 and DI- is dominant.
Group 3 (Neutral / Indecision): Trend is weak or DI+ and DI- are nearly equal.
Group 4 (Developing Bullish Trend): 25 ≤ ADX ≤ 40 and DI+ is dominant.
Group 5 (Strong Bullish Trend): ADX > 40 and DI+ is dominant.
Ichimoku Cloud (IKH)
A comprehensive indicator that defines support/resistance, momentum, and trend direction.
Group 1 (Strong Bearish): Price is below the Kumo, Tenkan < Kijun, and Chikou is below price.
Group 2 (Bearish): Price is inside or below the Kumo, with mixed secondary signals.
Group 3 (Neutral / Ranging): Price is inside the Kumo, often with a Tenkan/Kijun cross.
Group 4 (Bullish): Price is above the Kumo with strong primary signals.
Group 5 (Strong Bullish): All signals are aligned bullishly: price above Kumo, bullish Tenkan/Kijun cross, bullish future Kumo, and Chikou above price.
Bollinger Bands (BB)
Measures volatility and relative price levels.
Group 1 (Strong Bearish): Price is below the lower band.
Group 2 (Bearish Territory): Price is between the lower band and the basis line.
Group 3 (Neutral): Price is hovering around the basis line.
Group 4 (Bullish Territory): Price is between the basis line and the upper band.
Group 5 (Strong Bullish): Price is above the upper band.
On-Balance Volume (OBV)
Uses volume flow to predict price changes. The score is based on OBV's trend and its position relative to its moving average.
Group 1 (Strong Bearish): OBV is below its MA and falling.
Group 2 (Weakening Bearish): OBV is below its MA but showing signs of rising.
Group 3 (Neutral): OBV is very close to its MA.
Group 4 (Bullish): OBV is above its MA and rising.
Group 5 (Strong Bullish): OBV is above its MA, rising strongly, and showing signs of a volume spike.
🧭 How to Use the T-Virus Sentiment Indicator
IMPORTANT: This indicator is a sentiment dashboard , not a direct buy/sell signal generator. Its strength lies in showing confluence and providing a quick, holistic view of the market's technical health.
Confirmation Tool: Use the "Active %" gauge to confirm a trade setup from your primary strategy. For example, if you see a bullish chart pattern, a high and rising sentiment score can add confidence to your trade.
Momentum & Trend Gauge: A consistently high score (e.g., > 75%) suggests strong, established bullish momentum. A consistently low score (< 25%) suggests strong bearish control. A score hovering around 50% often indicates a ranging or indecisive market.
Divergence & Warning System: Pay attention to divergences. If the price is making new highs but the sentiment score is failing to follow or is actively decreasing, it could be an early warning sign that the underlying momentum is weakening.
⚙️ Settings & Customization
The indicator is highly customizable to fit any trading style.
Position & Anchor: Control where the vial appears on the chart.
Styling (Vial, Helix, etc.): Nearly every visual element can be color-customized.
Signals: This is where the real power is. All underlying indicator parameters (RSI length, MACD settings, etc.) can be fine-tuned to match a personal strategy. The text labels can also be disabled if the chart feels cluttered.
Enjoy visualizing the market's DNA with the T-Virus Sentiment indicator

Guitar Hero [theUltimator5]The Guitar Hero indicator transforms traditional oscillator signals into a visually engaging, game-like display reminiscent of the popular Guitar Hero video game. Instead of standard line plots, this indicator presents oscillator values as colored segments or blocks, making it easier to quickly identify market conditions at a glance.
Choose from 8 different technical oscillators:
RSI (Relative Strength Index)
Stochastic %K
Stochastic %D
Williams %R
CCI (Commodity Channel Index)
MFI (Money Flow Index)
TSI (True Strength Index)
Ultimate Oscillator
Visual Display Modes
1) Boxes Mode : Creates distinct rectangular boxes for each bar, providing a clean, segmented appearance. (default)
This visual display is limited by the amount of box plots that TradingView allows on each indictor, so it will only plot a limited history. If you want to view a similar visual display that has minor breaks between boxes, then use the fill mode.
2) Fill Mode : Uses filled areas between plot boundaries.
Use this mode when you want to view the plots further back in history without the strict drawing limitations.
Five-Level Color-Coded System
The indicator normalizes all oscillator values to a 0-100 scale and categorizes them into five distinct levels:
Level 1 (Red): Very Oversold (0-19)
Level 2 (Orange): Oversold (20-29)
Level 3 (Yellow): Neutral (30-70)
Level 4 (Aqua): Overbought (71-80)
Level 5 (Lime): Very Overbought (81-100)
Customization Options
Signal Parameters
Signal Length: Primary period for oscillator calculation (default: 14)
Signal Length 2: Secondary period for Stochastic %D and TSI (default: 3)
Signal Length 3: Tertiary period for TSI calculation (default: 25)
Display Controls
Show Horizontal Reference Lines: Toggle grid lines for better level identification
Show Information Table: Display current signal type, value, and normalized value
Table Position: Choose from 9 different screen positions for the info table
Display Mode: Switch between Boxes and Fills visualization
Max Bars to Display: Control how many historical bars to show (50-450 range)
Normalization Process
The indicator automatically normalizes different oscillator ranges to a consistent 0-100 scale:
Williams %R: Converts from -100/0 range to 0-100
CCI: Maps typical -300/+300 range to 0-100
TSI: Transforms -100/+100 range to 0-100
Other oscillators: Already use 0-100 scale (RSI, Stochastic, MFI, Ultimate Oscillator)
This was designed as an educational tool
The gamified approach makes learning about oscillators more engaging for new traders.

Smart Money SignalsSmart Money Signals – Market Flow & Structure Visualizer
Overview
Smart Money Signals is a precision trading tool designed for traders who want to see market structure and momentum flow in real time. By detecting pivots, momentum imbalances, and dynamic support/resistance levels, the indicator transforms raw price action into a clear visual narrative of where capital is entering and exiting the market.
Instead of lagging averages or cluttered signals, Smart Money Signals highlights the moments that matter most—where bullish and bearish flows are confirmed, where support or resistance breaks, and where momentum zones show the true battleground between buyers and sellers. Its adaptive design makes it equally effective for scalpers seeking sharp entries, swing traders tracking reversals, and longer-term traders looking for confirmation of bias.
How It Works
The engine behind Smart Money Signals relies on swing detection and a configurable sensitivity filter. By monitoring directional momentum across recent bars, the system identifies bullish pivots (where downside exhaustion flips into strength) and bearish pivots (where upward thrust collapses into weakness).
When price confirms a pivot, the indicator draws flow lines to mark the breakout and labels them as either continuation or reversal events, depending on existing market bias. Momentum zones are automatically plotted, highlighting the critical areas where buyers defended price or sellers pressed it lower.
Dynamic support and resistance levels extend forward in time, updating live as price develops. These zones change color when broken, visually signaling whether structure has held or failed. Gradient background shading further emphasizes moments of extreme momentum, such as overbought or oversold surges, so that traders instantly see when market pressure intensifies.
Signals and Market Flows
Smart Money Signals provides visual cues that are both intuitive and actionable:
📈 Bullish Flow Signals appear when price breaks above a confirmed pivot, signaling continuation or reversal into strength.
📉 Bearish Flow Signals appear when price breaks below a confirmed pivot, indicating continuation or reversal into weakness.
Momentum Zones highlight the defended areas between pivots, giving traders a visual map of where structure is strongest.
Dynamic Support & Resistance lines extend across the chart, shifting from defense to failure when broken, ensuring that the most relevant levels are always visible.
Break Signals mark the exact bar where key levels give way, confirming structural violations in real time.
By filtering out noise and focusing on meaningful flow events, the system helps traders avoid overreaction and focus only on high-probability structural shifts.
Strategy Integration
Smart Money Signals is versatile across trading styles:
Trend Continuation : Enter in the direction of flow signals, using dynamic zones as both confirmation and stop-loss placement.
Reversal Trading : Watch for pivots tagged as reversal points, where market bias flips and new structure is created.
Momentum Zone Entries : Use the automatically drawn zones to identify low-risk entries on pullbacks or retests.
Bias Alignment : The integrated dashboard reveals the current market bias—bullish, bearish, or neutral—helping traders stay aligned with the dominant flow.
Stop-losses can be positioned beyond the dynamic zone on the opposite side, while take-profits may be guided by the width of zones or momentum-driven extensions. On higher timeframes, the indicator provides context for macro structure, while lower timeframes allow for tactical entry refinement.
Advanced Techniques
Traders seeking deeper precision can combine Smart Money Signals with volume or order flow tools to validate pivots and zone defenses. Monitoring the sequence of bullish and bearish flows helps identify trend maturity, while analyzing the success rate of pivots in the analytics panel builds a data-driven approach to confidence in signals.
Adjusting swing period and sensitivity allows the indicator to adapt to different market conditions, from volatile crypto pairs to steady forex majors. The flexible visual themes—Cyber, Ocean, Sunset, Matrix—ensure readability across setups, while gradient shading keeps the chart intuitive even under fast-moving conditions.
Why Use Smart Money Signals
Markets are driven by liquidity, momentum, and structure. Smart Money Signals uncovers these forces by translating price action into a clear visual map of flow. It shows:
Where structure was built.
Where it was defended.
Where it was broken.
And where momentum is likely to carry next.
By combining flow detection, dynamic zones, and a live analytics dashboard, the indicator provides traders with a complete framework for reading price action in real time.
Whether you trade crypto, forex, or indices, Smart Money Signals adapts seamlessly to any asset class, giving you clarity, precision, and confidence to execute without second-guessing.

Bullish Breakaway Dual Session-Publish-Consolidated FVG
Inspired by the FVG Concept:
This indicator is built on the Fair Value Gap (FVG) concept, with a focus on Consolidated FVG. Unlike traditional FVGs, this version only works within a defined session (e.g., ETH 18:00–17:00 or RTH 09:30–16:00).
Bullish consolidated FVG & Bullish breakaway candle
Begins when a new intraday low is printed. After that, the indicator searches for the 1st bullish breakaway candle, which must have its low above the high of the intraday low candle. Any candles in between are part of the consolidated FVG zone. Once the 1st breakaway forms, the indicator will shades the candle’s range (high to low). Then it will use this candle as an anchor to search for the 2nd, 3rd, etc. breakaways until the session ends.
Session Reset: Occurs at session close.
Repaint Behavior:
If a new intraday (or intra-session) low forms, earlier breakaway patterns are wiped, and the system restarts from the new low.
Counter:
A session-based counter at the top of the chart displays how many bullish consolidated FVGs have formed.
Settings
• Session Setup:
Choose ETH, RTH, or custom session. The indicator is designed for CME futures in New York timezone, but can be adjusted for other markets.
If nothing appears on your chart, check if you loaded it during an inactive session (e.g., weekend/Friday night).
• Max Zones to Show:
Default = 3 (recommended). You can increase, but 3 zones are usually most useful.
• Timeframe:
Best on 1m, 5m, or 15m. (If session range is big, try higher time frame)
Usage
1. Avoid Trading in Wrong Direction
• No bullish breakaway = No long trade.
• Prevents the temptation to countertrade in strong downtrends.
2. Catch the Trend Reversal
• When a bullish breakaway appears after an intraday low, it signals a potential reversal.
• You will need adjust position sizing, watch out liquidity hunt, and place stop loss.
• Best entries of your preferred choices: (this is your own trading edge)
Retest
Breakout
Engulf
MA cross over
Whatever your favorite approach
• Reversal signal is the strongest when price stays within/above the breakaway candle’s
range. Weak if it breaks below.
3. Higher Timeframe Confirmation
• 1m can give false reversals if new lows keep forming.
• 5m often provides cleaner signals and avoids premature reversals.
Failed Trade Example:
This indicator will repaint if a new intraday session low is updated. So it is possible to have a failed trade. Here is an example from the same session in 1m chart. However, if you enter the trade later at another bullish breakaway candle signal. The loss can be mitigated by the profit.
Therefore you should use smaller position size for your 1st trade. You should also considering using 5m chart to avoid 1m bull trap. In this example, if you use 5m chart, you can totally avoid this failed trade.
If you enter the trade, you will see the intraday low is stop loss hunted. You can also see the 1st bullish breakaway candle is super weak. There are a lot of candles below the breakaway candle low, so it is very possible to fail.
In the next chart, you can see the failed traded get stop loss hunted. However you can enter another trade with huge profit to win back the loss from the 1st trade if you follow the rule.
Summary
This indicator offers 3 main advantages:
1. Prevents wrong-direction trades.
2. Confirms trend entry after reversal signals.
3. Filters false positives using higher timeframes.
How to sharp your edge:
1. ⏳Extreme patience⏳: Do not guess the bottom during a downtrend before a confirmed bullish breakaway candle. If you get caught, have the courage to cut loss. This is literally the most important usage of this indicator. Again, this is the most important rule of this indicator and actually the hardest rule to follow.
2. 🛎Better Entry🛎: After a confirmed bullish breakaway, you will always have a good opportunity to enter the trade using established trading technique. Your edge will come from the position size, draw down, stop loss placement, risk/reward ratio.
3. ✂Cut loss fast✂: If you enter a trade according to the rule, but you are still not making profit for a period of time, and the price is below the low of the breakaway candle. It is very likely you may hit stop loss soon (intraday session low). It won't be a bad idea to cut loss before stop loss hit.
4. 🔂Reentry with confidence after stop loss🔂: a stop loss will not invalidate the indicator. If you see a second chance to reenter, you should still follow the trade guide and rule.
5. 🕔Time frame matter🕔: try 1m, 3m, 5m, 10m, 15m time frame. Over time, you should know what time frame work best for you and the market. Higher time frame will reduce the noise of false positive trade, but it comes with a higher stop loss placement and less max profit, however it may come with a lower draw down. Time frame will matter depending on the range of the session. If the session range is small (<0.5%), lower time frame is good. If session range is big (>1%), 5m time frame is better. Remember to wait for candle to close, if you use higher time frame.
Last Mention:
The indicator is only used for bullish side trading.

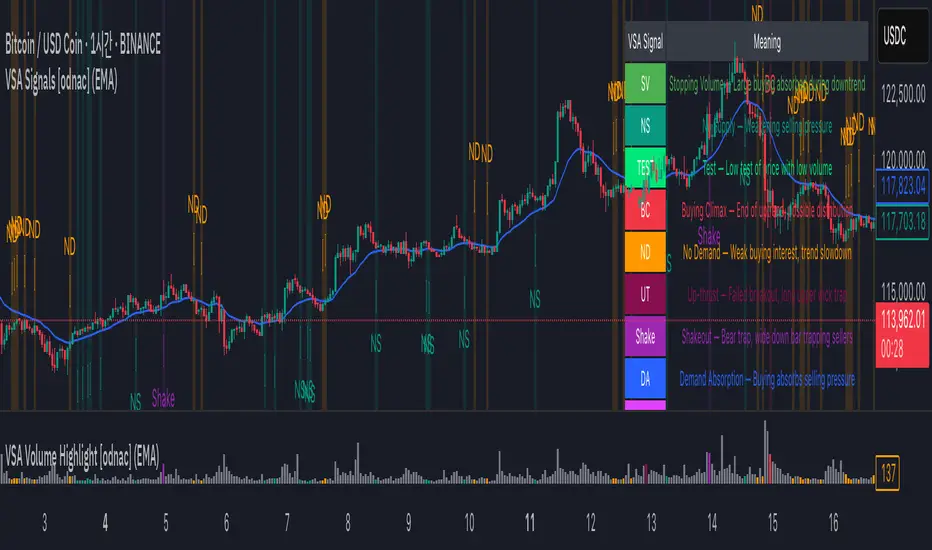
VSA Signals [odnac]This indicator applies Volume Spread Analysis (VSA) concepts to highlight important supply and demand events directly on the chart. It automatically detects common VSA patterns using price spread, relative volume, and candle structure, with optional trend filtering for higher accuracy.
Features:
Stopping Volume (SV): Signals potential end of a downtrend when heavy buying appears.
Buying Climax (BC): Indicates exhaustion of an uptrend with heavy volume near the top.
No Supply (NS): Weak selling pressure, often a bullish sign in an uptrend.
No Demand (ND): Weak buying interest, often a bearish sign in a downtrend.
Test: Low-volume test bar probing for supply.
Up-thrust (UT): Failed breakout with long upper wick, often a bearish trap.
Shakeout: Bear trap with high-volume wide down bar closing low.
Demand Absorption (DA): Demand absorbing heavy selling pressure.
Supply Absorption (SA): Supply absorbing heavy buying pressure.
Additional Options:
Background highlights for detected signals.
Configurable moving average (SMA, EMA, WMA, VWMA) as a trend filter.
Adjustable multipliers for volume and spread sensitivity.
Legend table for quick reference of signals and meanings.
Alerts available for all signals.
This tool is designed to help traders spot professional accumulation and distribution activity and to improve trade timing by recognizing supply/demand imbalances in the market.
StdDev Supply/Demand Zone RefinerThis indicator uses standard deviation bands to identify statistically significant price extremes, then validates these levels through volume analysis and market structure. It employs a proprietary "Zone Refinement" technique that dynamically adjusts zones based on price interaction and volume concentration, creating increasingly precise support/resistance areas.
Key Features:
Statistical Extremes Detection: Identifies when price reaches 2+ standard deviations from mean
Volume-Weighted Zone Creation: Only creates zones at extremes with abnormal volume
Dynamic Zone Refinement: Automatically tightens zones based on touch points and volume nodes
Point of Control (POC) Identification: Finds the exact price with maximum volume within each zone
Volume Profile Visualization: Shows horizontal volume distribution to identify key liquidity levels
Multi-Factor Validation: Combines volume imbalance, zone strength, and touch count metrics
Unlike traditional support/resistance indicators that use arbitrary levels, this system:
Self-adjusts based on market volatility (standard deviation)
Refines zones through machine-learning-like feedback from price touches
Weights by volume to show where real money was positioned
Tracks zone decay - older, untested zones automatically fade

SmartPlusSmartPlus
Overview
The SmartPlus indicator is a complete framework for intraday traders. It combines key market reference points (VWAP, moving averages, and the first 15-minute high/low range) with predictive levels based on historical daily moves. Together, these elements allow traders to build directional bias, spot breakouts, and manage risk throughout the session.
Key Features
1. VWAP (Volume-Weighted Average Price)
- Plots the intraday VWAP in real time.
- VWAP acts as a central “fair value” reference point for institutional order flow.
- Price trading above VWAP generally suggests bullish bias, while below VWAP leans bearish.
2. Exponential Moving Averages (EMAs)
- Two configurable EMAs are included:
- Fast EMA (default: 21 periods)
- Slow EMA (default: 34 periods)
- Each EMA is plotted with a single, user-selectable color for clarity.
- Crossovers or alignment between price, VWAP, and EMAs help define market structure.
3. Smart Bar Coloring
- Candles automatically change color when conditions align:
- Bull Zone: Price above VWAP, Fast EMA, and Slow EMA.
- Bear Zone: Price below VWAP, Fast EMA, and Slow EMA.
- Fluorescent bar coloring helps highlight momentum zones visually without additional analysis.
4. First 15-Minute High/Low/Mid (Automatic)
- Automatically detects the first 15 minutes of each new trading day (no manual input required).
- Plots horizontal lines for:
- First 15-Minute High (green)
- First 15-Minute Low (red)
- Midpoint of that range (gray)
- Once the initial 15-minute window ends, these levels remain projected throughout the session as breakout or support/resistance zones.
- Alerts trigger when price breaks above the high or below the low after the window.
5. Daily Support/Resistance Forecast
- Uses a rolling lookback of recent daily ranges (default: 126 days).
- Tracks average up moves and down moves from the daily open.
- Optionally incorporates standard deviation for wider confidence bands.
- Plots forecast levels above/below the current day’s open for reference.
Trading Logic (How to Use)
- Bullish Bias:
- Price is above VWAP, above both EMAs, and ideally above the first 15-minute high.
- This setup suggests trend continuation or breakout opportunities on the long side.
- Bearish Bias:
- Price is below VWAP, below both EMAs, and ideally below the first 15-minute low.
- This setup suggests downward pressure or breakout opportunities on the short side.
- Neutral / Caution Zone:
- Price caught between VWAP, EMAs, or inside the 15-minute range often signals indecision.
- Best to wait for confirmation or breakout before committing to trades.
Expectations After Using It
- The script provides context and structure, not trading signals.
- It highlights where price is relative to meaningful market levels so traders can act with greater confidence.
- Combining VWAP, EMAs, and the 15-minute breakout framework helps traders stay aligned with the market’s natural rhythm.
Disclaimer
This script is a tool for market analysis and educational purposes only.
It does not constitute financial advice, trading recommendations, or guaranteed profitability.
Markets are inherently risky, and past patterns do not ensure future results.
Always combine this tool with sound risk management, personal research, and professional guidance before making any trading decisions.

FluidFlow OscillatorFluidFlow Oscillator: Study Material for Traders
Overview
The FluidFlow Oscillator is a custom technical indicator designed to measure price momentum and market flow dynamics by simulating fluid motion concepts such as velocity, viscosity, and turbulence. It helps traders identify potential buy and sell signals along with trend strength, momentum direction, and volatility conditions.
This study explains the underlying calculation concepts, signal logic, visual cues, and how to interpret the professional dashboard table that summarizes key indicator readings.
________________________________________
How the FluidFlow Oscillator Works
Core Mechanisms
1. Price Flow Velocity
o Measures the rate of change of price over a specified flow length (default 40 bars).
o Calculated as a percentage change of closing price: roc=close−closelen_flowcloselen_flow×100\text{roc} = \frac{\text{close} - \text{close}_{len\_flow}}{\text{close}_{len\_flow}} \times 100roc=closelen_flowclose−closelen_flow×100
o Smoothed by an EMA (Exponential Moving Average) to reduce noise, generating a "flow velocity" value.
2. Viscosity Factor
o Analogous to fluid viscosity, it adjusts the flow velocity based on recent price volatility.
o Volatility is computed as the standard deviation of close prices over the flow length.
o The viscosity acts as a damping factor to slow down the flow velocity in highly volatile conditions.
o This results in a "flow with viscosity" value, that smooths out the velocity considering market turbulence.
3. Turbulence Burst
o Captures sudden changes or bursts in the flow by measuring changes between successive viscosity-adjusted flows.
o The turbulence value is a smoothed absolute change in flow.
o A burst boost factor is added to the oscillator to incorporate this rapid change component, amplifying signals during sudden shifts.
4. Oscillator Calculation
o The raw oscillator value is the sum of flow with viscosity plus burst boost, scaled by 10.
o Clamped between -100 and +100 to limit extremes.
o Finally, smoothed again by EMA for cleaner visualization.
________________________________________
Signal Logic
The oscillator works with complementary components to produce actionable signals:
• Signal Line: An EMA-smoothed version of the oscillator for generating crossover-based signals.
• Momentum: The rate of change of the oscillator itself, smoothed by EMA.
• Trend: Uses fast (21-period EMA) and slow (50-period EMA) moving averages of price to identify market trend direction (uptrend, downtrend, or sideways).
Signal Conditions
• Bullish Signal (Buy): Oscillator crosses above the oversold threshold with positive momentum.
• Bearish Signal (Sell): Oscillator crosses below the overbought threshold with negative momentum.
Statuses
The oscillator provides descriptive market states based on level and momentum:
• Overbought
• Oversold
• Buy Signal
• Sell Signal
• Bullish / Bearish (momentum-driven)
• Neutral (no clear trend)
________________________________________
Color System and Visualization
The oscillator uses a sophisticated HSV color model adapting hues according to:
• Oscillator value magnitude and sign (positive or negative)
• Acceleration of oscillator changes
• Smooth color gradients to facilitate intuitive understanding of trend strength and momentum shifts
Background colors highlight overbought (red tint) and oversold (green tint) zones with transparency.
________________________________________
How to Understand the Professional Dashboard Table
The FluidFlow Oscillator offers an integrated table at the bottom center of the chart. This dashboard summarizes critical indicator readings in 8 columns across 3 rows:
Column Description
SIGNAL Current signal status (e.g., Buy, Sell, Overbought) with color coding
OSCILLATOR Current oscillator value (-100 to +100) with color reflecting intensity and direction
MOMENTUM Momentum bias indicating strength/direction of oscillator changes (Strong Up, Up, Sideways, Down, Strong Down)
TREND Current trend status based on EMAs (Strong Uptrend, Uptrend, Sideways, Downtrend, Strong Downtrend)
VOLATILITY Volatility percentage relative to average, indicating market activity level
FLOW Flow velocity value describing price momentum magnitude and direction
TURBULENCE Turbulence level indicating sudden bursts or spikes in price movement
PROGRESS Oscillator's position mapped as a percentage (0% to 100%) showing proximity to extreme levels
Rows Explained
• Row 1 (Header): Labels for each metric.
• Row 2 (Values): Current numerical or descriptive values color-coded along a professional scheme:
o Green or lime tones indicate positive or bullish conditions.
o Red or orange tones indicate caution, sell signals, or bearish conditions.
o Blue tones indicate neutral or stable conditions.
• Row 3 (Status Indicators): Emoji-like icons and bars provide a quick visual gauge of each metric's intensity or signal strength:
o For example, "🟢🟢🟢" suggests very strong bullish momentum, while "🔴🔴🔴" suggests strong bearish momentum.
o Progress bar visually demonstrates oscillator movement toward oversold or overbought extremes.
________________________________________
Practical Interpretation Tips
• A Buy signal with green colors and strong momentum usually precedes upward price moves.
• An Overbought status with red background and red table colors warns of potential price corrections or reversals.
• Watch the Turbulence to gauge market instability; spikes may precede price shocks or volatility bursts.
• Confirm signals with the Trend and Momentum columns to avoid false entries.
• Use the Progress bar to anticipate oscillations approaching key threshold levels for timing trades.
________________________________________
Alerts
The oscillator supports alerts for:
• Buy and sell signals based on oscillator crossovers.
• Overbought and oversold levels reached.
These help traders automate awareness of important market conditions.
________________________________________
Disclaimer
The FluidFlow Oscillator and its signals are for educational and informational purposes only. They do not guarantee profits and should not be considered as financial advice. Always conduct your own research and use proper risk management when trading. Past performance is not indicative of future results.
________________________________________
This detailed explanation should help you understand the workings of the FluidFlow Oscillator, its components, signal logic, and how to analyze its professional dashboard for informed trading decisions.

KAMA Trend Flip - SightLing LabsBuckle up, traders—this open-source KAMA Trend Flip indicator is your ticket to sniping trend reversals with a Kaufman Adaptive Moving Average (KAMA) that’s sharper than a Wall Street shark’s tooth. No voodoo, no fluff—just raw, volatility-adaptive math that dances with the market’s rhythm. It zips through trending rockets and chills in choppy waters, slashing false signals like a samurai. Not laggy like the others - this thing is the real deal!
Core Mechanics:
• Efficiency Ratio (ER): Reads the market’s pulse (0-1). High ER = turbo-charged MA, low ER = smooth operator.
• Adaptive Smoothing: Mixes fast (default power 2) and slow (default 30) constants to match market mood swings.
• Trend Signals: KAMA climbs = blue uptrend (bulls run wild). KAMA dips = yellow downtrend (bears take over). Flat = gray snooze-fest.
• Alerts: Instant pings on flips—“Trend Flip Up” for long plays, “Down” for shorts. Plug into bots for set-and-forget domination.
Why It Crushes:
• Smokes static MAs in volatile arenas (crypto, stocks, you name it). Backtests show 20-30% fewer fakeouts than SMA50.
• Visual Pop: Overlays price with bold blue/yellow signals. Slap it on BTC 1D to see trends light up like Times Square.
• Tweakable: Dial ER length (default 50) to your timeframe. Short for scalps, long for swing trades.
Example Settings in Action:
• 10s Chart (Hyper-Scalping): Set Source: Close, ER Length: 100, Fast Power: 1, Slow Power: 6. Catches micro-trends in crypto like a heat-seeking missile. Blue/yellow flips scream entry/exit on fast moves.
• 2m Chart (Quick Trades): Set Source: Close, ER Length: 14, Fast Power: 1, Slow Power: 6. Perfect for rapid trend shifts in stocks or forex. Signals align with momentum bursts—check historical flips for proof.
Deployment:
• Drop it on any chart. Backtest settings to match your asset’s volatility—tweak until it sings.
• Pair with RSI or volume spikes for killer confirmation. Pro move: Enter on flip + volume pop, exit on reverse.
• Strategy-Ready: Slap long/short logic on alerts to build a lean, mean trading machine.
Open source from SightLing Labs—grab it, hack it, profit from it. Share your tweaks in the comments and let’s outsmart the market together. Trade hard, win big!
Dynamic Grid Range V9 (Final)Key Features
Preset Profiles: It comes pre-programmed with our two most successful strategies: the "12/12 Profile" (Balanced Scalper) and the "8/8 Profile" (Aggressive Scalper).
Automatic Calculation: When you select a profile, the indicator automatically uses the correct proportional range percentage and grid count for whatever coin you are viewing. No manual math is needed.
Custom Flexibility: It still includes a "Custom" option in the dropdown, allowing you to manually input any range percentage and grid count for full control.
All Previous Upgrades: It includes all our prior upgrades, such as dynamic lines that don't clutter the chart, price labels on the right, and fully customizable line styles.
It’s our complete, all-in-one strategic tool.

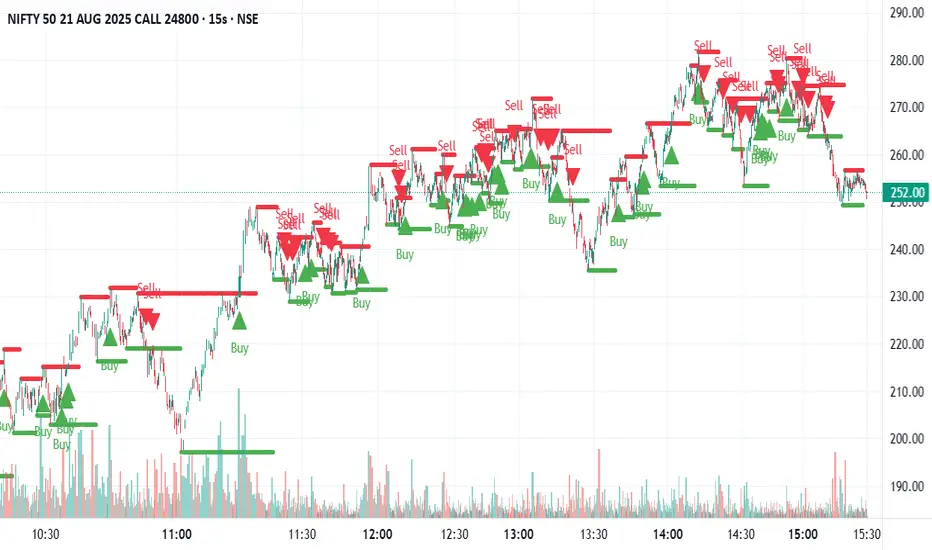
Swing Support and Resistance [Vijay]Swing-based support & resistance with breakout buy/sell signals and alerts.
Full Description:
The Swing Support and Resistance indicator is a simple yet effective tool to identify swing-based support and resistance levels using pivot points.
Pivot Length: Defines how many bars on each side are used to confirm a swing high (resistance) or swing low (support).
Support & Resistance: Plots the most recent pivot levels as visual markers (circles) on the chart.
Buy & Sell Signals:
A Buy Signal is triggered when price crosses above the last resistance.
A Sell Signal is triggered when price crosses below the last support.
Visual Cues: Arrows are plotted directly on the chart for easy signal recognition.
Alerts: Built-in alert conditions allow you to set TradingView alerts for breakout signals.
This script is useful for traders who rely on price action, breakout trading, and swing structure analysis. It helps quickly spot where price is breaking key levels and provides instant alerts for trade opportunities.
ICT Structure Levels (ST/IT/LT) - v7 (by Jonas E)ICT Structure Levels (ST/IT/LT) – Neighbor-Wick Pivots
This indicator is designed for traders following ICT-style market structure analysis. It identifies Short-Term (ST), Intermediary (IT), and Long-Term (LT) swing highs and lows, but with a stricter filter that reduces false signals.
Unlike standard pivot indicators, this script requires not only that a bar makes a structural high/low, but also that the neighboring bars’ extremes are formed by wicks rather than flat-bodied candles. This wick condition helps confirm that the level is a true liquidity sweep and not just random price action.
How it works (conceptual):
Detects pivots based on user-defined left/right bars.
Validates that extremes on both sides of the pivot are wick-driven (high > body for highs, low < body for lows).
Marks valid STH/STL, ITH/ITL, and LTH/LTL directly on the chart with optional price labels.
Uses ATR offset for better label readability.
Alerts can be enabled to notify when a new structural level is confirmed.
How to use it:
Map market structure across multiple layers (ST/IT/LT).
Identify true liquidity grabs and avoid false highs/lows.
Integrate with Break of Structure (BOS) and Change of Character (CHoCH) strategies.
Combine with other ICT concepts (Order Blocks, Fair Value Gaps, Liquidity Pools).
What makes it unique:
Most pivot indicators mark every high/low indiscriminately. This script filters pivots using wick validation, which significantly reduces noise and focuses only on the levels most relevant to liquidity-based trading strategies.

Time Based Range CandleThis indicator creates a visual candle representation from price action during a specified time period.
Key Features:
Configurable Sessions: Set any calculation period (when range is measured) and display period (when visualization appears)
Candle Visualization: Draws a large candle showing open, close, high, low with proper body coloring
Wick/Tail Analysis: Displays wicks and tails with quarter-level subdivisions based on candle type (bullish vs bearish)
End Marker: Vertical line marks exactly when the calculation period ends
Quarter Lines: Optional dotted/dashed lines showing 25%, 50%, 75% levels within body, wicks, and tails
Common Use Cases:
Overnight range analysis (18:00 - 6:00 ET) displayed during regular hours
Session-based range trading (Asian, London, NY sessions)
Custom time period analysis for any market
The indicator follows proper candle terminology where wicks and tails are measured differently for bullish vs bearish candles, making it useful for precise level analysis and range trading strategies.

STIR Rate LevelsInput the reference rate - SOFR, EURIBOR, SONIA etc - and the script will automatically label where 25,50,75,100,125 bps cuts & hikes are.
Hope this helps with your research!
- Subscribe to our substack (free): MonometricsResearch to get a full breakdown

Brent Badal Bear Den========================================
BearDen
The trader’s den for CHoCH, BoS,
and FVG setups
========================================
All-in-one Smart Money toolkit designed
for precision trading.
Features:
- Supply & Demand zones (Order Blocks)
- CHoCH and BoS structure labels + alerts
- BoC confirmation dots
- Fair Value Gaps (FVG) with auto threshold
- PDH & PDL levels with labels
- EMAs 20, 25, 200
- Price gap shading + bar coloring
- Premium & Discount zones
Signals & Alerts:
- Bullish & Bearish CHoCH
- Bullish & Bearish BoS
- MSS confirmations (displacement + FVG)
- BoC Up / Down confirmations
- SSMA cross signals
How to Use:
1) Identify bias with CHoCH/BoS + EMAs
2) Mark Supply/Demand zones & FVGs
3) Look for Premium/Discount alignment
4) Confirm with BoC or MSS
5) Manage trades at zone or FVG boundaries

ADVANCED COSINE PROJECTION SYSTEM — LITE Mark3ACPS-Lite is a projection-based tool designed to visualize potential price paths using cosine-based similarity and stability analysis.
so, i have been working over multiple iterations to have a stable projection based on cosine principles and I've settled with a few stable algorithmic frameworks which works as: what i like to call : next generation leading indicators.
This indicator works well with any charting type like line/bar/candles etc. across ALL timeframes. (including seconds).
Basically this indicator projects a path towards the right.
Based on the trend the color of the projection updates on live refresh (depends on your timeframe of choice)
GREEN path projection for possible up trend
RED for bearish and yellow for sideways trend.
Technical : This indicator Aims to solve "DIRECTION" .
The idea was to to calculate angle between any given vectors : so if we translate it into the trading world : we are trying to determine direction (simplified explanation).
Pros : Scale Independent
meaning factors like flash crash , High impact movements (like NFP's) dont impact the projection logic in terms of Magnitude.
My model focuses on pattern similarity
example : in the previous instance of similar situation how did price react ?
therefore making a similar "COSINE" projection. (based on past "vector"/event)
on the left side there will always be an highlighted box section to visually represent where the future projections are based off of.
Cons: multiple vectors can have same direction from the cosine logic : essentially rendering the projected distance inconclusive.
but i solved that problem fully but on this lite version i made use of live refresh feature to keep the projections on a float : making our right side projections that much more fluid.
finally as a psychological factor not to get caught up on any Bias i made sure the indicator switches color according to immediate trend change logi.
Best Use case : have this indicator across multiple timeframes inside Tradingvieews tabs to Help make better Judgement.
I'm open for feedback / suggestions.
regards,
drsamc.
MSS BoxesWhat it is
The MSS Boxes indicator finds Market Structure Shifts (a decisive break in structure with displacement) and draws actionable zones (“boxes”) from the candle that caused the shift. Those boxes then act as mitigation / continuation areas for the rest of the session (or until they’re invalidated). It’s designed to be clean, non-repainting, and to work as a confluence layer with your SD and ATR Trigger grids.
What you’ll see on the chart
Green boxes for bullish MSS (demand); red boxes for bearish MSS (supply).
A compact label at the box origin (e.g., BOS↑ / BOS↓, or CHOCH) with the time-frame tag if you enable MTF.
Optional status badge on the right edge:
active (untouched), mitigated (tapped and respected), invalid (closed through), expired.
Clean behavior: once a box is printed it does not slide; coordinates are fixed to the confirmed signal candle.
Inputs (quick guide)
Swing detection
Swing length (for swing highs/lows), lookback for break validity, strict wick rule on/off.
Displacement factor (0 = off; typical 1.2–2.0).
Box recipe
Use full wick vs. use body for top/bottom.
Minimum box height (ticks), auto-merge overlapping (joins adjacent boxes of the same side).
Max lifetime (bars), session reset (e.g., clear on NY 18:00).
MTF alignment
Toggle H1 / M15 filters; choose “Plot only when aligned” vs “Plot all but alert only when aligned.”
Visuals
Fill/outline colors, opacity, label size, extend style (full-width vs to last bar).
