Buy the dips StrategyThis strategy getting in long position only after the price drop- Buy the dips
The % of the drop is Determined by SMA for the first trade
The inputs of SMA and % of the drop can be adjust from the User
After that Strategy start taking safe trades if not take profit from the first trade
The safe trades are Determined by step down deviation % and by quantity
There is no Stop loss is not for one with small tolerance to getting under
if any question ask
Indicators and strategies

rj_temu_pair_tradea simple "temu" implementation of a pair trade
see robotjames.substack.com for details.

Tailwind.(BTC)Imagine the price of Bitcoin is like a person climbing a staircase.
The Steps (Grid): Instead of watching every single price movement, the strategy divides the market into fixed steps. In your configuration, each step measures **3,000 points**. (Examples: 60,000, 63,000, 66,000...).
The Signal: We buy only when the price climbs a full step decisively.
The "Expensive Price" Filter: If the price jumps the step but lands too far away (the candle closes too high), we do not buy. It is like trying to board a train that has already started moving too fast; the risk is too high.
Rigid Exits: The Take Profit (TP) and Stop Loss (SL) are calculated from the edge of the step, not from the specific price where you managed to buy. This preserves the geometric structure of the market.
The Code Logic (Step-by-Step)
A. The Math of the Grid (`math.floor`)
pinescript
level_base = math.floor(close / step_size) * step_size
This is the most important line.
What does it do? It rounds the price down to the nearest multiple of 3,000.
Example: If BTC is at 64,500 and the step size is 3,000:
1. Divide: $64,500 / 3,000 = 21.5$
2. `math.floor` (Floor): Removes the decimals $\rightarrow$ remains $21$.
3. Multiply: $21 * 3,000 = 63,000$.
Result: The code knows that the current "floor" is **63,000**, regardless of whether the price is at 63,001 or 65,999.
B. The Strict Breakout (`strict_cross`)
pinescript
strict_cross = (open < level_base) and (close > level_base)
Most strategies only check if `close > level`. We do things slightly differently:
`open < level_base`: Requires the candle to have "born" *below* the line (e.g., opened at 62,900).
`close > level_base`: Requires the candle to have *finished* above the line (e.g., closed at 63,200).
Why? This avoids entering on gaps (price jumps where the market opens already very high) and confirms that there was real buying power crossing the line.
C. The "Expensive Price" Filter (`max_dist_pct`)
pinescript
limit_price_entry = level_base + (step_size * (max_dist_pct / 100.0))
price_is_valid = close <= limit_price_entry
Here you apply the percentage rule:
-If the level is 63,000 and the next is 66,000 (a difference of 3,000).
-If `max_dist_pct` is **60%**, the limit is $63,000 + (60\% \text{ of } 3,000) = 64,800$.
-If the breakout candle closes at **65,000**, the variable `price_is_valid` will be **false** and it will not enter the trade. This avoids buying at the ceiling.
D. TP and SL Calculation (Anchored to the Level)
pinescript
take_profit = level_base + (step_size * tp_mult)
stop_loss = level_base - (step_size * sl_mult)
Note that we use `level_base` and not `close`.
-If you entered because the price broke 63,000, your SL is calculated starting from 63,000.
-If your SL is 1.0x, your stop will be exactly at 60,000.
This is crucial: If you bought "expensive" (e.g., at 63,500), your real stop is wider (3,500 points) than if you bought cheap (63,100). Because you filter out expensive entries, you protect your Risk/Reward ratio.
E. Visual Management (`var line`)
The code uses `var` variables to remember the TP and SL lines and the `line.set_x2` function to stretch them to the right while the operation remains open, providing that visual reference on the chart until the trade ends.
Workflow Summary
Strategy Parameters:
Total Capital: $20,000
We will use 10% of total capital per trade.
Commissions: 0.1% per trade.
TP: 1.4
SL: 1
Step Size (Grid): 3,000
We use the 200 EMA as a trend filter.
Feel free to experiment with the parameters to your liking. Cheers.

GOLD 5m PA ScalperXAUUSD 5-Minute Price Action Scalper with HTF Confirmation
This Pine Script is a trend-following scalping strategy designed specifically for XAUUSD (Gold) on the 1,3,5-minute timeframe.
Its main goal is to reduce noise and false signals by combining lower-timeframe price action with higher-timeframe (15-minute) structure.
CORE IDEA
Trade only in the direction of the dominant trend and only when price reacts from a strong higher-timeframe Order Block.

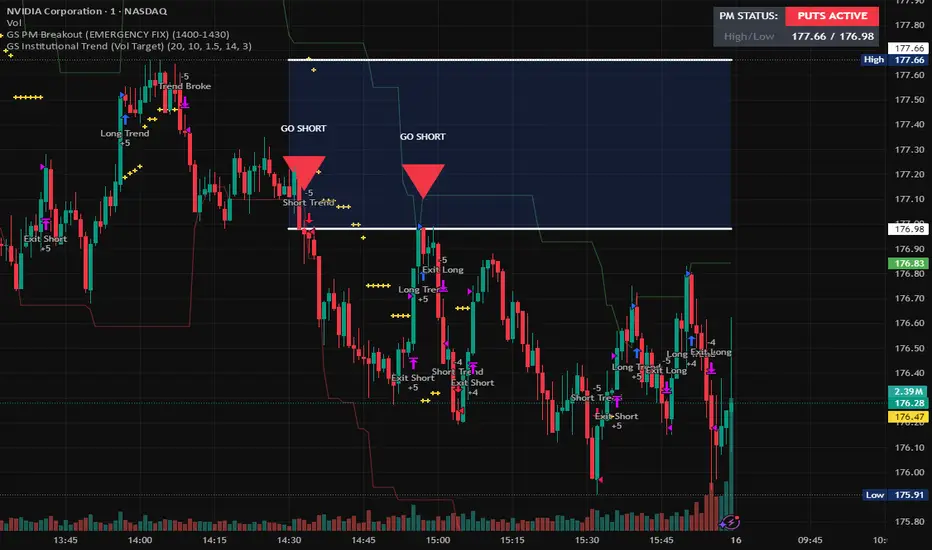
GS Institutional Trend (Vol Target)hedge fund strategy used on a 4 hour chart with a purple bar warning to signal dangerous volitilaty. this strategy will lose money in choppy sideways markets.
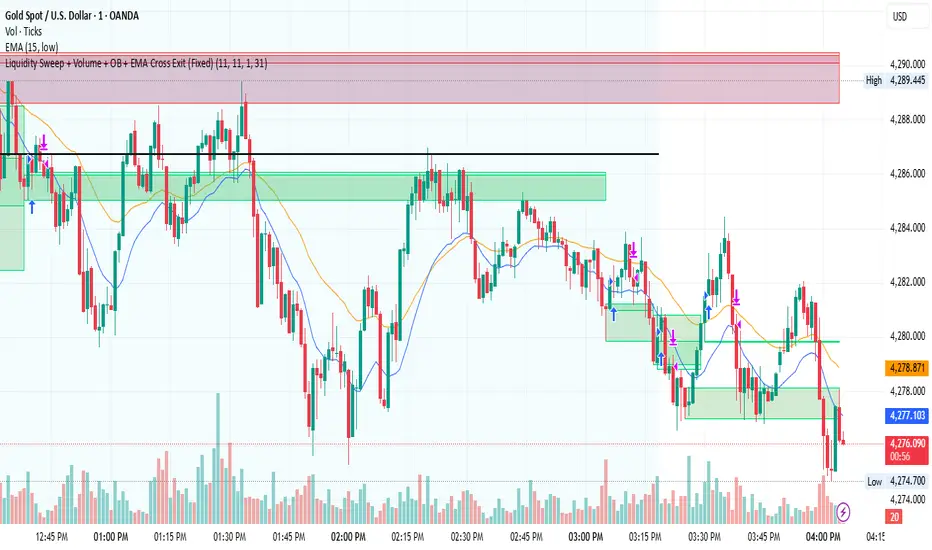
Liquidity Sweep + Volume + OB + EMA Cross Exit This strategy is a smart-money–inspired trading system designed to capture high-probability reversals after liquidity is taken from the market.
It combines liquidity sweeps, volume confirmation, order block validation, and a dynamic EMA-based exit to control risk and let profits run.
Core Concept
Institutions first take liquidity, then move price in the real direction.
This strategy aims to enter after liquidity is swept and price shows confirmation.
1️⃣ Liquidity Sweep Detection
2️⃣ Volume Confirmation
3️⃣ Order Block Identification
4️⃣ EMA Trend Filter (Optional Entry Bias)
5️⃣ Trade Entry Logic
6️⃣ Exit Strategy – EMA Cross Exit
Benefits:
Lets strong trends run
Exits automatically when momentum weakens
Adapts to different market conditions
🛡 Risk & Trade Management
One trade at a time (anti-overtrading logic)
Early exit if trade moves against position after a few bars
Opposite signal forces exit
EMA cross provides trend-based exit
Estrategia Momentum Seguro (EMS) Entry and exit signals, this indicator helps or suggests where to enter, exit, or place a stop loss.

Simple Candle Strategy# Candle Pattern Strategy - Pine Script V6
## Overview
A TradingView trading strategy script (Pine Script V6) that identifies candlestick patterns over a configurable lookback period and generates trading signals based on pattern recognition rules.
## Strategy Logic
The strategy analyzes the most recent N candlesticks (default: 5) and classifies their patterns into three categories, then generates buy/sell signals based on specific pattern combinations.
### Candlestick Pattern Classification
Each candlestick is classified as one of three types:
| Pattern | Definition | Formula |
|---------|-----------|---------|
| **Close at High** | Close price near the highest price of the candle | `(high - close) / (high - low) ≤ (1 - threshold)` |
| **Close at Low** | Close price near the lowest price of the candle | `(close - low) / (high - low) ≤ (1 - threshold)` |
| **Doji** | Opening and closing prices very close; long upper/lower wicks | `abs(close - open) / (high - low) ≤ threshold` |
### Trading Rules
| Condition | Action | Signal |
|-----------|--------|--------|
| Number of Doji candles ≥ 3 | **SKIP** - Market is too chaotic | No trade |
| "Close at High" count ≥ 2 + Last candle closes at high | **LONG** - Bullish confirmation | Buy Signal |
| "Close at Low" count ≥ 2 + Last candle closes at low | **SHORT** - Bearish confirmation | Sell Signal |
## Configuration Parameters
All parameters are adjustable in TradingView's "Settings/Inputs" tab:
| Parameter | Default | Range | Description |
|-----------|---------|-------|-------------|
| **K-line Lookback Period** | 5 | 3-20 | Number of candlesticks to analyze |
| **Doji Threshold** | 0.1 | 0.0-1.0 | Body size / Total range ratio for doji identification |
| **Doji Count Limit** | 3 | 1-10 | Number of dojis that triggers skip signal |
| **Close at High Proximity** | 0.9 | 0.5-1.0 | Required proximity to highest price (0.9 = 90%) |
| **Close at Low Proximity** | 0.9 | 0.5-1.0 | Required proximity to lowest price (0.9 = 90%) |
### Parameter Tuning Guide
#### Proximity Thresholds (Close at High/Low)
- **0.95 or higher**: Stricter - only very strong candles qualify
- **0.90 (default)**: Balanced - good for most market conditions
- **0.80 or lower**: Looser - catches more patterns, higher false signals
#### Doji Threshold
- **0.05-0.10**: Strict doji identification
- **0.10-0.15**: Standard doji detection
- **0.15+**: Includes near-doji patterns
#### Lookback Period
- **3-5 bars**: Fast, sensitive to recent patterns
- **5-10 bars**: Balanced approach
- **10-20 bars**: Slower, filters out noise
## Visual Indicators
### Chart Markers
- **Green Up Arrow** ▲: Long entry signal triggered
- **Red Down Arrow** ▼: Short entry signal triggered
- **Gray X**: Skip signal (too many dojis detected)
### Statistics Table
Located at top-right corner, displays real-time pattern counts:
- **Close at High**: Count of candles closing near the high
- **Close at Low**: Count of candles closing near the low
- **Doji**: Count of doji/near-doji patterns
### Signal Labels
- Green label: "✓ Long condition met" - below entry bar
- Red label: "✓ Short condition met" - above entry bar
- Gray label: "⊠ Too many dojis, skip" - trade skipped
## Risk Management
### Exit Strategy
The strategy includes built-in exit rules based on ATR (Average True Range):
- **Stop Loss**: ATR × 2
- **Take Profit**: ATR × 3
Example: If ATR is $10, stop loss is at -$20 and take profit is at +$30
### Position Sizing
Default: 100% of equity per trade (adjustable in strategy properties)
**Recommendation**: Reduce to 10-25% of equity for safer capital allocation
## How to Use
### 1. Copy the Script
1. Open TradingView
2. Go to Pine Script Editor
3. Create a new indicator
4. Copy the entire `candle_pattern_strategy.pine` content
5. Click "Add to Chart"
### 2. Apply to Chart
- Select your preferred timeframe (1m, 5m, 15m, 1h, 4h, 1d)
- Choose a trading symbol (stocks, forex, crypto, etc.)
- The strategy will generate signals on all historical bars and in real-time
### 3. Configure Parameters
1. Right-click the strategy on chart → "Settings"
2. Adjust parameters in the "Inputs" tab
3. Strategy will recalculate automatically
4. Backtest results appear in the Strategy Tester panel
### 4. Backtesting
1. Click "Strategy Tester" (bottom panel)
2. Set date range for historical testing
3. Review performance metrics:
- Win rate
- Profit factor
- Drawdown
- Total returns
## Key Features
✅ **Execution Model Compliant** - Follows official Pine Script V6 standards
✅ **Global Scope** - All historical references in global scope for consistency
✅ **Adjustable Sensitivity** - Fine-tune all pattern detection thresholds
✅ **Real-time Updates** - Works on both historical and real-time bars
✅ **Visual Feedback** - Clear signals with labels and statistics table
✅ **Risk Management** - Built-in ATR-based stop loss and take profit
✅ **No Repainting** - Signals remain consistent after bar closes
## Important Notes
### Before Trading Live
1. **Backtest thoroughly**: Test on at least 6-12 months of historical data
2. **Paper trading first**: Practice with simulated trades
3. **Optimize parameters**: Find the best settings for your trading instrument
4. **Manage risk**: Never risk more than 1-2% per trade
5. **Monitor performance**: Review trades regularly and adjust as needed
### Market Conditions
The strategy works best in:
- Trending markets with clear directional bias
- Range-bound markets with defined support/resistance
- Markets with moderate volatility
The strategy may underperform in:
- Highly choppy/noisy markets (many false signals)
- Markets with gaps or overnight gaps
- Low liquidity periods
### Limitations
- Works on chart timeframes only (not intrabar analysis)
- Requires at least 5 bars of history (configurable)
- Fixed exit rules may not suit all trading styles
- No trend filtering (will trade both directions)
## Technical Details
### Historical Buffer Management
The strategy declares maximum bars back to ensure enough historical data:
```pine
max_bars_back(close, 20)
max_bars_back(open, 20)
max_bars_back(high, 20)
max_bars_back(low, 20)
```
This prevents runtime errors when accessing historical candlestick data.
### Pattern Detection Algorithm
```
For each bar in lookback period:
1. Calculate (high - close) / (high - low) → close_to_high_ratio
2. If close_to_high_ratio ≤ (1 - threshold) → count as "Close at High"
3. Calculate (close - low) / (high - low) → close_to_low_ratio
4. If close_to_low_ratio ≤ (1 - threshold) → count as "Close at Low"
5. Calculate abs(close - open) / (high - low) → body_ratio
6. If body_ratio ≤ doji_threshold → count as "Doji"
Signal Generation:
7. If doji_count ≥ cross_count_limit → SKIP_SIGNAL
8. If close_at_high_count ≥ 2 AND last_close_at_high → LONG_SIGNAL
9. If close_at_low_count ≥ 2 AND last_close_at_low → SHORT_SIGNAL
```
## Example Scenarios
### Scenario 1: Bullish Signal
```
Last 5 bars pattern:
Bar 1: Closes at high (95%) ✓
Bar 2: Closes at high (92%) ✓
Bar 3: Closes at mid (50%)
Bar 4: Closes at low (10%)
Bar 5: Closes at high (96%) ✓ (last bar)
Result:
- Close at high count: 3 (≥ 2) ✓
- Last closes at high: ✓
- Doji count: 0 (< 3) ✓
→ LONG SIGNAL ✓
```
### Scenario 2: Skip Signal
```
Last 5 bars pattern:
Bar 1: Doji pattern ✓
Bar 2: Doji pattern ✓
Bar 3: Closes at mid
Bar 4: Doji pattern ✓
Bar 5: Closes at high
Result:
- Doji count: 3 (≥ 3)
→ SKIP SIGNAL - Market too chaotic
```
## Performance Optimization
### Tips for Better Results
1. **Use Higher Timeframes**: 15m or higher reduces false signals
2. **Combine with Indicators**: Add volume or trend filters
3. **Seasonal Adjustment**: Different parameters for different seasons
4. **Instrument Selection**: Test on liquid, high-volume instruments
5. **Regular Rebalancing**: Adjust parameters quarterly based on performance
## Troubleshooting
### No Signals Generated
- Check if lookback period is too large
- Verify proximity thresholds aren't too strict (try 0.85 instead of 0.95)
- Ensure doji limit allows for trading (try 4-5 instead of 3)
### Too Many False Signals
- Increase proximity thresholds to 0.95+
- Reduce lookback period to 3-4 bars
- Increase doji limit to 3-4
- Test on higher timeframes
### Strategy Tester Shows Losses
- Review individual trades to identify patterns
- Adjust stop loss and take profit ratios
- Change lookback period and thresholds
- Test on different market conditions
## References
- (www.tradingview.com)
- (www.tradingview.com)
- (www.investopedia.com)
- (www.investopedia.com)
## Disclaimer
**This strategy is provided for educational and research purposes only.**
- Not financial advice
- Past performance does not guarantee future results
- Always conduct thorough backtesting before live trading
- Trading involves significant risk of loss
- Use proper risk management and position sizing
## License
Created: December 15, 2025
Version: 1.0
---
**For updates and modifications, refer to the accompanying documentation files.**

Wavelet Candlestick Slope Follower-Master Edition Here is a short description of this script:
This is a **Trend Following strategy** that utilizes advanced mathematics—the **Wavelet Transform**—to filter out market noise.
**Key Features:**
1. **Synthetic Candles:** The script does not analyze raw prices. Instead, it constructs "Wavelet Candles"—smoothed candles created through mathematical convolution of prices with a specific wavelet "kernel" (e.g., Mexican Hat, Morlet, Haar).
2. **Auto-Correction (Normalization):** This is the most critical technical feature of this code. The script automatically normalizes the weights. This ensures that even when using complex mathematical shapes (like the Mexican Hat), the output price remains accurate to the real chart scale and is not distorted.
3. **Strategy Logic:** The logic is very straightforward—the system enters a **Long** position when the smoothed closing price (`w_close`) is rising, and closes the position when it starts to fall.
4. **Visualization:** It draws new, cleaner candles (green/red) on the chart, revealing the "true" trend structure after filtering out temporary fluctuations.
This is a example of use idea of wavelet candle

Daily Open Shift The "Daily Open Shift" System (V2.0)
1. The Setup (Indicators & Timeframe)
• Timeframe: 15-Minute Chart (Execution).
• Key Levels: Daily Open (DO) or New York Open (NYO).
• Trend Indicators:
o 24 & 42 EMA Ribbon (Exponential Moving Averages).
o 30-Minute Supertrend.
________________________________________
2. Phase 1: Establish The Bias (The Filter)
This is the V2 upgrade. We do not trade against the day's opening momentum.
1. Mark the Open: Draw a horizontal line at the Daily Open (00:00) or Session Open.
2. The "First 2H" Rule: Observe the price action for the first 2 hours after the open.
o First 2H are Green/Bullish? → You are LONG BIAS only for the rest of the session. (Ignore all sell signals).
o First 2H are Red/Bearish? → You are SHORT BIAS only for the rest of the session. (Ignore all buy signals).
________________________________________
3. Phase 2: The Signal (The Switch)
Wait for the chart to confirm your bias technically.
1. The Switch: Price must cross and close a 15M candle on the correct side of the Daily Open.
o Longs: Price switches from below to above DO.
o Shorts: Price switches from above to below DO.
2. Indicator Confluence:
o EMAs: Must be crossed in your direction (Green for Long, Red for Short).
o 30M Supertrend: Must match your direction.
________________________________________
4. Phase 3: The Entry (The Trigger)
We never chase the breakdown. We wait for the price to come to us.
1. The Pullback: Wait for the price to retrace and touch/wick into the 24/42 EMA Ribbon.
2. The Confirmation: Watch the candle that touches the EMA.
o It must reject the EMA (wick off it) and close respecting the trend.
o Do not enter if the candle closes forcefully through the EMA, breaking structure.
3. Execution: Enter Market Order immediately on that candle close.
________________________________________
5. Phase 4: Risk Management (The Math)
This is the V2 upgrade. We aim for higher profitability.
1. Stop Loss (SL):
o Longs: Placed strictly below the lowest EMA band.
o Shorts: Placed strictly above the highest EMA band.
o Logic: If price crosses the EMA band completely, the trend is dead. Get out.
2. Take Profit (TP):
o FIXED 3R (Reward = 3x Risk).
o Example: If Risk is $100, TP is set to make $300.
o Rule: Do not move the TP. Do not close early. Let the math play out.
________________________________________
Summary Checklist (Print This)
Time: Is the First 2H bias clear? (Green=Buy / Red=Sell)
Switch: Did price close above/below the Daily Open?
Trend: Are EMAs crossed and Supertrend agreeing?
Patience: Did I wait for the price to pull back to the EMA band?
Trigger: Did the candle close respecting the EMA?
Execution: Market Entry + Stop Loss behind EMA + Fixed 3R Target.
Mindset: Am I at "2/10" emotion? Set the trade and walk away.

Session Volume Profile Sniffer: HVN & Rejection ZonesA simple tool built for traders who rely on intraday volume structure.
What this script does
This script tracks volume distribution inside a selected session and highlights two key price levels:
High Volume Nodes (HVNs) — areas where price spent time building heavy participation.
Low Volume Nodes (LVNs) — thin zones where price moved quickly with very little interest.
Instead of plotting a full profile, this tool gives you the exact rejection-level lines you usually hunt manually.
Why these levels matter
HVN → price tends to react, stall, or flip direction
LVN → price often rejects strongly since liquidity is thin
Rejection patterns around these areas give clean entry signals
Positioning trades around HVN/LVN helps filter noise in choppy sessions
This script removes the trouble of drawing profiles, counting bins, or guessing node levels. Everything is calculated inside the session you choose.
How the detection works
Inside your session window, the script:
1. Tracks each tick-based price bucket
2. Accumulates raw volume for every bucket
Identifies:
HVNs = buckets with volume above a tier
LVNs = buckets with volume below a tier
3. Prints each level as a single clean line
4. Generates:
Long signal → bounce from LVN
Short signal → rejection from HVN
Built-in exits use ATR-based conditions for quick testing.
Features
Session-based volume mapping
HVN + LVN levels drawn automatically
Entry triggers based on rejection
ATR exits for experimental backtests
Clean, minimal visual output
Best use cases
Intraday futures
Index scalping
FX sessions (London / NY)
Crypto sessions (user-timed)
Anyone who trades around volume structure
Adjustable settings
Session window
Volume bin size
HVN multiplier
LVN multiplier
Enable/disable zone lines
This keeps it flexible enough for both scalpers and slow-paced intraday setups.
Important note
This script is built for study + idea testing.
It is not intended as a final system.
Once you identify how price behaves around these nodes, you can blend this tool into your own setup.

Improved Candle Strategy (without daily squared)# Candle Pattern Trading Strategy
## Core Logic
Analyzes the last 5 candlesticks to identify "close at high" and "close at low" patterns, generating long/short signals.
## Trading Conditions
- **Long**: ≥2 bars closed at high in past 5 bars + current bar closes at high → Open long
- **Short**: ≥2 bars closed at low in past 5 bars + current bar closes at low → Open short
- **Filter**: If ≥3 doji patterns detected, skip trading
## Risk Management
- Stop Loss: Based on entry bar's high/low
- Take Profit: Risk × 2x multiplier
- Cooldown: No trading for 2 bars after entry
- Session Filter: No trading for first 5 bars after market open
## Configurable Parameters
- Lookback period, doji threshold, close proximity ratio, TP/SL ratio, cooldown bars, etc.
**Use Cases**: 1-minute and higher timeframes on stocks/futures

Scalping Acciones PRO (Entradas + TP + SL) leo
How to use it correctly
• Timeframe: 1m or 5m
• High-volume stocks (SPY, AAPL, TSLA, NVDA…)
• Take Profit (TP): VWAP or EMA 21
• Stop Loss (SL): low/high of the signal candle
⸻
If you want, in the next message I can:
• 🔧 add automatic Stop Loss and Take Profit
• 🚀 convert it into a strategy (Strategy Tester)
• 🎯 filter only strong reversals (fewer false signals)

225 SMA CrossoverWell-known strategy from Zahlengraf from the Mauerstrassenwetten subreddit for you to test yourself.
You can change the length of the SMA and whether to trade long, short or both directions.

Monthly DI+ & RSI StrategyOverview This strategy is designed to capture significant trend reversals and continuations on the Monthly timeframe. It combines the trend-following capability of the Directional Movement Index (DMI) with the fast momentum detection of RSI (Period 6).
Core Logic The strategy triggers a long position based on a dual-confirmation system. It looks for a specific "handshake" between Trend (DI) and Momentum (RSI).
Entry Conditions (OR Logic) A Buy signal is generated if EITHER of the following occurs:
Trend Trigger: DI+ crosses over DI- (while RSI is already bullish, trading above its SMA).
Momentum Trigger: RSI(6) crosses over RSI SMA(14) (while the trend is already bullish, with DI+ > DI-).
Exit Condition (Stop Loss)
Trend Reversal: The position is closed immediately if DI- crosses over DI+, indicating the bullish trend has been invalidated.
Default Settings
Timeframe: Optimized for 1M (Monthly) charts.
RSI: Length 6
RSI SMA: Length 14
DMI: Length 14 / Smoothing 14
Risk Warning This script is for educational purposes only. Past performance does not guarantee future results. Always backtest on your specific asset classes before trading.

Hybrid Trend-Following Inside Bar BreakoutHybrid Trend-Following Inside Bar Breakout Strategy
The Hybrid Trend-Following Inside Bar Breakout Strategy is a rule-based trading system designed to capture strong directional moves while controlling risk during uncertain market conditions. It combines trend-following, price action, and volatility-based risk management into a single robust framework.
Core Concept
The strategy trades inside bar breakouts only in the direction of the dominant market trend. Inside bars represent periods of consolidation, and when price breaks out of this consolidation in a trending market, it often leads to impulsive moves with favorable risk–reward characteristics.
Key Components
1. Trend Filter
Uses 50 EMA and 200 EMA to define the market trend.
Bullish bias: 50 EMA above 200 EMA
Bearish bias: 50 EMA below 200 EMA
This filter prevents counter-trend trades and improves trade quality.
2. Volatility Filter
Compares fast ATR (14) with slow ATR (50).
Trades are taken only when volatility is expanding or above a minimum threshold.
This avoids low-volatility, choppy market conditions.
3. Inside Bar Breakout
An inside bar forms when the current candle’s high is lower than the previous candle’s high and the low is higher than the previous candle’s low.
A trade is triggered only when price breaks above or below the inside bar range in the direction of the trend.
4. Candle Quality Filter
Requires a minimum body-to-range ratio, ensuring that the breakout candle has strong momentum and is not driven by weak wicks.
Risk Management & Trade Management
Stop Loss (SL)
Placed using ATR-based dynamic stops, adapting to current market volatility.
Prevents tight stops in volatile conditions and wide stops in calm markets.
Partial Profit Taking
50% of the position is exited at 1.5R, locking in profits early.
This reduces psychological pressure and improves equity stability.
Trailing Stop
After partial profit is taken, the remaining position is managed with an ATR-based trailing stop.
Allows the strategy to capture large trend moves while protecting gains.
Cooldown Mechanism
After a losing trade, the system enters a cooldown period and skips a fixed number of bars.
This helps avoid revenge trading and overtrading during unfavorable market phases.
Why This Strategy Works
Trades only high-probability breakouts in trending markets
Adapts automatically to changing volatility
Combines price action precision with systematic risk control
Designed for consistent performance over long historical periods

FTSE Santa - Late Dec 12d (Optimised Exit)Simple Santa Rally Strategy. Once a year, in late December, it waits for a sensible (non-spiky) day to get long FTSE, then either stops out around −4%, gets trailed out in profit if it rallies, or exits after about 12 trading days.

EMA 5/9 Angle + Candle Strength (SL=Open, TP=RR)EMA 5 / EMA 9 cross
Cross must have ~30° angle (approximated using slope → atan)
Entry candle must be bullish/bearish and also be Normal / 2nd Most / Most based on body-size percentile
Entry = close of signal candle
SL = open of signal candle
TP = 1:2 RR (editable input)

IDS - Institutional Dip Sniper在加密貨幣市場中,70% 的時間都處於震盪或回調。當大多數突破策略(Breakout Strategies)因為假突破而虧損時,IDS (Institutional Dip Sniper) 卻能從恐慌中獲利。
核心邏輯:
均值回歸 (Mean Reversion): 我們不追高,我們專注於捕捉價格短期過度偏離均線的時刻(Oversold)。這是數學上勝率最高的交易方式之一。
機構安全氣囊: 並非所有的下跌都能接。本策略內建 Coinbase 機構資金濾網,只有在確認機構大戶仍在場內時,才會執行抄底,大幅降低「接到下跌趨勢」的風險。
極速進出: 持倉時間極短,捕捉反彈即離場,有效避開市場長期的不確定性。
適用環境: 牛市回調、震盪盤整(Monkey Market)。
In the crypto market, assets range or correct 70% of the time. While most trend-following/breakout strategies bleed out during these periods, IDS (Institutional Dip Sniper) thrives by capitalizing on short-term panic.
Core Logic:
Mean Reversion: We don't chase green candles. We mathematically identify moments when the price is statistically oversold. This approach historically offers a higher win rate than trend following.
Institutional Safety Net: Not all dips are buyable. This system integrates a proprietary Coinbase Institutional Flow Filter. It only executes mean reversion trades when institutional accumulation is detected, preventing "catching a falling knife" in a bear trend.
High Velocity: Short holding periods. The strategy captures the snap-back bounce and exits immediately, reducing exposure to market volatility.
Ideal Conditions: Bull market pullbacks, Choppy/Ranging markets.
免責聲明 (Disclaimer)
補充說明: 以上策略績效源自歷史數據回測,不代表對未來獲利的保證。加密貨幣市場風險極高,本策略僅供量化研究與邏輯分享,使用者應自行評估風險並自負盈虧,本人不承擔任何交易損失。
Disclaimer: The performance above is based on historical backtesting and does not guarantee future results. Cryptocurrency trading involves high risk. This strategy is shared for quantitative research and educational purposes only. Users are solely responsible for their own risk assessment and PnL. I assume no liability for any trading losses incurred.

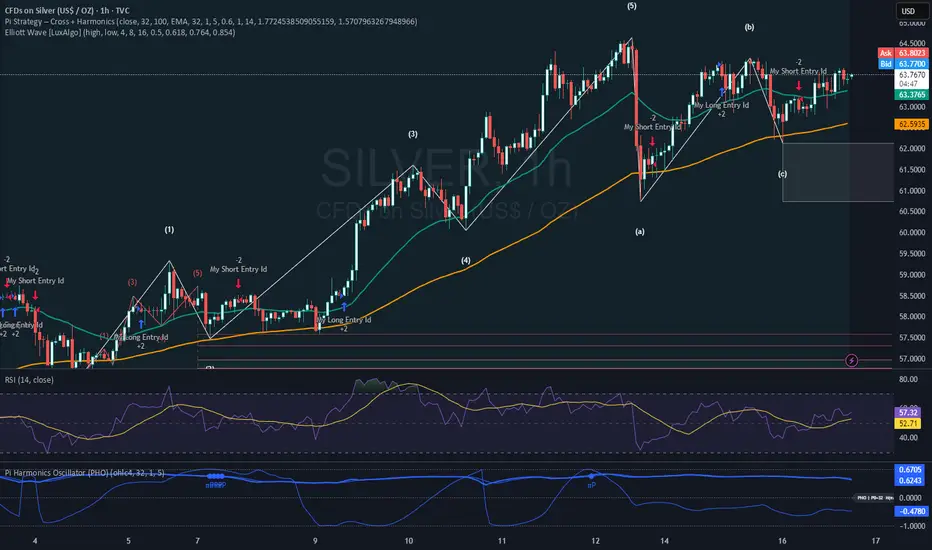
Pi Strategy Cross Harmonicsstill customizing this one, buy and sell seems to off on alternate time settings.
a work in progress, see if this works for anyone.
thanks again.
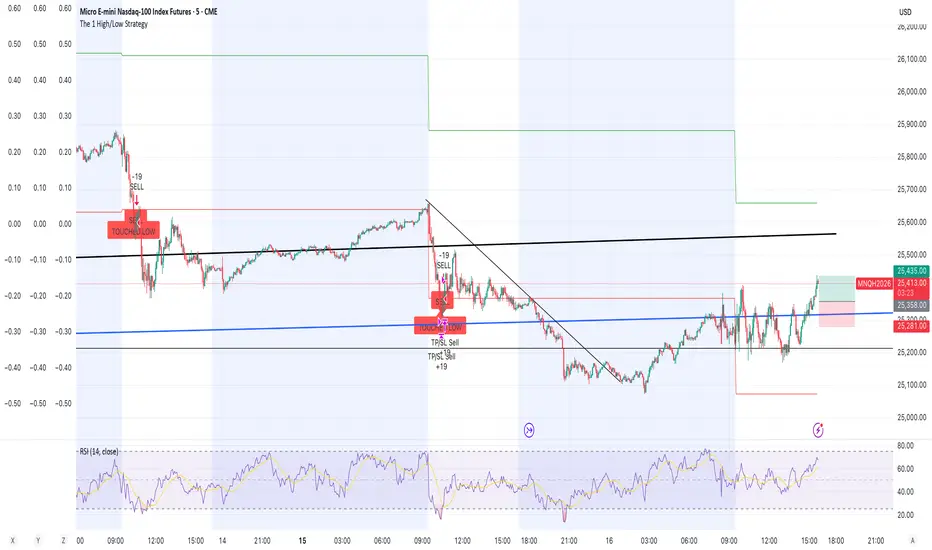
The 1 High/Low StrategyThis strategy takes advantage of price Support and Resistance at High and Low level points of the day to enter high Risk to Reward positions with a high win rate.
UK Public Oneside V2This strategy combines RSI, Stochastic Oscillator, and a 50 EMA trend filter to identify moderate-risk trading opportunities in trending markets.
How it works:
Long entries occur when RSI and Stochastic are in oversold conditions while price is above the 50 EMA.
Short entries occur when RSI and Stochastic are in overbought conditions while price is below the 50 EMA.
Trades are confirmed on the previous candle, avoiding premature entries and exits.
Risk management is handled using fixed percentage stop-loss with configurable risk-to-reward targets.
Optional RSI-based exits close positions early during overbought or oversold conditions.
Key Features:
Trend-filtered entries using EMA 50
Non-repainting logic (confirmed candle signals)
Configurable stop-loss and reward ratio
Works well for scalping and intraday trading
Suitable for crypto, forex, and indices
Recommended Timeframes:
5m, 15m, 30m
Note:
This strategy is designed for educational and research purposes. Always forward-test and apply proper risk management before using in live trading.

Rule-Based Elliott Wave Strategy by xitaxutaStrategy Description
This is a rule-based Elliott Wave–inspired trading strategy designed for lower timeframes (e.g., 1-minute).
The strategy converts Elliott Wave concepts into objective, testable rules using swing pivots, Fibonacci retracements, and momentum confirmation.
The core idea is to trade Wave-3 continuation moves after a valid Wave-1 impulse and Wave-2 corrective pullback have been identified.
How it works
Wave 1 Detection
Identifies an impulsive move using pivot structure and a minimum ATR size filter to avoid noise.
Wave 2 Validation
Waits for a corrective structure (A–B–C–like behavior) and validates it using Fibonacci retracement rules (default ~38%–78%).
Entry Logic
Trades are triggered only on confirmation, not anticipation:
Longs: break above corrective resistance (Wave B)
Shorts: break below corrective support (Wave B)
Risk Management
Stops are placed at the true Wave-2 extreme, invalidating the Elliott count if hit.
Position sizing is based on a fixed percentage of account risk.
Targets
Partial profits are taken at R-based levels, with optional continuation targets using Wave-3 Fibonacci extensions.
Momentum Filter
RSI is used as a confirmation filter to align momentum with the expected Wave-3 direction.
Design Philosophy
No subjective wave drawing
No prediction of tops or bottoms
Structure → confirmation → execution
Focused on high-momentum continuation, not reversals
This strategy is best suited for active intraday trading and performs optimally in markets with sufficient volatility.
Important Notes
Elliott Wave concepts are approximated using objective rules.
The strategy waits for confirmation and may appear “late” by design.
Results depend on market conditions, timeframe, and parameter selection.
