VCAI RSI Divergence +VCAI RSI Divergence+ is an RSI that shows trend, momentum, and divergence using V-CoresAI colour logic instead of a single white line.
What it shows:
Yellow RSI line → bullish momentum (RSI above its MA; buy-side pressure in control)
Purple RSI line → bearish momentum (RSI below its MA; sell-side pressure in control)
Thin blue line → fast RSI moving average that drives the colour flips
Dashed 70/30 lines → classic OB/OS zones
Background bands → soft purple in OB, soft yellow in OS to mark exhaustion areas
How to read it:
Yellow & rising → momentum shifting bullish; pullbacks into yellow OS band can be accumulation zones
Purple & falling → momentum shifting bearish; pushes into purple OB band can be distribution/sell zones
Hard colour flips (yellow ↔ purple) mark trend regime changes, not minor RSI noise
Divergence mode (on/off)
The divergence engine scans RSI and price pivot structure:
Bullish divergence (yellow) → price lower low + RSI higher low
Bearish divergence (purple) → price higher high + RSI lower high
Lines and tags appear only where a meaningful disagreement between price and RSI exists, giving early context for potential reversals or fade setups.
Together, the momentum colours + optional divergence mapping give a far clearer market read than a standard RSI, with zero clutter and no guesswork.
Indicators and strategies

Daily O/C Span (Real Values & SMA Comparison)This Pine Script indicator helps you visualize and track the "momentum" or "strength" of each trading day, and compares it to a recent average. It essentially measures the net movement of the price from when the market opens to when it closes.
What the Script Does
The script performs the following actions:
Calculates Daily Movement: For every single trading day, it calculates the difference between the closing price and the opening price (Close - Open).
Plots the "Span": These daily differences are plotted as vertical bars (a histogram) in a separate window below your main price chart.
-Green bars mean the stock closed higher than it opened (a strong day).
-Red bars mean the stock closed lower than it opened (a weak day).
Calculates the Average: It calculates the Simple Moving Average (SMA) of these daily spans over an adjustable period (default is 30 days).
Plots the Average Line: A blue line is plotted over the green/red bars, showing the typical magnitude of daily movement.
Displays Comparison: A table in the top-right corner provides a quick, real-time numerical comparison of today's span versus the 30-day average span.
How It Can Improve Trading
This indicator helps you understand the character and conviction of price action, offering several trading insights:
Gauging Momentum: It clarifies whether the stock's moves are generally strong and sustained within a day (large spans) or hesitant (small spans).
Identifying Trends: During an uptrend, you might expect the average span line to be consistently positive (above zero), and vice versa for a downtrend. A positive average span indicates buyers are consistently closing the day stronger than where they started it.
Spotting Reversals: If a stock is in a strong uptrend but you suddenly see a series of large red bars (large negative spans), it could signal a shift in momentum and potential upcoming reversal.
Volatility Context: By comparing the current day's bar to the blue average line, you can quickly determine if today is an unusually strong/weak day relative to recent history.
In short, it helps you see the underlying buyer/seller conviction within each day, making it easier to gauge the overall market sentiment and anticipate potential shifts.

Custom Timeframe SMAsThis indicator plots up to three Simple Moving Averages (SMAs), each calculated from a user-selected timeframe and displayed on the current chart. This allows you to visualize higher- or lower-timeframe SMAs without switching charts.
Features
Three fully customizable SMAs with alerts
Each SMA has its own:
Length
Timeframe
Color
Line thickness
On/Off toggle
Use Cases
View higher timeframe SMAs (e.g., 1-hour 50 SMA on a 5-minute chart)
Combine trend signals across multiple timeframes
Track dynamic support/resistance from different timeframes
Enhance scalping, day trading, or swing trading setups


Liquidity Sweep + FVG Entry Model//@version=5
indicator("Liquidity Sweep + FVG Entry Model", overlay = true, max_labels_count = 500, max_lines_count = 500)
// Just to confirm indicator is loaded, always plot close:
plot(close, color = color.new(color.white, 0))
// ─────────────────────────────────────────────
// PARAMETERS
// ─────────────────────────────────────────────
len = input.int(5, "Liquidity Lookback")
tpMultiplier = input.float(2.0, "TP Distance Multiplier")
// ─────────────────────────────────────────────
// LIQUIDITY SWEEP DETECTION
// ─────────────────────────────────────────────
lowestPrev = ta.lowest(low, len)
highestPrev = ta.highest(high, len)
sweepLow = low < lowestPrev and close > lowestPrev
sweepHigh = high > highestPrev and close < highestPrev
// Plot liquidity levels
plot(lowestPrev, "Liquidity Low", color = color.new(color.blue, 40), style = plot.style_line)
plot(highestPrev, "Liquidity High", color = color.new(color.red, 40), style = plot.style_line)
// ─────────────────────────────────────────────
// DISPLACEMENT DETECTION
// ─────────────────────────────────────────────
bullDisp = sweepLow and close > open and close > close
bearDisp = sweepHigh and close < open and close < close
// ─────────────────────────────────────────────
// FAIR VALUE GAP (FVG)
// ─────────────────────────────────────────────
bullFVG = low > high
bearFVG = high < low
// we’ll store the last FVG lines
var line fvgTop = na
var line fvgBottom = na
// clear old FVG lines when new one appears
if bullFVG or bearFVG
if not na(fvgTop)
line.delete(fvgTop)
if not na(fvgBottom)
line.delete(fvgBottom)
// Bullish FVG box
if bullFVG
fvgTop := line.new(bar_index , high , bar_index, high , extend = extend.right, color = color.new(color.green, 60))
fvgBottom := line.new(bar_index , low, bar_index, low, extend = extend.right, color = color.new(color.green, 60))
// Bearish FVG box
if bearFVG
fvgTop := line.new(bar_index , low , bar_index, low , extend = extend.right, color = color.new(color.red, 60))
fvgBottom := line.new(bar_index , high, bar_index, high, extend = extend.right, color = color.new(color.red, 60))
// ─────────────────────────────────────────────
// ENTRY, SL, TP CONDITIONS
// ─────────────────────────────────────────────
var line slLine = na
var line tp1Line = na
var line tp2Line = na
f_deleteLineIfExists(line_id) =>
if not na(line_id)
line.delete(line_id)
if bullDisp and bullFVG
sl = low
tp1 = close + (close - sl) * tpMultiplier
tp2 = close + (close - sl) * (tpMultiplier * 1.5)
f_deleteLineIfExists(slLine)
f_deleteLineIfExists(tp1Line)
f_deleteLineIfExists(tp2Line)
slLine := line.new(bar_index, sl, bar_index + 1, sl, extend = extend.right, color = color.red)
tp1Line := line.new(bar_index, tp1, bar_index + 1, tp1, extend = extend.right, color = color.green)
tp2Line := line.new(bar_index, tp2, bar_index + 1, tp2, extend = extend.right, color = color.green)
label.new(bar_index, close, "BUY Entry FVG Retest SL Below Sweep",
style = label.style_label_up, color = color.new(color.green, 0), textcolor = color.white)
if bearDisp and bearFVG
sl = high
tp1 = close - (sl - close) * tpMultiplier
tp2 = close - (sl - close) * (tpMultiplier * 1.5)
f_deleteLineIfExists(slLine)
f_deleteLineIfExists(tp1Line)
f_deleteLineIfExists(tp2Line)
slLine := line.new(bar_index, sl, bar_index + 1, sl, extend = extend.right, color = color.red)
tp1Line := line.new(bar_index, tp1, bar_index + 1, tp1, extend = extend.right, color = color.green)
tp2Line := line.new(bar_index, tp2, bar_index + 1, tp2, extend = extend.right, color = color.green)
label.new(bar_index, close, "SELL Entry FVG Retest SL Above Sweep",
style = label.style_label_down, color = color.new(color.red, 0), textcolor = color.white)

Crypto Leverage Index(OI Norm. + FR)Crypto Leverage Index (OI Z-Score + Funding Rate Signals)
(A tool for detecting speculative extremes and leverage load in crypto derivatives markets.)
Hello, fellow traders around the globe!
In today's crypto futures market, often perceived as a 'playground for large players' (whales/smart money), catching extreme leverage behavior is crucial for survival. I wanted to come up with an indicator to quickly identify such market extremes by focusing on the two most potent indicators of leveraged action: Open Interest (OI) and Funding Rate (FR). The goal is to ride on the shoulders of the market movers by anticipating their next liquidity-driven actions. hope this helps.
❗ IMPORTANT NOTE: This indicator works exclusively on Perpetual Futures or Swap Charts that provide Open Interest (OI) data.
⚪ Overview
This indicator provides a standardized view of speculative activity by calculating the Open Interest (OI) Z-Score . This score reveals when the current level of open leverage is abnormally high (premium) or low (discount) relative to its historical mean and volatility. The index is also augmented with Extreme Funding Rate Signals , which plot simple White Dots on the chart when derivative positioning (long or short bias) reaches an unsustainable, overheated level. The combination of OI volume and positioning bias offers a good method to identify potential market reversal zones driven by leverage liquidation risks (short/long squeezes).
⚪ Score Components
Open Interest Z-Score (Leverage Load)
The primary component standardizes the Open Interest value over a defined lookback `Period` (default 50). This calculation reveals the statistical deviation of current leverage from the norm.
OI Z-Score = (OI - Mean(OI)) / StDev(OI)
Funding Rate (Positioning Bias)
Calculates the approximate funding rate using a TWAP (Time-Weighted Average Price) of the Perpetual Futures Premium, combined with the standard 0.01% Interest Rate.
⚪ Extreme Condition Detection
OI Z-Score Extremes
* Premium Zone (Red Fill) : OI Z-Score is above the user-defined `Threshold` (default 2.0). Indicates high/overstretched leverage.
* Discount Zone (Green Fill) : OI Z-Score is below the user-defined negative threshold (default -2.0). Indicates low/unwinded leverage.
Funding Rate Extreme Signals (White Dots)
These appear as small White Dots ( · ) plotted at fixed levels within the indicator pane. The position indicates the bias:
* Top Dot (Excessive Longs) : Triggered when Funding Rate is greater than Abnormal Funding Rate Threshold (e.g. 0.03%). Indicates excessive Long positioning/greed and potential for a short-term reversal (Long Squeeze risk). The dot is plotted at the positive `FR Signal Plot Level`.
* Bottom Dot (Excessive Shorts) : Triggered when Funding Rate is lower than -Abnormal Funding Rate Threshold(e.g. -0.03%). Indicates excessive Short positioning/fear and potential for a short-term reversal (Short Squeeze risk). The dot is plotted at the negative `FR Signal Plot Level`.
⚪ Leverage Case Scenarios (Price, OI Dynamics & Context)
The OI Z-Score reflects the premium/discount state of *leverage* (Open Interest) , not the price. The price may not be in a premium or discount area simply because the OI is. OI only indicates the volume of outstanding futures positions. You must observe price action and candlestick patterns alongside the OI movements to determine the true contextual hint. Understanding the relationship between price and Open Interest (OI) change is key to interpreting market movements. The cases listed below represent the most common and thinkable patterns, but do not exhaust all possible market behaviors.
1. Long Build-Up (Price ▲, OI ▲): New long positions enter, confirming the rising trend.
2. Short Build-Up (Price ▼, OI ▲): New short positions enter, confirming the falling trend. Due to the inherently long-biased nature of the crypto market, this scenario is less frequently observed than Long Build-Up.
3. Long Covering/liquidation (Price ▼, OI ▼): Existing longs are closed/liquidated. This activity usually results from Panic Selling or forced long liquidation.
4. Short Covering (Price ▲, OI ▼): Existing shorts are forced to close (Short Squeeze).
5. Long Trap (Price ▲, OI ▲ or ▼): Price rises, but OI suggests new positioning that might be trapping longs. Bearish candle pattern can be often shown with the sweep.
6. Short Trap (Price ▼, OI ▲ or ▼): Warning Sign - Price falls, but OI suggests new positioning that might be trapping shorts.
⚪ Key Input Parameters
OI Z-Score
* Period (Default: 50)
Determines how many recent bars are used to calculate the rolling mean and volatility (standard deviation) of the Open Interest data.
* Z-Score Threshold (Default: 2.0)
The critical level that the OI Z-Score must cross to be considered 'extreme' (overstretched leverage).
Funding Rate
* Abnormal FR Threshold (Default: 0.03)
The absolute percentage value (e.g., 0.03%) that the Funding Rate must exceed or fall below to trigger an extreme signal dot.
* FR Signal Plot Level (Default: 4.0)
Sets the fixed vertical position (Y-level) on the Z-Score chart where the Funding Rate signal dots will appear. (e.g., 4.0 plots the dot at the Z-Score +-4.0 level).
Disclaimer
This script is for educational and informational purposes only and does not constitute financial advice or investment recommendations. Trading cryptocurrencies involves significant risk and you are solely responsible for your own investment decisions, based on your financial situation, objectives, and risk tolerance. The author assumes no liability for losses arising from the use of this indicator.

NQ Points of Interest Suite (Fixed)Defines pre level of support and resistance
Daily MID LOW OPEN CLOSE
WEEKLY MID LOW OPEN CLOSE
MONTHLY MID LOW OPEN CLOSE

EMA21 Pullback BuyEMA21 Pullback Buy is a tool designed to identify constructive pullbacks to the 21-period EMA in strong uptrends.
It highlights candles where:
• The previous close was above EMA21
• The current low touches or dips below EMA21
• The candle closes back above EMA21
These candles are considered potential “support tests” in a trending stock.
You can configure a maximum number of valid tests to avoid late-stage entries.
The script:
• Colors the test candles (optional)
• Marks them with a small circle
• Triggers a buy signal (green triangle) on the first bullish candle that breaks above the test candle’s high
Optional alerts are included for both:
• New EMA21 test
• Buy trigger after valid test
The goal is to help traders find low-risk entries in clean, trending stocks — without chasing breakouts or reacting emotionally. Best used with strong RS names and proper trend context.

9 EMA Retracement Buy/Sell + Volume FilterFor all you scalpers out there this is a 9 ema scalp Indicator coupled with volume bars, the Indicator plots buy and sell when the conditions are met
Price mist be above or below the 9 ema it must retrace and the volume bar must match the direction of the candle and then a signal will be printed with a red or green triangle, do not blindly take all trades on the signals make sure the is a trend works on any asset and remember it is for scalping only

Triple Moving Average's EMA/SMAThis Pine Script in its final v5 version is a fundamental visual tool that supports traders in quickly identifying the trend and sentiment.
Key Script Goal
This script's primary objective is flexible multi-timeframe analysis of the trend.
The script serves as a universal set of three independent moving averages, which is intended to help you with the visual assessment of the market context:
EMA (20 periods): Serves as dynamic support/resistance for short-term sentiment. It is highly sensitive to recent price action.
SMA1 (50 periods): Typically acts as a medium-term trend indicator. It is often used to identify corrections.
SMA2 (100 periods): Provides a long-term perspective. Its slope and position relative to the price indicate the dominant structural trend.
The script is a base for every trader who relies on technical analysis and Price Action, utilizing moving averages as dynamic S/R levels.

Estrategia Visual PRO: Momentum EditionIndicador con estrategia propia basado en cruce de emas editables son sombreado de tendencia del precio y niveles de soporte y resistencias donde el precio tiene reaccion, tambien cuenta con filtro de rsi donde colorea las velas segun la fuerza del rsi, colores editables y cuando el precio pierde fuerza
This indicator, with its own strategy based on editable EMA crossovers, features price trend shading and support and resistance levels where the price reacts. It also includes an RSI filter that colors the candles according to the strength of the RSI, with editable colors, and alerts you when the price loses strength.


Alloyz Traders_RSI by Sagar BRSI for Intraday purpose with moving average and volume weightage price added in RSI.

RSI Pivot Breaks█ OVERVIEW
RSI Pivot Breaks is an RSI-based indicator that detects breakout events on oscillator-based pivot levels (RSI or MA RSI).
The tool automatically plots pivot levels, tracks their breakouts, highlights momentum shifts, and generates alerts for key events (pivot breaks and OB/OS crosses).
The indicator is designed primarily for momentum strategies — pivot breakouts often precede directional price moves, making RSI Pivot Breaks a powerful tool for identifying accelerations and changes in strength.
█ CONCEPTS
The indicator analyzes local RSI extremes and transforms them into dynamic support/resistance levels.
When RSI or MA RSI breaks the last pivot, it signals a shift in momentum balance, often leading to an impulse move.
Key concepts:
- pivot highs/lows detected on RSI or MA RSI,
- pivot lines extend forward until broken,
- pivot filters restrict pivot detection to specific RSI zones,
- OB/OS levels provide contextual momentum thresholds.
█ FEATURES
Pivot Detection & Breakouts
- Detection of pivot highs and lows on RSI or MA RSI.
- Pivot filters allow you to limit pivot detection to specific RSI ranges (e.g., only bullish pivots below 50 or bearish pivots above 50).
- Pivot lines update automatically after breakout.
Background highlights:
- green on pivot-high breakouts,
- red on pivot-low breakouts.
RSI & MA RSI
- Dynamic RSI colors based on momentum direction.
- Optional MA RSI line (SMA/EMA/RMA/WMA) usable as a smoother pivot source.
OB / OS Zones
- Fully adjustable overbought/oversold levels.
- Dedicated OB/OS colors.
- Optional gradient backgrounds.
Highlights
- Instant identification of moments when RSI breaks a key pivot level.
Alerts:
- pivot high breakouts.
- pivot low breakouts.
- OB crosses.
- OS crosses.
█ HOW TO USE
Add the indicator:
Indicators → RSI Pivot Breaks.
RSI Settings
- RSI Length – core RSI period.
- RSI MA Length & Type – MA RSI smoothing parameters.
Pivot Settings
- Pivot Left / Pivot Right – number of bars required to form a pivot and also the number of bars of delay before the pivot becomes confirmed.
(Higher values produce more reliable but slower pivots.)
Pivot Filters
- Minimum/maximum allowed RSI levels for pivot Highs and Lows.
- Examples:
- detect only pivot Highs at low RSI values.
- ignore pivots during extreme momentum.
- allow only mid-range pivot detection depending on strategy.
Visualization
- Toggles for RSI and MA RSI visibility.
- Optional gradients.
- Full color and transparency customization.
OB/OS Levels
- Adjustable thresholds depending on instrument volatility and strategy style.
█ SIGNAL INTERPRETATION
BUY
- RSI breaks the latest pivot high.
- RSI crosses upward out of OS.
- Context example: pivot lows forming a rising sequence.
SELL
- RSI breaks the latest pivot low.
- RSI drops downward from OB.
- Context example: pivot highs forming a declining sequence.
Trend / Momentum
- Pivot breakouts indicate acceleration or continuation of momentum.
- MA-based pivots provide smoother and more stable momentum structure.
█ APPLICATIONS
- Momentum Trading – pivot breaks as early acceleration signals.
- Scalping & Intraday – fast RSI pivots react quickly to short-term shifts.
- Swing Trading – smoother pivots using MA RSI for higher-timeframe structure.
- Divergence Detection – pivot behavior helps reveal divergence patterns, e.g.:
- RSI pivots rising while price is falling → potential early momentum reversal.
- Custom Filtering – pivot filters allow, for example:
- blocking bullish signals near OB.
- blocking bearish signals near OS.
- detecting pivots only above/below mid-range during strong trends,
depending entirely on strategy design.
█ NOTES
- Pivot detection includes natural delay equal to the Left/Right parameters.
- Pivot filters significantly change the character of signals, allowing fine-tuning of aggressiveness for any strategy.


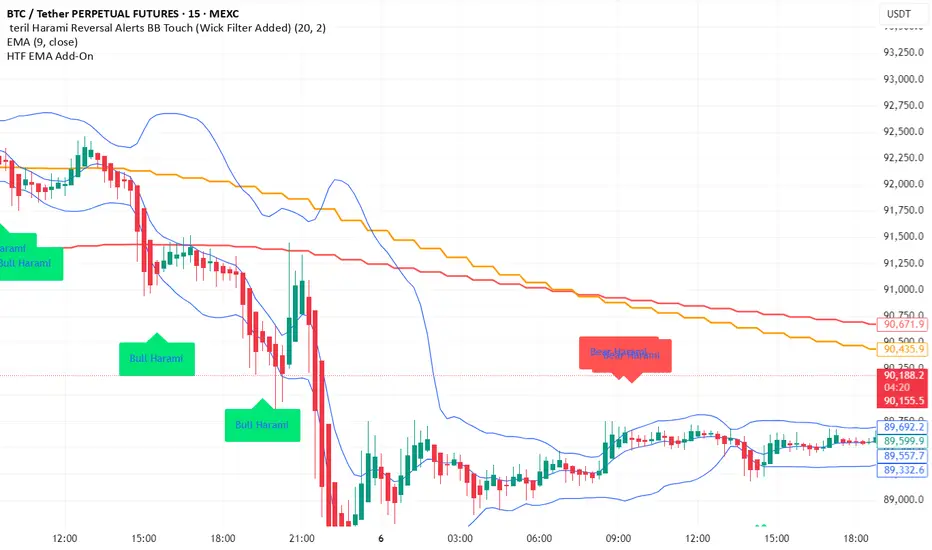
teril 1H EMA50 Harami Reversal Alerts BB Touch teril Harami Reversal Alerts BB Touch (Wick Filter Added + 1H EMA50)
teril Harami Reversal Alerts BB Touch (Wick Filter Added + 1H EMA50)
teril Harami Reversal Alerts BB Touch (Wick Filter Added + 1H EMA50)
teril Harami Reversal Alerts BB Touch (Wick Filter Added + 1H EMA50)


Terils 1hr HTF EMA Add-On EMA 50/100its EMA 50 and EMA 100 in 1 her time frame.
its EMA 50 and EMA 100 in 1 her time frame.
its EMA 50 and EMA 100 in 1 her time frame.
its EMA 50 and EMA 100 in 1 her time frame.
its EMA 50 and EMA 100 in 1 her time frame.
Volatility Value BandsThis indicator is a modern adaptation of Mark Helweg's original Value Charts concept, focused on visually displaying volatility zones and "extreme value" areas directly on the price chart. It does not replicate the original work but draws inspiration from the logic of normalizing price by volatility to highlight statistically stretched regions.
1. Introduction
This study displays three lines directly on the chart:
- a central reference line (base),
- an upper overvaluation band,
- and a lower undervaluation band.
The bands are calculated from the relationship between price, moving average, and volatility (via true range/ATR), following Mark Helweg's Value Charts concept but with a custom implementation and adjustable parameters for different assets and timeframes. This allows objectively visualizing when price is in a statistically extended region relative to its recent behavior.
2. Key Features
- Volatility-normalized base
The indicator converts price deviation into "value units" using a combination of moving average and smoothed volatility (true range/ATR), making levels comparable across different assets and time horizons.
- Auto-adjusting limits (optional)
An automatic mode can calculate upper and lower limits from recent value unit extremes, using a configurable sampling window and percentile, allowing bands to adapt to the current volatility regime without manual recalibration.
- Direct plot on price chart
The three lines (central, upper, and lower) are drawn directly on the main asset chart (`overlay`), making it easy to read context: it's clear when price "touches" or breaks the volatility bands without switching to a separate pane.
- Flexible parameters
Users can control:
- base moving average period (length)
- volatility factor (manual or automatic)
- independent windows for volatility and limits calculation
- limits mode (auto or manual) and percentile used
This allows adapting behavior to different markets (stocks, indices, forex, crypto).
3. How to Use
- Basic interpretation
- When price approaches or exceeds the upper band, it indicates a statistically overvalued zone where the asset is stretched upward relative to recent volatility.
- When price approaches or exceeds the lower band, it indicates a statistically undervalued zone.
- The central line serves as a reference for recent "average value," derived from the base moving average.
- Recommended initial setup
- Choose the Value Chart period (e.g., 144 bars) for the base.
- Enable automatic limits mode for coherent bands matching the asset's volatility.
- Adjust the limits window and percentile for tighter bands (more signals) or wider bands (fewer but more extreme).
- Best practices
- Use bands as context filters, not standalone buy/sell signals. Combine with trend, market structure, or other confirmation indicators.
- Avoid decisions solely because price touched a band; in strong trends, price can "walk the edge" for extended periods.
- Always follow TradingView community rules when publishing: clearly state in the description that the study is "inspired by Mark Helweg's Value Charts concept," without claiming official status, reproducing proprietary code, or violating copyrights.

Scalping EMA9/15 This indicator is designed for high-accuracy intraday scalping based on a refined version of the popular EMA9–EMA15 trend-following technique.
It filters weak or premature entries by requiring a retest of the EMA zone before generating a Buy/Sell signal — drastically reducing false breakouts.

Volume Heikin Ashi by CrugThis indicator combines the Heikin Ashi with classic volume candles.
It is useful to see the trend and "how much" volume it contains
1 - Select Volume Candles on the graph
i.postimg.cc
2- In setting remove the all the colors
i.postimg.cc
3- Insert the indicator
4- Using with momentum indicators (like Market liberator B, MACD, ...) it provides more precise and realistic data to plot divergences because it combines: classic japanese candle but with volumes. In the meantime it is easier to see the main trend
i.postimg.cc
Swing HL**摆动点标注(Swing HL)**
本指标用于在价格图表上标示摆动高点与摆动低点,以辅助用户观察价格结构、波段节奏及潜在支撑/阻力区域。标注以圆点形式叠加在主图上,可通过参数灵活控制显示周期、敏感度及视觉样式,适合作为价格结构分析的辅助工具。
### 参数及用法说明
1. **最小显示时间框架(minSwingTf)**
* 用途:设定摆动点开始显示的最小周期。
* 当前图表周期小于该设置时,不显示任何摆动标注。
* 建议:
* 做中短线结构分析时,可设置为 240 分钟或更高;
* 若需要在更小周期观察结构,可适当降低该参数。
2. **left / right(leftBars / rightBars)**
* 用途:共同控制摆动高点、低点识别的“严格程度”和频率。
* 调整建议:
* 数值较小:标注更频繁,适合关注细节波动、短线结构;
* 数值较大:只保留更明显的摆动点,适合观察中期或波段结构;
* 当图表上摆动点过多、显得拥挤时,可适当增大这两个参数。
3. **标注颜色(dotColor)**
* 用途:设置摆动点圆标的颜色。
* 建议根据图表背景及主图颜色进行调整,以保证摆动点清晰可见但不过于抢眼。
4. **线宽(dotWidth)**
* 用途:控制圆点标注的线宽,从而影响圆点的视觉大小。
* 当需要在高密度数据或缩放较小时保持清晰,可适当增大该数值。
### 使用建议
* 可将本指标作为结构辅助层叠加在任何交易系统之上,用于直观划分价格的波段高低点。
* 进行多周期分析时,可在较大周期(如 4H、日线)上利用本指标确认整体结构,再配合小周期执行入场与风控。
* 当摆动点过多时,可通过提高 `minSwingTf` 或增加 `left` / `right` 参数,使结构标注更加简洁清晰。
* 本指标仅提供价格摆动结构的可视化标注,不直接构成完整的交易信号或策略规则,建议与个人既有分析方法结合使用。
---
**Swing HL – Swing High/Low Marker**
This indicator marks swing highs and swing lows on the price chart to assist in reading price structure, swing rhythm, and potential support/resistance zones. Markers are plotted as dots on the main chart, and display behavior can be fully controlled via user inputs such as minimum timeframe, sensitivity, and visual style. It is designed to serve as a structural overlay for discretionary or systematic analysis.
### Inputs and Usage
1. **Minimum Display Timeframe (minSwingTf)**
* Purpose: Defines the minimum timeframe on which swing markers will be shown.
* When the current chart timeframe is below this setting, all swing markers are hidden.
* Guidance:
* For swing or position-style structure analysis, consider using 4H or higher;
* For intraday structural work, you may lower this value as needed.
2. **left / right (leftBars / rightBars)**
* Purpose: Jointly control how strict and how frequent swing highs and lows are marked.
* Tuning:
* Smaller values: More frequent swings, suitable for detailed, lower-timeframe structure;
* Larger values: Only more pronounced swings are kept, suitable for higher-level trend and swing mapping;
* If the chart becomes crowded with markers, increasing these values will simplify the structure.
3. **Marker Color (dotColor)**
* Purpose: Sets the color of the swing markers.
* It is recommended to choose a color that contrasts with the background and main price plot while remaining visually unobtrusive.
4. **Line Width (dotWidth)**
* Purpose: Controls the line width of the dot markers, effectively adjusting their perceived size.
* On dense charts or when zoomed out, a larger value can help maintain readability.
### Practical Notes
* Use this indicator as a structural overlay to highlight swing highs and lows alongside your existing trading tools and methods.
* In multi-timeframe workflows, it can help outline the main structure on higher timeframes (e.g., 4H, Daily), which you then refine on lower timeframes for execution.
* If too many swing points appear, either increase `minSwingTf` or raise the `left` / `right` values to obtain a cleaner structural view.
* The script is intended as a visualization aid for price swings; it does not, by itself, define entry, exit, or risk management rules and should be integrated into a broader analytical framework.

ZKNZCN Önceki Bar H/L (Ayrı Kontrol)Bir önceki barın high & low noktalarını çizgi halinde görmeyi sağlar.
