Volumatic Fair Value Gaps [BigBeluga]🔵 OVERVIEW
The Volumatic Fair Value Gaps indicator detects and plots size-filtered Fair Value Gaps (FVGs) and immediately analyzes the bullish vs. bearish volume composition inside each gap. When an FVG forms, the tool samples volume from a 10× lower timeframe , splits it into Buy and Sell components, and overlays two compact bars whose percentages always sum to 100%. Each gap also shows its total traded volume . A live dashboard (top-right) summarizes how many bullish and bearish FVGs are currently active and their cumulative volumes—offering a quick read on directional participation and trend pressure.
🔵 CONCEPTS
FVGs (Fair Value Gaps) : Imbalance zones between three consecutive candles where price “skips” trading. The script plots bullish and bearish gaps and extends them until mitigated.
Size Filtering : Only significant gaps (by relative size percentile) are drawn, reducing noise and emphasizing meaningful imbalances.
// Gap Filters
float diff = close > open ? (low - high ) / low * 100 : (low - high) / high *100
float sizeFVG = diff / ta.percentile_nearest_rank(diff, 1000, 100) * 100
bool filterFVG = sizeFVG > 15
Volume Decomposition : For each FVG, the indicator inspects a 10× lower timeframe and aggregates volume of bullish vs. bearish candles inside the gap’s span.
100% Split Bars : Two inline bars per FVG display the % Bull and % Bear shares; their total is always 100%.
Total Gap Volume : A numeric label at the right edge of the FVG shows the total traded volume associated with that gap.
Mitigation Logic : Gaps are removed when price closes through (or touches via high/low—user-selectable) the opposite boundary.
Dashboard Summary : Counts and sums the active bullish/bearish FVGs and their total volumes to gauge directional dominance.
🔵 FEATURES
Bullish & Bearish FVG plotting with independent color controls and visibility toggles.
Adaptive size filter (percentile-based) to keep only impactful gaps.
Lower-TF volume sampling at 10× faster resolution for more granular Buy/Sell breakdown.
Per-FVG volume bars : two horizontal bars showing Bull % and Bear % (sum = 100%).
Per-FVG total volume label displayed at the right end of the gap’s body.
Mitigation source option : choose close or high/low for removing/invalidating gaps.
Overlap control : older overlapped gaps are cleaned to avoid clutter.
Auto-extension : active gaps extend right until mitigated.
Dashboard : shows count of bullish/bearish gaps on chart and cumulative volume totals for each side.
Performance safeguards : caps the number of active FVG boxes to maintain responsiveness.
🔵 HOW TO USE
Turn on/off FVG types : Enable Bullish FVG and/or Bearish FVG depending on your focus.
Tune the filter : The script already filters by relative size; if you need fewer (stronger) signals, increase the percentile threshold in code or reduce the number of displayed boxes.
Choose mitigation source :
close — stricter; gap is removed when a closing price crosses the boundary.
high/low — more sensitive; a wick through the boundary mitigates the gap.
Read the per-FVG bars :
A higher Bull % inside a bullish gap suggests constructive demand backing the imbalance.
A higher Bear % inside a bearish gap suggests supply is enforcing the imbalance.
Use total gap volume : Larger totals imply more meaningful interest at that imbalance; confluence with structure/HTF levels increases relevance.
Watch the dashboard : If bullish counts and cumulative volume exceed bearish, market pressure is likely skewed upward (and vice versa). Combine with trend tools or market structure for entries/exits.
Optional: hide volume bars : Disable Volume Bars when you want a cleaner FVG map while keeping total volume labels and the dashboard.
🔵 CONCLUSION
Volumatic Fair Value Gaps blends precise FVG detection with lower-timeframe volume analytics to show not only where imbalances exist but also who powers them. The per-gap Bull/Bear % bars, total volume labels, and the cumulative dashboard together provide a fast, high-signal read on directional participation. Use the tool to prioritize higher-quality gaps, align with trend bias, and time mitigations or continuations with greater confidence.
Indicators and strategies

AI-Weighted RSI (Zeiierman)█ Overview
AI-Weighted RSI (Zeiierman) is an adaptive oscillator that enhances classic RSI by applying a correlation-weighted prediction layer. Instead of looking only at RSI values directly, this indicator continuously evaluates how other price- and volume-based features (returns, volatility, volume shifts) correlate with RSI, and then weights them accordingly to project the next RSI state.
The result is a smoother, forward-looking RSI framework that adapts to market conditions in real time.
By leveraging feature correlation instead of static formulas, AI-Weighted RSI behaves like a lightweight learning model, adjusting its emphasis depending on which features are most aligned with RSI behavior during the current regime.
█ How It Works
⚪ Feature Extraction
Each bar, the script computes features: log returns, RSI itself, ATR% (volatility), volume, and volume log-change.
⚪ Correlation Screening
Over a rolling learning window, it measures the correlation of each feature against RSI. The strongest relationships are ranked and selected.
⚪ Adaptive Weighting
Features are standardized (z-scored), then combined using their signed correlations as weights, building a rolling, adaptive prediction of RSI.
⚪ Prediction to RSI Weight
The predicted RSI is mapped back into a “weight” scale (±2 by default). Above 0 = bullish bias, below 0 = bearish bias, with color-graded fills to visualize overbought/oversold pressure.
⚪ Signal Line
A smoothing option (signal length) overlays a moving average of the AI-Weighted RSI for clearer trend confirmation.
█ Why AI-Weighted RSI
⚪ Adaptive to Market Regime
Because the model re-evaluates correlations continuously, it naturally shifts which features dominate, sometimes volatility explains RSI best, sometimes volume, sometimes returns.
⚪ Forward-Looking Bias
Instead of simply reflecting RSI, the model provides a projection, helping anticipate shifts in momentum before RSI itself flips.
█ How to Use
⚪ Directional Bias
Read the RSI relative to 0. Above = bullish momentum bias, below = bearish.
⚪ Overbought / Oversold Zones
Shaded fills beyond +0.5 or -0.5 highlight extremes where RSI pressure often exhausts.
⚪ Divergences
When price makes new highs/lows but AI-Weighted RSI fails to confirm, it often signals weakening momentum.
█ Settings
RSI Length: Lookback for the core RSI calculation.
Signal Length: Smoothing applied to the AI-Weighted RSI output.
Learning Window: Bars used for correlation learning and z-scoring.
-----------------
Disclaimer
The content provided in my scripts, indicators, ideas, algorithms, and systems is for educational and informational purposes only. It does not constitute financial advice, investment recommendations, or a solicitation to buy or sell any financial instruments. I will not accept liability for any loss or damage, including without limitation any loss of profit, which may arise directly or indirectly from the use of or reliance on such information.
All investments involve risk, and the past performance of a security, industry, sector, market, financial product, trading strategy, backtest, or individual's trading does not guarantee future results or returns. Investors are fully responsible for any investment decisions they make. Such decisions should be based solely on an evaluation of their financial circumstances, investment objectives, risk tolerance, and liquidity needs.

Deadband Hysteresis Supertrend [BackQuant]Deadband Hysteresis Supertrend
A two-stage trend tool that first filters price with a deadband baseline, then runs a Supertrend around that baseline with optional flip hysteresis and ATR-based adverse exits.
What this is
A hybrid of two ideas:
Deadband Hysteresis Baseline that only advances when price pulls far enough from the baseline to matter. This suppresses micro noise and gives you a stable centerline.
Supertrend bands wrapped around that baseline instead of raw price. Flips are further gated by an extra margin so side changes are more deliberate.
The goal is fewer whipsaws in chop and clearer regime identification during trends.
How it works (high level)
Deadband step — compute a per-bar “deadband” size from one of four modes: ATR, Percent of price, Ticks, or Points. If price deviates from the baseline by more than this amount, move the baseline forward by a fraction of the excess. If not, hold the line.
Centered Supertrend — build upper and lower bands around the baseline using ATR and a user factor. Track the usual trailing logic that tightens a band while price moves in its favor.
Flip hysteresis — require price to exceed the active band by an extra flip offset × ATR before switching sides. This adds stickiness at the boundary.
Adverse exit — once a side is taken, trigger an exit if price moves against the entry by K × ATR .
If you would like to check out the filter by itself:
What it plots
DBHF baseline (optional) as a smooth centerline.
DBHF Supertrend as the active trailing band.
Candle coloring by trend side for quick read.
Signal markers 𝕃 and 𝕊 at flips plus ✖ on adverse exits.
Inputs that matter
Price Source — series being filtered. Close is typical. HL2 or HLC3 can be steadier.
Deadband mode — ATR, Percent, Ticks, or Points. This defines the “it’s big enough to matter” zone.
ATR Length / Mult (DBHF) — only used when mode = ATR. Larger values widen the do-nothing zone.
Percent / Ticks / Points — alternatives to ATR; pick what fits your market’s convention.
Enter Mult — scales the deadband you must clear before the baseline moves. Increase to filter more noise.
Response — fraction of the excess applied to baseline movement. Higher responds faster; lower is smoother.
Supertrend ATR Period & Factor — traditional band size controls; higher factor widens and flips less often.
Flip Offset ATR — extra ATR buffer required to flip. Useful in choppy regimes.
Adverse Stop K·ATR — per-trade danger brake that forces an exit if price moves K×ATR against entry.
UI — toggle baseline, supertrend, signals, and bar painting; choose long and short colors.
How to read it
Green regime — candles painted long and the Supertrend running below price. Pullbacks toward the baseline that fail to breach the opposite band often resume higher.
Red regime — candles painted short and the Supertrend running above price. Rallies that cannot reclaim the band may roll over.
Frequent side swaps — reduce sensitivity by increasing Enter Mult, using ATR mode, raising the Supertrend factor, or adding Flip Offset ATR.
Use cases
Bias filter — allow entries only in the direction of the current side. Use your preferred triggers inside that bias.
Trailing logic — treat the active band as a dynamic stop. If the side flips or an adverse K·ATR exit prints, reduce or close exposure.
Regime map — on higher timeframes, the combination baseline + band produces a clean up vs down template for allocation decisions.
Tuning guidance
Fast markets — ATR deadband, modest Enter Mult (0.8–1.2), response 0.2–0.35, Supertrend factor 1.7–2.2, small Flip Offset (0.2–0.5 ATR).
Choppy ranges — widen deadband or raise Enter Mult, lower response, and add more Flip Offset so flips require stronger evidence.
Slow trends — longer ATR periods and higher Supertrend factor to keep you on side longer; use a conservative adverse K.
Included alerts
DBHF ST Long — side flips to long.
DBHF ST Short — side flips to short.
Adverse Exit Long / Short — K·ATR stop triggers against the current side.
Strengths
Deadbanded baseline reduces micro whipsaws before Supertrend logic even begins.
Flip hysteresis adds a second layer of confirmation at the boundary.
Optional adverse ATR stop provides a uniform risk cut across assets and regimes.
Clear visuals and minimal parameters to adjust for symbol behavior.
Putting it together
Think of this tool as two decisions layered into one view. The deadband baseline answers “does this move even count,” then the Supertrend wrapped around that baseline answers “if it counts, which side should I be on and where do I flip.” When both parts agree you tend to stay on the correct side of a trend for longer, and when they disagree you get an early warning that conditions are changing.
When the baseline bends and price cannot reclaim the opposite band , momentum is usually continuing. Pullbacks into the baseline that stall before the far band often resolve in trend.
When the baseline flattens and the bands compress , expect indecision. Use the Flip Offset ATR to avoid reacting to the first feint. Wait for a clean band breach with follow through.
When an adverse K·ATR exit prints while the side has not flipped , treat it as a risk event rather than a full regime change. Many users cut size, re-enter only if the side reasserts, and let the next flip confirm a new trend.
Final thoughts
Deadband Hysteresis Supertrend is best read as a regime lens. The baseline defines your tolerance for noise, the bands define your trailing structure, and the flip offset plus adverse ATR stop define how forgiving or strict you want to be at the boundary. On strong trends it helps you hold through shallow shakeouts. In choppy conditions it encourages patience until price does something meaningful. Start with settings that reflect the cadence of your market, observe how often flips occur, then nudge the deadband and flip offset until the tool spends most of its time describing the move you care about rather than the noise in between.

Machine Learning Gaussian Mixture Model | AlphaNattMachine Learning Gaussian Mixture Model | AlphaNatt
A revolutionary oscillator that uses Gaussian Mixture Models (GMM) with unsupervised machine learning to identify market regimes and automatically adapt momentum calculations - bringing statistical pattern recognition techniques to trading.
"Markets don't follow a single distribution - they're a mixture of different regimes. This oscillator identifies which regime we're in and adapts accordingly."
━━━━━━━━━━━━━━━━━━━━━━━━━━━━━━━━━━━━━━━━
🤖 THE MACHINE LEARNING
Gaussian Mixture Models (GMM):
Unlike K-means clustering which assigns hard boundaries, GMM uses probabilistic clustering :
Models data as coming from multiple Gaussian distributions
Each market regime is a different Gaussian component
Provides probability of belonging to each regime
More sophisticated than simple clustering
Expectation-Maximization Algorithm:
The indicator continuously learns and adapts using the E-M algorithm:
E-step: Calculate probability of current market belonging to each regime
M-step: Update regime parameters based on new data
Continuous learning without repainting
Adapts to changing market conditions
━━━━━━━━━━━━━━━━━━━━━━━━━━━━━━━━━━━━━━━━
🎯 THREE MARKET REGIMES
The GMM identifies three distinct market states:
Regime 1 - Low Volatility:
Quiet, ranging markets
Uses RSI-based momentum calculation
Reduces false signals in choppy conditions
Background: Pink tint
Regime 2 - Normal Market:
Standard trending conditions
Uses Rate of Change momentum
Balanced sensitivity
Background: Gray tint
Regime 3 - High Volatility:
Strong trends or volatility events
Uses Z-score based momentum
Captures extreme moves
Background: Cyan tint
━━━━━━━━━━━━━━━━━━━━━━━━━━━━━━━━━━━━━━━━
💡 KEY INNOVATIONS
1. Probabilistic Regime Detection:
Instead of binary regime assignment, provides probabilities:
30% Regime 1, 60% Regime 2, 10% Regime 3
Smooth transitions between regimes
No sudden indicator jumps
2. Weighted Momentum Calculation:
Combines three different momentum formulas
Weights based on regime probabilities
Automatically adapts to market conditions
3. Confidence Indicator:
Shows how certain the model is (white line)
High confidence = strong regime identification
Low confidence = transitional market state
Line transparency changes with confidence
━━━━━━━━━━━━━━━━━━━━━━━━━━━━━━━━━━━━━━━━
⚙️ PARAMETER OPTIMIZATION
Training Period (50-500):
50-100: Quick adaptation to recent conditions
100: Balanced (default)
200-500: Stable regime identification
Number of Components (2-5):
2: Simple bull/bear regimes
3: Low/Normal/High volatility (default)
4-5: More granular regime detection
Learning Rate (0.1-1.0):
0.1-0.3: Slow, stable learning
0.3: Balanced (default)
0.5-1.0: Fast adaptation
━━━━━━━━━━━━━━━━━━━━━━━━━━━━━━━━━━━━━━━━
📊 TRADING STRATEGIES
Visual Signals:
Cyan gradient: Bullish momentum
Magenta gradient: Bearish momentum
Background color: Current regime
Confidence line: Model certainty
1. Regime-Based Trading:
Regime 1 (pink): Expect mean reversion
Regime 2 (gray): Standard trend following
Regime 3 (cyan): Strong momentum trades
2. Confidence-Filtered Signals:
Only trade when confidence > 70%
High confidence = clearer market state
Avoid transitions (low confidence)
3. Adaptive Position Sizing:
Regime 1: Smaller positions (choppy)
Regime 2: Normal positions
Regime 3: Larger positions (trending)
━━━━━━━━━━━━━━━━━━━━━━━━━━━━━━━━━━━━━━━━
🚀 ADVANTAGES OVER OTHER ML INDICATORS
vs K-Means Clustering:
Soft clustering (probabilities) vs hard boundaries
Captures uncertainty and transitions
More mathematically robust
vs KNN (K-Nearest Neighbors):
Unsupervised learning (no historical labels needed)
Continuous adaptation
Lower computational complexity
vs Neural Networks:
Interpretable (know what each regime means)
No overfitting issues
Works with limited data
━━━━━━━━━━━━━━━━━━━━━━━━━━━━━━━━━━━━━━━━
📈 PERFORMANCE CHARACTERISTICS
Best Market Conditions:
Markets with clear regime shifts
Volatile to trending transitions
Multi-timeframe analysis
Cryptocurrency markets (high regime variation)
Key Strengths:
Automatically adapts to market changes
No manual parameter adjustment needed
Smooth transitions between regimes
Probabilistic confidence measure
━━━━━━━━━━━━━━━━━━━━━━━━━━━━━━━━━━━━━━━━
🔬 TECHNICAL BACKGROUND
Gaussian Mixture Models are used extensively in:
Speech recognition (Google Assistant)
Computer vision (facial recognition)
Astronomy (galaxy classification)
Genomics (gene expression analysis)
Finance (risk modeling at investment banks)
The E-M algorithm was developed at Stanford in 1977 and is one of the most important algorithms in unsupervised machine learning.
━━━━━━━━━━━━━━━━━━━━━━━━━━━━━━━━━━━━━━━━
💡 PRO TIPS
Watch regime transitions: Best opportunities often occur when regimes change
Combine with volume: High volume + regime change = strong signal
Use confidence filter: Avoid low confidence periods
Multi-timeframe: Compare regimes across timeframes
Adjust position size: Scale based on identified regime
━━━━━━━━━━━━━━━━━━━━━━━━━━━━━━━━━━━━━━━━
⚠️ IMPORTANT NOTES
Machine learning adapts but doesn't predict the future
Best used with other confirmation indicators
Allow time for model to learn (100+ bars)
Not financial advice - educational purposes
Backtest thoroughly on your instruments
━━━━━━━━━━━━━━━━━━━━━━━━━━━━━━━━━━━━━━━━
🏆 CONCLUSION
The GMM Momentum Oscillator brings institutional-grade machine learning to retail trading. By identifying market regimes probabilistically and adapting momentum calculations accordingly, it provides:
Automatic adaptation to market conditions
Clear regime identification with confidence levels
Smooth, professional signal generation
True unsupervised machine learning
This isn't just another indicator with "ML" in the name - it's a genuine implementation of Gaussian Mixture Models with the Expectation-Maximization algorithm, the same technology used in:
Google's speech recognition
Tesla's computer vision
NASA's data analysis
Wall Street risk models
"Let the machine learn the market regimes. Trade with statistical confidence."
━━━━━━━━━━━━━━━━━━━━━━━━━━━━━━━━━━━━━━━━
Developed by AlphaNatt | Machine Learning Trading Systems
Version: 1.0
Algorithm: Gaussian Mixture Model with E-M
Classification: Unsupervised Learning Oscillator
Not financial advice. Always DYOR.

Bank Strategy v2# Multi-Signal Confirmation Strategy (MSCS)
## Overview
The Multi-Signal Confirmation Strategy is a comprehensive technical analysis indicator that combines multiple confirmation signals to generate high-probability buy and sell opportunities. This indicator is designed to reduce false signals by requiring multiple technical confirmations before generating trading alerts.
## Key Features
### 🎯 **Multi-Confirmation System**
- Requires 2-5 confirmations before signal generation
- Reduces false signals and improves signal quality
- Customizable confirmation threshold
### 📊 **Technical Analysis Components**
1. **Trend Analysis** - Multiple moving average types (SMA, EMA, WMA, RMA)
2. **Liquidity Detection** - Identifies key support/resistance levels
3. **Manipulation Patterns** - Detects false moves and liquidity hunts
4. **Order Blocks** - Recognizes institutional order flow patterns
5. **Imbalances** - Identifies price gaps and imbalances
6. **Volume Analysis** - Detects significant volume spikes
### 🔍 **Signal Types**
#### Bullish Confirmations:
- Price above moving average (bullish trend)
- Support level liquidity hunt
- False move down pattern
- Bullish engulfing pattern
- Bullish gap/imbalance
- Volume spike confirmation
#### Bearish Confirmations:
- Price below moving average (bearish trend)
- Resistance level liquidity hunt
- False move up pattern
- Bearish engulfing pattern
- Bearish gap/imbalance
- Volume spike confirmation
## How to Use
### 📋 **Settings Configuration**
1. **Signal Configuration:**
- Set minimum confirmations (2-5 signals)
- Enable/disable status table display
2. **Visual Display:**
- Toggle liquidity levels visibility
- Show/hide manipulation zones
- Optional moving average line display
3. **Moving Average Settings:**
- Choose MA period (1-500, default: 200)
- Select MA type (SMA, EMA, WMA, RMA)
### 🎯 **Entry Management**
- Automatic entry level calculation (25% retracement from signal candle)
- Entry timeout after 10 bars to avoid stale signals
- Clear entry confirmation markers on chart
### 📈 **Visual Elements**
- **Green Triangle Up**: Buy signal generated
- **Red Triangle Down**: Sell signal generated
- **Yellow Lines**: Entry levels awaiting execution
- **"ENTRY" Labels**: Entry level triggered
- **Dashed Lines**: Key liquidity levels
- **Colored Boxes**: Manipulation zones (FM = False Move)
## Alert System
The indicator provides four types of alerts:
1. **Buy Signal Generated** - When bullish confirmations meet threshold
2. **Sell Signal Generated** - When bearish confirmations meet threshold
3. **Buy Entry Triggered** - When price reaches calculated buy entry level
4. **Sell Entry Triggered** - When price reaches calculated sell entry level
## Status Information Panel
The indicator includes a comprehensive status table showing:
- Current market trend direction
- Number of bullish confirmations active
- Number of bearish confirmations active
- Required confirmation threshold
- Current position status (awaiting buy/sell/none)
## Best Practices
### ✅ **Recommended Usage**
- Use higher timeframes (4H, Daily) for stronger signals
- Combine with proper risk management and position sizing
- Wait for entry level confirmation before taking trades
- Consider market context and overall trend direction
### ⚠️ **Risk Management**
- This indicator is for educational and analytical purposes
- Always use proper stop-loss and take-profit levels
- Do not risk more than you can afford to lose
- Backtest thoroughly before live trading
### 🔧 **Optimization Tips**
- Adjust confirmation requirements based on market volatility
- Higher confirmations = fewer but higher quality signals
- Lower confirmations = more signals but potentially more noise
- Test different MA periods for your specific market/timeframe
## Technical Specifications
- **Pine Script Version**: v5
- **Overlay**: Yes (displays on price chart)
- **Maximum Bars Back**: 100 (optimized for performance)
- **Repainting**: No (signals are final once bar closes)
## Educational Disclaimer
This indicator is designed for educational and informational purposes only. It should not be used as the sole basis for trading decisions. Always conduct your own analysis, consider multiple factors, and implement proper risk management strategies. Past performance does not guarantee future results.

Daniel SnipeDaniel Snipe Indicator Lets you trade while using BOS and smart money concepts, it reads price action both on the 15m, 30m and all time frames available

Live Trade Table [NuengChill]signal for live trade score
when you live trade you can add signal as you trade
table
1. trade number
2. type Buy or sell waiting
3. entry price
4. TP1 , TP2
5. SL
6. win/ Lose result
7. statue => Active , SL hit , TP hit , TP2 hit

CQ_Historical Candle Color Changer🎯 Purpose
This indicator visually distinguishes candles based on how old they are—specifically within a user-defined range (e.g., 1 to 7 days old). It helps traders quickly isolate recent price action from older data, making it easier to interpret overlays like moving averages, volume profiles, or momentum indicators.
⚙️ Key Features
- User-Defined Age Range: Set minimum and maximum age in days (e.g., highlight candles that are 1–7 days old).
- Custom Colors: Choose highlight colors for candles within the range.
- Timeframe Awareness: Works across any chart timeframe (1m, 1h, 1D, etc.), calculating candle age based on actual time elapsed.
- Non-Intrusive Display: Candles outside the range retain their default appearance, preserving overall chart readability.
📐 How It Works
- The script calculates the age of each candle by comparing its timestamp to the current time.
- If the candle falls within the user-defined age range, it’s recolored using the selected style.
- Candles older or newer than the range are left untouched.
🧠 Use Cases
- Trend Isolation: Focus on recent price action without losing sight of broader context.

Bank Strategy v1 Pro # Bank Strategy v1 Pro - Advanced Institutional Trading System
## Overview
Bank Strategy v1 Pro is a sophisticated institutional-grade trading indicator designed for professional traders who understand advanced market microstructure concepts. This system implements the precise methodologies used by institutional traders to identify high-probability reversal opportunities through liquidity manipulation patterns.
## Core Methodology
### 🏦 **Institutional Trading Framework**
This strategy is built upon the fundamental principle that institutional players (banks, hedge funds, market makers) create specific patterns when accumulating or distributing positions. The indicator identifies these patterns through:
- **Liquidity Manipulation Sequences** - Detection of deliberate stop-loss hunting
- **False Move (FU) Patterns** - Identification of engineered price movements
- **Order Block Analysis** - Recognition of institutional accumulation/distribution zones
- **Imbalance Trading** - Exploitation of price inefficiencies
- **Market Structure Context** - Trend-based signal filtering
### 📊 **Advanced Signal Components**
#### 1. **Liquidity Zone Identification**
- Automated detection of swing highs/lows where retail stops accumulate
- Dynamic liquidity level tracking with 30-bar extension
- Real-time monitoring of liquidity sweeps and hunts
#### 2. **False Move (FU) Pattern Recognition**
- **Bullish FU**: High manipulation → Close below previous low (bearish trap)
- **Bearish FU**: Low manipulation → Close above previous high (bullish trap)
- Institutional reversal confirmation after liquidity grab
#### 3. **Order Block Detection**
- Bullish Engulfing: Strong institutional buying after bearish candle
- Bearish Engulfing: Strong institutional selling after bullish candle
- 20-bar forward projection for order block validity
#### 4. **Price Imbalance Analysis**
- Bullish Imbalance: Gap up indicating buying pressure
- Bearish Imbalance: Gap down indicating selling pressure
- 15-bar tracking with automatic labeling
## Signal Generation Logic
### 🎯 **Entry Criteria**
**Buy Signal Requirements:**
- Bearish FU pattern detected (liquidity grab below previous low)
- Price above 200 SMA (bullish market context)
- Liquidity lows available for targeting
- Signal confirmation enabled
**Sell Signal Requirements:**
- Bullish FU pattern detected (liquidity grab above previous high)
- Price below 200 SMA (bearish market context)
- Liquidity highs available for targeting
- Signal confirmation enabled
### 📈 **Advanced Entry Management**
- **Entry Level**: 50% retracement of manipulation candle body
- **Stop Loss**: 20% extension below/above manipulation range
- **Take Profit**: Configurable risk-reward ratio (1:1 to 1:5)
- **Timeout**: 15-bar automatic signal expiry
## Professional Features
### 🔧 **Customizable Parameters**
- **Signal Control**: Independent buy/sell signal toggles
- **Visual Elements**: Modular display of order blocks, imbalances, liquidity zones
- **Risk Management**: Adjustable risk-reward ratios up to 1:5
- **Market Structure**: Configurable swing length (3-20 periods)
- **MA Filter**: Optional 200 SMA trend context
### 📊 **Real-Time Status Monitoring**
Professional status table displaying:
- Current market trend direction
- Liquidity availability status
- Active entry waiting status
- Risk-reward configuration
- System health indicators
### 🚨 **Professional Alert System**
- **Signal Alerts**: Instant notification of buy/sell opportunities
- **Entry Alerts**: Confirmation when entry levels are reached
- **Custom Messages**: Detailed alert descriptions for trade management
## Advanced Visual Analysis
### 🎨 **Color-Coded Elements**
- **Green Boxes**: Bullish order blocks (institutional buying zones)
- **Red Boxes**: Bearish order blocks (institutional selling zones)
- **Blue/Orange Boxes**: Price imbalances requiring fill
- **Purple Boxes**: FU patterns with directional labels
- **Dotted Lines**: Key liquidity levels with labels
- **Yellow Lines**: Pending entry levels
### 📍 **Professional Labeling**
- Clear identification of all pattern types
- Directional bias indicators
- Entry confirmation markers
- Liquidity level annotations
## Risk Management Framework
### ⚠️ **Professional Trading Guidelines**
- **Timeframe Recommendation**: 4H+ for institutional signal reliability
- **Position Sizing**: Risk no more than 1-2% per signal
- **Confirmation**: Wait for entry level hits before position entry
- **Context**: Always consider overall market structure and sentiment
### 🛡️ **Built-in Protections**
- Automatic signal timeout prevents stale entries
- Trend context filtering reduces counter-trend risks
- Liquidity requirement ensures sufficient market depth
- Risk-reward enforcement maintains positive expectancy
## Performance Optimization
### ⚡ **Technical Specifications**
- **Pine Script v5**: Latest version compatibility
- **Resource Limits**: Optimized for 500 bars, 200 lines, 100 boxes, 200 labels
- **Processing**: Efficient array management for liquidity tracking
- **Memory**: Automatic cleanup of expired signals and objects
### 🎯 **Signal Quality**
- High-probability setups through multi-factor confirmation
- Institutional pattern recognition reduces retail noise
- Trend context filtering improves win rate
- Professional entry timing reduces slippage
## Educational Framework
### 📚 **Institutional Concepts**
This indicator teaches professional trading concepts:
- Market microstructure understanding
- Institutional order flow analysis
- Liquidity-based trading strategies
- Professional risk management techniques
### 🎓 **Skill Development**
- Pattern recognition training
- Market structure analysis
- Trade timing optimization
- Risk management discipline
## Disclaimer
This indicator is designed for professional traders with experience in institutional trading concepts. It requires understanding of market microstructure, liquidity dynamics, and professional risk management. Past performance does not guarantee future results. Always implement proper risk management and consider multiple analysis factors before making trading decisions.
## Compatibility
- **Markets**: Forex, Indices, Cryptocurrencies, Commodities
- **Timeframes**: Optimized for 1H and above (4H+ recommended)
- **Platform**: TradingView Pine Script v5
- **Features**: Full alert integration, customizable display options

VIDYA with trend centered SDs with Chandelier Exit By KidevThis multi-tool overlay combines adaptive averaging, volatility envelopes, and structural swing detection into a single, configurable indicator.
Features
• Selectable MA75 — choose SMA / EMA / WMA / VWMA / HMA as the 75-length baseline.
• MA Trend Mode — optional up/side/down regime coloring driven by MA slope (configurable colors).
• VIDYA (Variable Index Dynamic Average) — adaptive moving average with cross (C>V / CV / C

Weekly Fibonacci Pivot Levelsthis indicator in simple ways, draw the weekly fibo zones based on calculations
weekly zones are drawn automatically based on previous week, and are updated once a new week is opened
you can use it the way you like or adapt to your trading strategy
i really use it at extremes and when a divergence is occurring in these zones

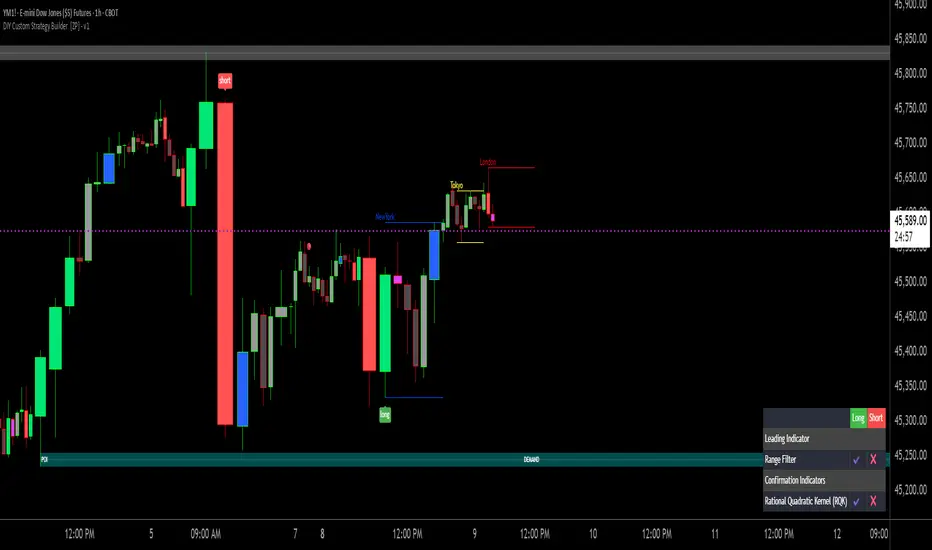
Confluence Engine Confluence Engine is a practical, non-repainting decision aid that scores market conditions from −100…+100 by combining six proven modules: Trend, Momentum, Volatility, Volume, Structure, and an HTF confirmation. It’s designed for crypto, forex, indices, and stocks, and it fires entries only on confirmed bar closes.
What’s inside
Trend: EMA 20/50/200 alignment plus a Supertrend/KAMA toggle (you choose the baseline).
Momentum: RSI + MACD with confirmed-pivot divergence detection.
Volatility: ATR% and Bollinger Band width vs its average to favor expansion over chop.
Volume: OBV-style cumulative flow slope + volume surge vs SMA×multiplier.
Market Structure: Confirmed pivots, BOS (break of structure) and CHOCH (change of character).
HTF Filter: Closed higher-timeframe context via request.security(..., barmerge.gaps_on, barmerge.lookahead_off).
Why it does not repaint
Signals are computed and plotted on closed bars only.
Pivots/divergences use confirmed pivot points (no forward look).
HTF series are fetched with lookahead_off and use the last closed HTF bar in realtime.
No future bar references are used for entries or alerts.
How to use (3 steps)
Pick a timeframe pair: use a 4–6× HTF multiplier (5m→30m, 15m→1h, 1h→4h, 4h→1D, 1D→1W).
Trade with the HTF: take longs only when the HTF filter is bullish; shorts only when bearish.
Prefer expansion: act when BB width > its average and ATR% is elevated; skip most signals in compression.
Suggested presets (start here)
Crypto (BTC/ETH): 15m→1h, 1h→4h. stLen=10, stMult=3.0, bbLen=20, surgeMul=1.8–2.2, thresholds +40 / −40 (intraday can try +35 / −35).
Forex majors: 15m→1h, 1h→4h. stLen=10–14, stMult=2.5–3.0, surgeMul=1.5–1.8, thresholds +35 / −35 (swing: +45 / −45).
US equities (liquid): 5m→30m/1h, 15m→1h/2h. stMult=3.0–3.5, surgeMul=1.6–2.0, thresholds +45 / −45 to reduce chop.
Indices (ES/NQ): 5m→30m, 15m→1h. Defaults are fine; start at +40 / −40.
Gold/Oil: 15m→1h, 1h→4h. Thresholds +35 / −35, surgeMul=1.6–1.9.
Inputs (plain English)
Use Supertrend (off = KAMA): choose the trend baseline.
EMA Fast/Mid/Slow: 20/50/200 by default for classic stack.
RSI/MACD + divergence pivots: momentum and exhaustion context.
ATR Length & BB Length: volatility regime detection.
Volume SMA & Surge Multiplier: defines “meaningful” volume spikes.
Pivot left/right & “Confirm BOS/CHOCH on Close”: structure strictness.
Enable HTF & Higher Timeframe: confirms the lower timeframe direction.
Thresholds (+long / −short): when the score crosses these, you get signals.
Signals & alerts (IDs preserved)
Entry shapes plot at bar close when the score crosses thresholds.
Alerts you can enable:
CONFLUENCE LONG — long entry signal
CONFLUENCE SHORT — short entry signal
BULLISH BIAS — score turned positive
BEARISH BIAS — score turned negative
Best practices
Focus on signals with HTF agreement and volatility expansion; require volume participation (surge or rising OBV slope) for higher quality.
Raise thresholds (+45/−45 or +50/−50) to reduce whipsaws in choppy sessions.
Lower thresholds (+35/−35) only if you also require volatility/volume filters.
Performance & scope
Works across crypto/FX/equities/indices; no broker data or special feeds required.
No repainting by design; signals/alerts are computed on closed bars.
As with any tool, results vary by regime; always combine with risk management.
Disclosure
This script is for educational purposes only and is not financial advice. Trading involves risk. Test on historical data and paper trade before using live.

DNSE VN301!, ADX Momentum StrategyDiscover the tailored Pine Script for trading VN30F1M Futures Contracts intraday.
This strategy applies the Statistical Method (IQR) to break down the components of the ADX, calculating the threshold of "normal" momentum fluctuations in price to identify potential breakouts for entry and exit signals. The script automatically closes all positions by 14:30 to avoid overnight holdings.
www.tradingview.com
Settings & Backtest Results:
- Chart: 30-minute timeframe
- Initial capital: VND 100 million
- Position size: 4 contracts per trade (includes trading fees, excludes tax)
- Backtest period: Sep-2021 to Sep-2025
- Return: over 270% (with 5 ticks slippage)
- Trades executed: 1,000+
- Win rate: ~40%
- Profit factor: 1.2
Default Script Settings:
Calculates the acceleration of changes in the +DI and -DI components of the ADX, using IQR to define "normal" momentum fluctuations (adjustable via Lookback period).
Calculates the difference between each bar’s Open and Close prices, using IQR to define "normal" gaps (adjustable via Lookback period).
Entry & Exit Conditions:
Entry Long: Change in +DI or -DI > Avg IQR Value AND Close Price > Previous Close
Exit Long: (all 4 conditions must be met)
- Change in +DI or -DI > Avg IQR Value
- RSI < Previous RSI
- Close–Open Gap > Avg IQR Gap
- Close Price < Previous Close
Entry Short: Change in +DI or -DI > Avg IQR Value AND Close Price < Previous Close
Exit Short: (all 4 conditions must be met)
- Change in +DI or -DI > Avg IQR Value
- RSI > Previous RSI
- Close–Open Gap > Avg IQR Gap
- Close Price > Previous Close
Disclaimers:
Trading futures contracts carries a high degree of risk, and price movements can be highly volatile. This script is intended as a reference tool only. It should be used by individuals who fully understand futures trading, have assessed their own risk tolerance, and are knowledgeable about the strategy’s logic.
All investment decisions are the sole responsibility of the user. DNSE bears no liability for any potential losses incurred from applying this strategy in real trading. Past performance does not guarantee future results. Please contact us directly if you have specific questions about this script.

RSI OB/OSRSI OB/OS Signals indicator
The RSI OB/OS Signals indicator is an analysis and training tool that uses simple statistical learning (rolling correlations and z-scoring) to produce a smoothed, adaptive RSI weighting and signal line intended to highlight probable short-term RSI movements. The script does not attempt black-box machine-learning model export instead, it uses transparent building blocks — returns, RSI, ATR percentage, volume change (log), and raw volume — as predictors to estimate the likely next-bar RSI, then converts that estimate into a bounded “weight” and a smoothed signal line. The objective is educational: show how simple correlation-based weighting of standardized features can serve as an RSI augmentation and help traders identify higher-probability bullish or bearish RSI cross conditions, while making all internal reasoning visible and explainable.
At its core the indicator performs three conceptual steps each bar: first it computes a set of per-bar features aligned to the target (prior bar RSI) — specifically prior-bar log returns, prior-bar RSI, ATR as percent of price, the log change in volume and the prior-bar raw volume.
Second it standardizes these predictors through rolling z-scoring and computes rolling Pearson correlations between each standardized predictor and the target RSI over a user-configurable learning window. These correlations act as signed linear weights: predictors with higher absolute correlation are treated as more informative for that window.
Third it forms a linear prediction by summing correlation × z(feature) across the top correlated predictors, then maps that standardized prediction back to RSI scale using the rolling mean and standard deviation of the target. The mapped prediction is finally converted to a bounded “rsiWeight,” smoothed by a signal moving average, and used to produce bullish/bearish events on crossovers of preconfigured thresholds.
VWAP, buy/sell volume breakdown and simple tracking of the price move since the last signal are also displayed to help traders interpret the quality of signals.
The components are chosen for clear, complementary roles rather than as a random mashup. Prior-bar RSI embodies short-term momentum and is the natural prediction target.
Log returns add price-direction information; ATR percent encodes the intrabar volatility regime (helpful because RSI behaviour differs in high vs low volatility); the volume log-change and raw volume provide a participation signal indicating whether structural moves are supported by real activity. Standardizing predictors and using rolling correlations lets the script adapt its emphasis to the current regime: when volume changes correlate strongly with subsequent RSI moves, the algorithm will weight that predictor more heavily; when returns correlate more, weight shifts accordingly. Because the method is linear, transparent and computed on rolling windows you can reproduce and reason about the weight changes — a key requirement for educational clarity and TradingView compliance.
How to read and use the indicator practically: treat the smoothed rsiWeight line (ma_rsi) and its threshold crossings as an RSI-augmentation alert — not as a standalone automated buy/sell system. A practical workflow is: first inspect the dashboard and confirm the underlying drivers (which predictors show strong z-scores and which had high rolling correlation in the learning window); second check VWAP position and volume split to ensure that the price move is supported; third only consider signals that coincide with your higher-timeframe bias or structural support/resistance.
For example, a bullish crossover (ma_rsi crossing above −0.5) that occurs while VWAP is below price, buy volume share is elevated, and ATR is moderate is a higher-quality setup than the same crossing on thin volume and extreme ATR.
Use ATR or recent swing structure for stop placement and predefine risk per trade. Because the indicator tracks max points since the last signal, you can also use that metric as a simple intraday performance monitor.
Parameter tuning guidance: the learning window (learnLen) controls how quickly the correlation weights adapt; a short window (e.g., 10–20) makes the predictor weights responsive to regime shifts but also noisier; a longer window (e.g., 40–80) smooths weights and emphasizes longer-term relationships.
The rsiLen (target RSI length) should match your intended horizon — 14 is standard and balances responsiveness and smoothness. sigLen controls the smoothing of the predicted RSI weight: lower values make the signal line more reactive (useful for scalping), higher values produce smoother signals (useful for swing trades).
For low-liquidity instruments increase learnLen and sigLen to reduce false alarms; for high-speed intra-day work shorten them. Volume heuristics (volume thresholds) are instrument dependent — calibrate volume formatting and volumetric thresholds for equities versus futures or crypto.
Limitations and failure modes are explicit and important: the feature-selection approach is linear and based on Pearson correlation — it cannot capture nonlinear dependencies or temporal lags beyond the single lag studied, so it may miss relationships that require higher-order features.
The volume split used (close>open vs closeopen vs close

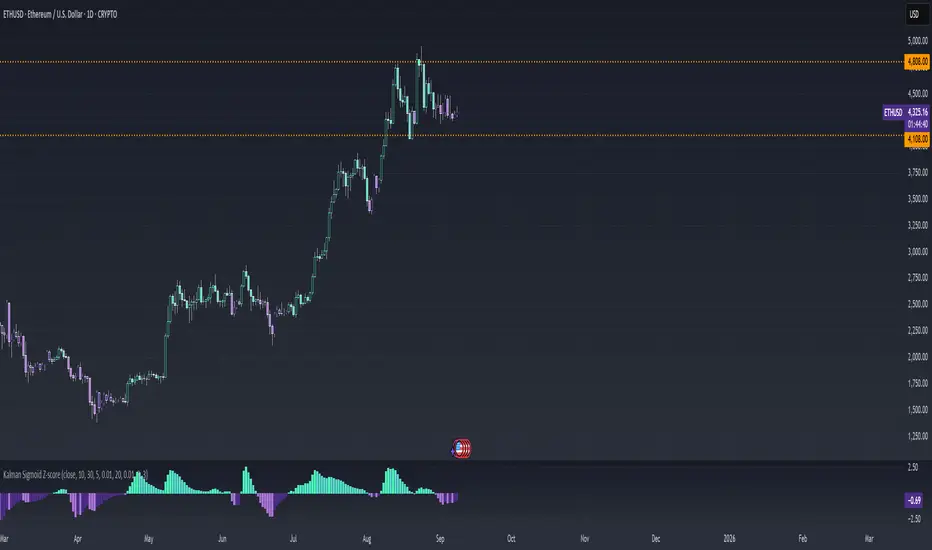
Kalman Sigmoid Z-score | SurgeQuantTitle: Kalman Sigmoid Z-score Indicator
The Kalman Sigmoid Z-score indicator is a sophisticated tool designed to identify market momentum and potential trend changes using a combination of Kalman filtering, sigmoid-weighted averaging, and Z-score calculations. By processing price data through a Kalman filter and applying adaptive sigmoid weighting, this indicator provides clear visual signals for bullish and bearish market conditions. The Z-score output and price bars are dynamically colored to highlight momentum shifts, aiding traders in identifying potential trading opportunities.
How It Works
Kalman Filter Calculation
Computes a smoothed price series using a Kalman filter based on a user-selected price source (Close, High, Low, or Open) with configurable parameters for process noise, measurement noise, and filter order (default: 3).
The Kalman filter reduces noise in the price data, providing a stable foundation for further analysis.
Sigmoid-Weighted Averaging
Applies a sigmoid function to calculate adaptive weights based on price comparisons over a user-defined lookback period (default: 10).
Weights are adjusted dynamically using a volatility ratio (standard deviation over ATR) to account for market conditions, enhancing signal reliability.
Z-score Calculation
Calculates the Z-score of the Kalman-filtered price relative to a sigmoid-weighted moving average over a user-defined period (default: 20).
Bullish Signal: Triggered when the Z-score crosses above 0, indicating potential upward momentum.
Bearish Signal: Triggered when the Z-score crosses below 0, indicating potential downward momentum.
Visual Representation
The indicator provides a clear and customizable visual interface:
Z-score Histogram: Displayed as colored columns, with distinct colors for bullish (Z-score > 0) and bearish (Z-score < 0) conditions.
Bright green (#4DFFBE) for rising Z-score above 0.
Light green (#56DFCF) for falling Z-score above 0.
Dark purple (#AE75DA) for falling Z-score below 0.
Light purple (#4D2D8C) for rising Z-score below 0.
Price Bar Coloring: Synchronizes with the Z-score colors to reflect momentum on the main chart.
Reference Line: A zero line is plotted on the Z-score panel for easy reference.
Customization & Parameters
The Kalman Sigmoid Z-score indicator offers flexible parameters to suit various trading styles:
Source: Select the input price (default: Close; options: Close, High, Low, Open).
Lookback Period: Set the period for sigmoid weight calculations (default: 10).
Volatility Period: Adjust the period for volatility ratio calculation (default: 30).
Base Steepness: Control the sigmoid function’s sensitivity (default: 5).
Base Midpoint: Set the sigmoid function’s midpoint (default: 0.01).
Z-score Period: Define the period for Z-score calculation (default: 20).
Kalman Parameters:
Process Noise (default: 0.01).
Measurement Noise (default: 3).
Filter Order (default: 3).
Color Settings: Predefined colors with distinct shades for bullish and bearish states, ensuring clear visual differentiation.
Trading Applications
This indicator is versatile and can be applied across various markets and strategies:
Momentum Trading: Highlights strong bullish or bearish momentum for potential entry or exit points based on Z-score crossings.
Trend Confirmation: Use bar coloring to confirm Z-score signals with price action on the main chart.
Reversal Detection: Identify potential reversals when the Z-score crosses the zero line.
Scalping and Swing Trading: Adjust parameters (e.g., lookback, Z-score period) to suit short-term or longer-term strategies.
Final Note
The Kalman Sigmoid Z-score indicator is a powerful tool for traders seeking to leverage advanced filtering and statistical analysis for momentum and trend-based opportunities. Its combination of Kalman-filtered price smoothing, sigmoid-weighted averaging, dynamic Z-score signals, and synchronized bar coloring offers a robust framework for informed trading decisions. As with all indicators, backtest thoroughly and integrate into a comprehensive trading strategy for optimal results. This indicator is provided for educational and informational purposes and should not be considered financial advice.
Dynamic Swing Anchored VWAP STRAT (Zeiierman/PineIndicators)Dynamic Swing Anchored VWAP STRATEGY — Zeiierman × PineIndicators (Pine Script v6)
A pivot-to-pivot Anchored VWAP strategy that adapts to volatility, enters long on bullish structure, and closes on bearish structure. Built for TradingView in Pine Script v6.
Full credits to zeiierman.
Repainting notice: The original indicator logic is repainting. Swing labels (HH/HL/LH/LL) are finalized after enough bars have printed, so labels do not occur in real time. It is not possible to execute at historical label points. Treat results as educational and validate with Bar Replay and paper trading before considering any discretionary use.
Concept
The script identifies swing highs/lows over a user-defined lookback ( Swing Period ). When structure flips (most recent swing low is newer than the most recent swing high, or vice versa), a new regime begins.
At each confirmed pivot, a fresh Anchored VWAP segment is started and updated bar-by-bar using an EWMA-style decay on price×volume and volume.
Responsiveness is controlled by Adaptive Price Tracking (APT) . Optionally, APT auto-adjusts with an ATR ratio so that high volatility accelerates responsiveness and low volatility smooths it.
Longs are opened/held in bullish regimes and closed when the regime turns bearish. No short positions are taken by design.
How it works (under the hood)
Swing detection: Uses ta.highestbars / ta.lowestbars over prd to update swing highs (ph) and lows (pl), plus their bar indices (phL, plL).
Regime logic: If phL > plL → bullish regime; else → bearish regime. A change in this condition triggers a re-anchor of the VWAP at the newest pivot.
Adaptive VWAP math: APT is converted to an exponential decay factor ( alphaFromAPT ), then applied to running sums of price×volume and volume, producing the current VWAP estimate.
Rendering: Each pivot-anchored VWAP segment is drawn as a polyline and color-coded by regime. Optional structure labels (HH/HL/LH/LL) annotate the swing character.
Orders: On bullish flips, strategy.entry("L") opens/maintains a long; on bearish flips, strategy.close("L") exits.
Inputs & controls
Swing Period (prd) — Higher values identify larger, slower swings; lower values catch more frequent pivots but add noise.
Adaptive Price Tracking (APT) — Governs the VWAP’s “half-life.” Smaller APT → faster/closer to price; larger APT → smoother/stabler.
Adapt APT by ATR ratio — When enabled, APT scales with volatility so the VWAP speeds up in turbulent markets and slows down in quiet markets.
Volatility Bias — Tunes the strength of APT’s response to volatility (above 1 = stronger effect; below 1 = milder).
Style settings — Colors for swing labels and VWAP segments, plus line width for visibility.
Trade logic summary
Entry: Long when the swing structure turns bullish (latest swing low is more recent than the last swing high).
Exit: Close the long when structure turns bearish.
Position size: qty = strategy.equity / close × 5 (dynamic sizing; scales with account equity and instrument price). Consider reducing the multiplier for a more conservative profile.
Recommended workflow
Apply to instruments with reliable volume (equities, futures, crypto; FX tick volume can work but varies by broker).
Start on your preferred timeframe. Intraday often benefits from smaller APT (more reactive); higher timeframes may prefer larger APT (smoother).
Begin with defaults ( prd=50, APT=20 ); then toggle “Adapt by ATR” and vary Volatility Bias to observe how segments tighten/loosen.
Use Bar Replay to watch how pivots confirm and how the strategy re-anchors VWAP at those confirmations.
Layer your own risk rules (stops/targets, max position cap, session filters) before any discretionary use.
Practical tips
Context filter: Consider combining with a higher-timeframe bias (e.g., daily trend) and using this strategy as an entry timing layer.
First pivot preference: Some traders prefer only the first bullish pivot after a bearish regime (and vice versa) to reduce whipsaw in choppy ranges.
Deviations: You can add VWAP deviation bands to pre-plan partial exits or re-entries on mean-reversion pulls.
Sessions: Session-based filters (RTH vs. ETH) can materially change behavior on futures and equities.
Extending the script (ideas)
Add stops/targets (e.g., ATR stop below last swing low; partial profits at k×VWAP deviation).
Introduce mirrored short logic for two-sided testing.
Include alert conditions for regime flips or for price-VWAP interactions.
Incorporate HTF confirmation (e.g., only long when daily VWAP slope ≥ 0).
Throttle entries (e.g., once per regime flip) to avoid over-trading in ranges.
Known limitations
Repainting: Swing labels and pivot confirmations depend on future bars; historical labels can look “perfect.” Treat them as annotations, not executable signals.
Execution realism: Strategy includes commission and slippage fields, yet actual fills differ by venue/liquidity.
No guarantees: Past behavior does not imply future results. This publication is for research/education only and not financial advice.
Defaults (backtest environment)
Initial capital: 10,000
Commission value: 0.01
Slippage: 1
Overlay: true
Max bars back: 5000; Max labels/polylines set for deep swing histories
Quick checklist
Add to chart and verify that the instrument has volume.
Use defaults, then tune APT and Volatility Bias with/without ATR adaptation.
Observe how each pivot re-anchors VWAP and how regime flips drive entries/exits.
Paper trade across several symbols/timeframes before any discretionary decisions.
Attribution & license
Original indicator concept and logic: Zeiierman — please credit the author.
Strategy wrapper and publication: PineIndicators .
License: CC BY-NC-SA 4.0 (Attribution-NonCommercial-ShareAlike). Respect the license when forking or publishing derivatives.

Script_Algo - Pivot Trend Rider Strategy📌 This strategy aims to enter a trade in the direction of the trend, catching a reversal point at the end of a correction.
The script is unique due to the combination of three key elements:
🔹 Detection of reversal points through searching for local lows and highs
🔹 Trend filter based on SMA for trading only in the trend direction
🔹 Adaptive risk management using ATR for dynamic stop-losses and take-profits
This allows the strategy to work effectively in various market conditions, minimizing false signals and adapting to market volatility.
⚙️ Principle of Operation
The strategy is based on the following logical components:
📈 Entry Signals:
Long: when a local low (pivot low) is detected in an uptrend
Short: when a local high (pivot high) is detected in a downtrend
📉 Position Management:
Stop-loss and take-profit are calculated based on ATR
Automatic reverse switching when an opposite signal appears
📊 Trend Filter:
Uses SMA to determine trend direction (can be disabled if needed)
🔧 Default Settings
Pivot detection: 11 bars
SMA filter length: 16 periods
ATR period: 14
SL multiplier: 2.5
TP multiplier: 10
Trend filter: enabled
🕒 Usage Recommendations
Timeframe: from 1 hour and above
Assets: cryptocurrency pairs, stocks
🤖 Trading Automation
This script is fully ready for integration with cryptocurrency exchanges via Webhook.
📊 Backtest Results
As seen from testing results, over 4.5 years this strategy could have potentially generated about $5000 profit or 50% of initial capital on the NAERUSDT crypto pair on the 4H timeframe.
Position size: $1000
Max drawdown: $1400
Total trades: 376
Win rate: 38%
Profit factor: 1.34
⚠️ Disclaimer
Please note that the results of the strategy are not guaranteed to repeat in the future. The market constantly changes, and no algorithm can predict exactly how an asset will behave.
The author of this strategy is not responsible for any financial losses associated with using this script.
All trading decisions are made solely by the user.
Trading financial markets carries high risks and can lead to loss of your investments.
Before using the strategy, it is strongly recommended to:
✅ Backtest the strategy on historical data
✅ Start with small trading volumes
✅ Use only risk capital you are ready to lose
✅ Fully understand how the strategy works
🔮 Further Development
The strategy will continue to evolve and improve. Planned updates include:
Adding additional filters to reduce false signals
Optimizing position management algorithms
Expanding functionality for various market conditions
💡 Wishing everyone good luck and profitable trading!
📈 May your charts be green and your portfolios keep growing!
Developed by Script_Algo | MIT License | Version 1.0

Cumulative Returns by Session [BackQuant]Cumulative Returns by Session
What this is
This tool breaks the trading day into three user-defined sessions and tracks how much each session contributes to return, volatility, and volume. It then aggregates results over a rolling window so you can see which session has been pulling its weight, how streaky each session has been, and how sessions relate to one another through a compact correlation heatmap.
We’ve also given the functionality for the user to use a simplified table, just by switching off all settings they are not interested in.
How it works
1) Session segmentation
You define APAC, EU, and US sessions with explicit hours and time zones. The script detects when each session starts and ends on every intraday bar and records its open, intraday high and low, close, and summed volume.
2) Per-session math
At each session end the script computes:
Return — either Percent: (Close−Open)÷Open×100(Close − Open) ÷ Open × 100(Close−Open)÷Open×100 or Points: (Close−Open)(Close − Open)(Close−Open), based on your selection.
Volatility — either Range: (High−Low)÷Open×100(High − Low) ÷ Open × 100(High−Low)÷Open×100 or ATR scaled by price: ATR÷Open×100ATR ÷ Open × 100ATR÷Open×100.
Volume — total volume transacted during that session.
3) Storage and lookback
Each day’s three session stats are stored as a row. You choose how many recent sessions to keep in memory. The script then:
Builds cumulative returns for APAC, EU, US across the lookback.
Computes averages, win rates, and a Sharpe-like ratio avgreturn÷avgvolatilityavg return ÷ avg volatilityavgreturn÷avgvolatility per session.
Tracks streaks of positive or negative sessions to show momentum.
Tracks drawdowns on cumulative returns to show worst runs from peak.
Computes rolling means over a short window for short-term drift.
4) Correlation heatmap
Using the stored arrays of session returns, the script calculates Pearson correlations between APAC–EU, APAC–US, and EU–US, and colors the matrix by strength and sign so you can spot coupling or decoupling at a glance.
What it plots
Three lines: cumulative return for APAC, EU, US over the chosen lookback.
Zero reference line for orientation.
A statistics table with cumulative %, average %, positive session rate, and optional columns for volatility, average volume, max drawdown, current streak, return-to-vol ratio, and rolling average.
A small correlation heatmap table showing APAC, EU, US cross-session correlations.
How to use it
Pick the asset — leave Custom Instrument empty to use the chart symbol, or point to another symbol for cross-asset studies.
Set your sessions and time zones — defaults approximate APAC, EU, and US hours, but you can align them to exchange times or your workflow.
Choose calculation modes — Percent vs Points for return, Range vs ATR for volatility. Points are convenient for futures and fixed-tick assets, Percent is comparable across symbols.
Decide the lookback — more sessions smooths lines and stats; fewer sessions makes the tool more reactive.
Toggle analytics — add volatility, volume, drawdown, streaks, Sharpe-like ratio, rolling averages, and the correlation table as needed.
Why session attribution helps
Different sessions are driven by different flows. Asia often sets the overnight tone, Europe adds liquidity and direction changes, and the US session can dominate range expansion. Separating contributions by session helps you:
Identify which session has been the main driver of net trend.
Measure whether volatility or volume is concentrated in a specific window.
See if one session’s gains are consistently given back in another.
Adapt tactics: fade during a mean-reverting session, press during a trending session.
Reading the tables
Cumulative % — sum of session returns over the lookback. The sign and slope tell you who is carrying the move.
Avg Return % and Positive Sessions % — direction and hit rate. A low average but high hit rate implies many small moves; the reverse implies occasional big swings.
Avg Volatility % — typical intrabars range for that session. Compare with Avg Return to judge efficiency.
Return/Vol Ratio — return per unit of volatility. Higher is better for stability.
Max Drawdown % — worst cumulative give-back within the lookback. A quick way to spot riskiness by session.
Current Streak — consecutive up or down sessions. Useful for mean-reversion or regime awareness.
Rolling Avg % — short-window drift indicator to catch recent turnarounds.
Correlation matrix — green clusters indicate sessions tending to move together; red indicates offsetting behavior.
Settings overview
Basic
Number of Sessions — how many recent days to include.
Custom Instrument — analyze another ticker while staying on your current chart.
Session Configuration and Times
Enable or hide APAC, EU, US rows.
Set hours per session and the specific time zone for each.
Calculation Methods
Return Calculation — Percent or Points.
Volatility Calculation — Range or ATR; ATR Length when applicable.
Advanced Analytics
Correlation, Drawdown, Momentum, Sharpe-like ratio, Rolling Statistics, Rolling Period.
Display Options and Colors
Show Statistics Table and its position.
Toggle columns for Volatility and Volume.
Pick individual colors for each session line and row accents.
Common applications
Session bias mapping — find which window tends to trend in your market and plan exposure accordingly.
Strategy scheduling — allocate attention or risk to the session with the best return-to-vol ratio.
News and macro awareness — see if correlation rises around central bank cycles or major data releases.
Cross-asset monitoring — set the Custom Instrument to a driver (index future, DXY, yields) to see if your symbol reacts in a particular session.
Notes
This indicator works on intraday charts, since sessions are defined within a day. If you change session clocks or time zones, give the script a few bars to accumulate fresh rows. Percent vs Points and Range vs ATR choices affect comparability across assets, so be consistent when comparing symbols.
Session context is one of the simplest ways to explain a messy tape. By separating the day into three windows and scoring each one on return, volatility, and consistency, this tool shows not just where price ended up but when and how it got there. Use the cumulative lines to spot the steady driver, read the table to judge quality and risk, and glance at the heatmap to learn whether the sessions are amplifying or canceling one another. Adjust the hours to your market and let the data tell you which session deserves your focus.

Custom Strategy Builder [CLAMENZA] i changed this indicator to make the market session lines thicker and font bigger as well.

Euler-Lagrange Bands [AGP] Ver.1.0Euler-Lagrange Bands : A Modern Approach to Volatility and Trend Analysis
indicator is an innovative technical analysis tool that uses a Kalman Filter to create dynamic and price-sensitive volatility bands. Unlike traditional Bollinger Bands or Keltner Channels, which rely on moving averages, this approach applies advanced engineering and mathematical principles to intelligently smooth price data. This reduces market noise and provides a clearer view of an asset's boundaries and its fair value.
Key Features
Dynamic and Smoothed Bands: The upper and lower bands adapt in real time to market volatility, offering a fluid and precise channel for identifying overbought and oversold zones.
"Fair Value" Midpoint: The indicator calculates and displays a midpoint that serves as a "fair value" reference. This is crucial for assessing whether the current price is over- or undervalued.
Multidimensional Analysis: It integrates with RSI and volume analysis to provide a comprehensive market view. The floating RSI and volume labels change color, offering quick and effective visual alerts.
Clear Visual Signals: The indicator draws shapes on the chart to mark band crosses, potential reversals, and trend confirmations. Additionally, the candlestick color changes to indicate whether the price is above or below the midpoint.
Real-Time Information Panel: A table in the top corner displays the exact values of the bands and the midpoint, giving you all the crucial information at a glance without cluttering the chart. The table's cell colors also change to alert you to price crosses.
Logic and Adjustments
The elb_process_noise and elb_measurement_noise values are fixed in this code to optimize band performance.
The only parameter the user can change from the indicator's settings in TradingView is length_periods, which allows for adjusting the bands' lookback period without altering the algorithm's sophisticated filtering logic.
The default values have been selected to provide an optimal balance between the indicator's stability and responsiveness, aiming to avoid false signals and ensure accurate market tracking.
How to Use It
This indicator is ideal for traders looking for a more sophisticated alternative to conventional volatility bands. It can be used to:
Identify an asset's price range.
Detect potential reversals when the price reaches or crosses the bands.
Confirm trend strength with volume and RSI analysis.
Make decisions based on the price's relationship to its "Fair Value."
Disclaimer
WARNING: This indicator is provided for educational and technical analysis purposes only. It does not constitute, and should not be interpreted as, financial advice. The buying and selling of financial instruments involve significant risk, and losses may exceed deposits. The past performance of any indicator or strategy is not a guarantee of future results. Users must conduct their own research, exercise due diligence, and consider their personal financial situation before making any investment decisions. The code's creator is not responsible for any losses or damages that may arise from the use of this indicator.

Trend FriendTrend Friend — What it is and how to use it
I built Trend Friend to stop redrawing the same trendlines all day. It automatically connects confirmed swing points (fractals) and keeps the most relevant lines in front of you. The goal: give you clean, actionable structure without the guesswork.
What it does (in plain English)
Finds swing highs/lows using a Fractal Period you choose.
Draws auto-trendlines between the two most recent confirmed highs and the two most recent confirmed lows.
Colours by intent:
Lines drawn from highs (potential resistance / bearish) = Red
Lines drawn from lows (potential support / bullish) = Green
Keeps the chart tidy: The newest lines are styled as “recent,” older lines are dimmed as “historical,” and it prunes anything beyond your chosen limit.
Optional crosses & alerts: You can highlight when price closes across the most recent line and set alerts for new lines formed and upper/lower line crosses.
Structure labels: It tags HH, LH, HL, LL at the swing points, so you can quickly read trend/rotation.
How it works (under the hood)
A “fractal” here is a confirmed pivot: the highest high (or lowest low) with n bars on each side. That means pivots only confirm after n bars, so signals are cleaner and less noisy.
When a new pivot prints, the script connects it to the prior pivot of the same type (high→high, low→low). That gives you one “bearish” line from highs and one “bullish” line from lows.
The newest line is marked as recent (brighter), and the previous recent line becomes historical (dimmed). You can keep as many pairs as you want, but I usually keep it tight.
Inputs you’ll actually use
Fractal Period (n): this is the big one. It controls how swingy/strict the pivots are.
Lower n → more swings, more lines (faster, noisier)
Higher n → fewer swings, cleaner lines (slower, swing-trade friendly)
Max pair of lines: how many pairs (up+down) to keep on the chart. 1–3 is a sweet spot.
Extend: extend lines Right (my default) or Both ways if you like the context.
Line widths & colours: recent vs. historical are separate so you can make the active lines pop.
Show crosses: toggle the X markers when price crosses a line. I turn this on when I’m actively hunting breakouts/retests.
Reading the chart
Red lines (from highs): I treat these as potential resistance. A clean break + hold above a red line often flips me from “fade” to “follow.”
Green lines (from lows): Potential support. Same idea in reverse: break + hold below and I stop buying dips until I see structure reclaim.
HH / LH / HL / LL dots: quick read on structure.
HH/HL bias = uptrend continuation potential
LH/LL bias = downtrend continuation potential
Mixed prints = rotation/chop—tighten risk or wait for clarity.
My H1 guidance (fine-tuning Fractal Period)
If you’re mainly on H1 (my use case), tune like this:
Fast / aggressive: n = 6–8 (lots of signals, good for momentum days; more chop risk)
Balanced (recommended): n = 9–12 (keeps lines meaningful but responsive)
Slow / swing focus: n = 13–21 (filters noise; better for trend days and higher-TF confluence)
Rule of thumb: if you’re getting too many touches and whipsaws, increase n. If you’re late to obvious breaks, decrease n.
How I trade it (example workflow)
Pick your n for the session (H1: start at 9–12).
Mark the recent red & green lines. That’s your immediate structure.
Look for interaction:
Rejections from a line = fade potential back into the range.
Break + close across a line = watch the retest for continuation.
Confirm with context: session bias, HTF structure, and your own tools (VWAP, RSI, volume, FVG/OB, etc.).
Plan the trade: enter on retest or reclaim, stop beyond the line/last swing, target the opposite side or next structure.
Alerts (set and forget)
“New trendline formed” — fires when a new high/low pivot confirms and a fresh line is drawn.
“Upper/lower trendline crossed” — fires when price crosses the most recent red/green line.
Use these to track structure shifts without staring at the screen.
Good to know (honest limitations)
Confirmation lag: pivots need n bars on both sides, so signals arrive after the swing confirms. That’s by design—less noise, fewer fake lines.
Lines update as structure evolves: when a new pivot forms, the previous “recent” line becomes “historical,” and older ones can be removed based on your max setting.
Not an auto trendline crystal ball: it won’t predict which line holds or breaks—it just keeps the most relevant structure clean and up to date.
Final notes
Works on any timeframe; I built it with H1 in mind and scale to H4/D1 by increasing n.
Pairs nicely with session tools and VWAP for intraday, or with supply/demand / FVGs for swing planning.
Risk first: lines are structure, not guarantees. Manage position size and stops as usual.
Not financial advice. Trade your plan. Stay nimble.

Weekly opening targets +-5%## Summary
This indicator automatically plots key percentage-based price levels above and below the current week's opening price. It is designed to provide traders with a clear map of potential intra-week support, resistance, and target zones based on clean, mathematical levels.
The script is lightweight and focuses on providing a clutter-free visual guide, making it easy to identify significant price areas at a glance.
## Features
Weekly Open Pivot: A central blue line clearly marks the opening price for the current week, acting as the primary baseline for all calculations.
Precise 1% Levels: The indicator calculates and draws horizontal lines at exact 1% increments away from the weekly open, covering a range from +/- 1% up to +/- 5%.
Color-Coded Zones: Levels above the weekly open are colored green (representing potential resistance or target zones), while levels below are colored red (representing potential support).
Real-Time Price Labels: To ensure clarity, clean labels are displayed on the right-hand side of the chart. Each label shows both its percentage deviation and the exact price, updating automatically with the latest data.
## How to Use
This tool is versatile, but here are a few common applications:
Identifying Support & Resistance: The primary use is to watch for price reactions at these calculated levels. A bounce off a lower (red) level could signal support, while a rejection from an upper (green) level could signal resistance.
Setting Profit Targets: The levels serve as excellent, non-subjective price targets. For example, if you enter a long position near the weekly open, the +1% and +2% levels are logical areas to consider taking profit.
Gauging Weekly Momentum: The distance price travels between these levels can help gauge the strength of the weekly trend. Consistently breaking through levels indicates strong momentum, while failing to do so may suggest consolidation.
This indicator is particularly useful for day traders and swing traders who use the weekly open as a key reference point for market sentiment and direction.
