Becak I-series: Indicator Floating Panels v.80Becak I-series: Floating Panels v.80th (Indonesia Independence Days)
What it does:
This indicator creates three floating overlay panels that display MACD, RSI, and Stochastic oscillators directly on your price chart. Unlike traditional separate panes, these panels hover over your chart with customizable positioning and transparency, providing a clean, space-efficient way to monitor multiple technical indicators simultaneously.
When to use:
When you need to monitor momentum, trend strength, and overbought/oversold conditions without cluttering your workspace
Perfect for traders who want quick visual access to multiple oscillators while maintaining focus on price action
Ideal for any timeframe and asset class (stocks, crypto, forex, commodities)
How it works:
The script calculates standard MACD (12,26,9), RSI (14), and Stochastic (14,3,3) values, then renders them as floating panels with:
MACD Panel: Shows MACD line (blue), Signal line (orange), and histogram (green/red bars)
RSI Panel: Displays RSI line (purple) with overbought (70) and oversold (30) reference levels
Stochastic Panel: Shows %K (blue) and %D (orange) lines with optional buy/sell signals and highlighted overbought/oversold zones
Customization options:
Position: Choose Top, Bottom, or Auto-Center placement
Size: Adjust panel height (15-35% of chart) and spacing between panels
Positioning: Fine-tune vertical center offset and horizontal positioning
Appearance: Toggle panel backgrounds and adjust transparency (50-95%)
Parameters: Modify all indicator lengths and overbought/oversold levels
Signals: Enable/disable Stochastic crossover signals
Display: Control lookback period (30-100 bars) and right margin spacing
Universal compatibility: Works seamlessly across all asset types with automatic range detection and scaling.
DIRGAHAYU HARI KEMERDEKAAN KE 80 - INDONESIA ... MERDEKA!!!!!
Indicators and strategies

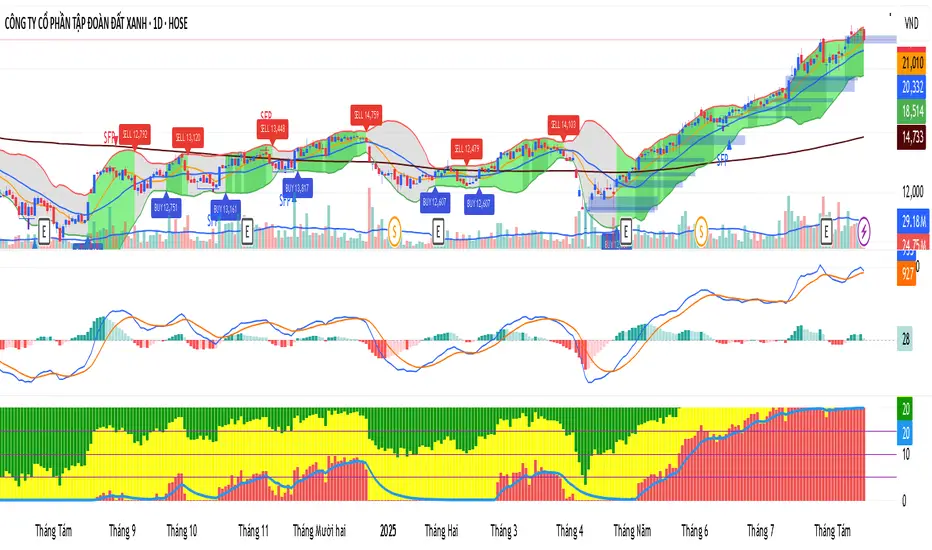
Elliott Wave Advanced Auto [CongTrader]🧾 INDICATOR DESCRIPTION
📌 Indicator: Elliott Wave Advanced Auto
Elliott Wave Advanced Auto is a professional automatic wave detection tool designed by CongTrader. It helps traders analyze market structure using Elliott Wave Theory, including:
📈 Automatic detection of impulsive waves (1-2-3-4-5)
🔷 Identification of triangle correction patterns (ABCDE)
⚠️ Detection of ending diagonal formations
🔮 Forecasting potential Wave 5 extension based on Fibonacci ratio
📊 Visually connecting waves with clean and clear lines
This indicator brings Elliott Wave analysis closer to all traders — whether beginner or advanced.
💡 How to Use It:
Add the indicator to your chart on TradingView.
Adjust Pivot Length to control the sensitivity of pivot detection.
Watch for wave labels (1 to 5 or A to E) appearing automatically on swing highs/lows.
Use signals to make trading decisions:
Wave 3 is often the strongest → possible entry point.
Wave 5 forecast gives a projected exit zone.
Ending Diagonal and Triangles warn of upcoming reversals.
Combine with other indicators (e.g., RSI, volume, support/resistance) for confirmation.
🎯 Features:
Automatic Elliott Wave labeling (1–5 / ABCDE)
Supports both bullish and bearish structures
Auto-line drawing between pivot points
Triangle pattern recognition (ABCDE)
Ending Diagonal pattern detection
Wave 5 forecast using 0.618 Fibonacci projection
Minimalist and clean layout, non-intrusive design
🙏 Credits & Thank You:
This indicator was developed by @CongTrader, a trader passionate about price action and algorithmic trading tools.
I hope this tool helps you improve your market timing and confidence in Elliott Wave analysis.
👉 If you find it helpful, don’t forget to leave a ⭐ or a kind comment to support!
⚠️ Disclaimer:
This script is for educational purposes only and does not constitute financial advice.
Use it with discretion and always validate with other tools.
You are responsible for your own trades. The author is not liable for any financial loss.#ElliottWave #WaveAnalysis #TechnicalAnalysis
#TradingViewScript #AutoElliott #WaveDetector
#TradingStrategy #PriceAction #CongTrader
#ImpulseWaves #Fibonacci #ForexTools
#CryptoTrading #StockTrading #WaveForecast

HTF Candles & ReversalsThis is a comprehensive multi-timeframe analysis tool designed to give you a broader perspective on market structure directly from your main chart. It overlays candles from up to six user-defined higher timeframes (HTF) and includes a built-in indicator to spot potential price reversals. This allows you to analyze the bigger picture and make more informed decisions without constantly switching between different chart layouts.
Key Features
Multi-Timeframe Candle Display: Renders candles from up to six different higher timeframes (the defaults are 5m, 15m, 1H, 4H, 1D, and 1W). You can see how the current price action fits within the larger trend.
Reversal Pattern Detection: The script identifies and highlights potential bullish and bearish reversal patterns. This works on both your main chart's candles and the displayed HTF candles, helping you spot potential shifts in momentum on multiple scales.
Imbalance (FVG) Highlighting: Automatically detects and draws Fair Value Gaps (FVGs) on the HTF candles, pointing out areas of inefficient price action that may act as magnets for future price movement.
Full Customization: You have complete control over the visual elements. Adjust the colors for candle bodies, borders, and wicks. Change the positioning of the HTF display, and toggle labels, timers, and imbalance boxes to create a clean workspace that fits your trading style.
How to Use This Indicator
Gain Market Context: Use the HTF candles to quickly gauge the dominant trend. For example, if the 4H and 1D candles are bullish, you might look for buying opportunities on your lower timeframe chart. The highs and lows of these HTF candles often serve as strong support and resistance levels.
Identify Reversals:
Triangles on the Main Chart: A green triangle below a candle suggests a potential bullish reversal, while a red triangle above suggests a potential bearish reversal. This pattern appears when a candle makes a new low/high but closes stronger/weaker than the previous one.
Colored HTF Candles: When an HTF candle is colored (lime for bullish, orange for bearish), it indicates that a reversal pattern has formed on that specific higher timeframe, which could signal a more significant change in market direction.
Utilize Imbalances: The highlighted FVG boxes can be treated as areas of interest. Price often revisits these zones, making them potential targets for trades or areas to watch for a reaction.
Settings Breakdown
Candle Color: Independently set the colors for bullish and bearish candle bodies, borders, and wicks.
Layout: Use the HTF Distance setting to control how far the displayed candles appear from the current price action.
Labels: Choose whether to display the timeframe name and a countdown timer for each HTF candle. You can position these labels at the top, bottom, or both.
Imbalances: Toggle the visibility of the FVG boxes and customize their color.
Reversal Indicator: Enable or disable the reversal triangles on your main chart and the special coloring for reversal candles on both the main chart and the HTF displays.
Disclaimer: This tool is intended for technical analysis and educational purposes. It does not provide financial advice or generate guaranteed trading signals. Always use risk management and conduct your own analysis before entering any trade.

Dynamic Support and Resistance V2 | AnonycryptousThe Dynamic Support and Resistance V2 indicator, an easy tool to identify key support, resistance, trendline levels, pivot points and volume data.
Pivot Points.
Calculates support, resistance and trendline levels using pivot points, which are derived from the high, low, and close prices of previous trading periods.
Customize the pivot calculation by using Close' or 'High/Low' and adjusting the lookback periods for both the left and right sides of the pivot calculation.
Pivot points are crucial for forecasting potential market turning points, so it allows traders to adapt the indicator to different market conditions and timeframes.
By using pivot points, traders can spot reversal and consolidation levels or trendlines early on, allowing them to react to them in time.
Volume Levels.
This option focuses on identifying support and resistance levels based on volume data, specifically the Point of Control.
The POC is the highest traded volume price level during a time period.
This POC calculation, allow traders to areas of significant trading levels as support or resistance zones.
Volume-based levels gives insights into market sentiment and showes strong support and resistance based on trading volume.
Traders can choose between pivot-based and volume-based levels or use both simultaneously, depending on their analysis.
The indicator offers custom colors, so the trader can customize their visual analysis to their own style.
It calculates the importance of each level based on the number of touches and the duration it holds.
This indicator is intended for educational and informational purposes only and should not be considered financial advice.
Trading involves significant risk, and you should consult with a financial advisor before making any trading decisions.
The performance of this indicator is not guaranteed, and past results do not predict future performance.
Use at your own risk.

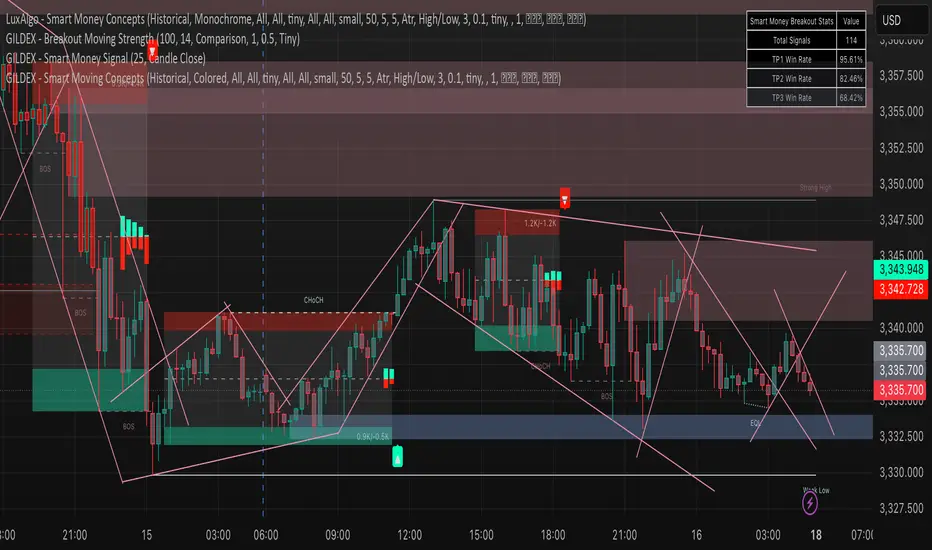
Smart Moving Concepts [GILDEX]This all-in-one indicator displays real-time market structure (internal & swing BOS / CHoCH), order blocks, premium & discount zones, equal highs & lows, and much more...allowing traders to automatically mark up their charts with widely used price action methodologies. Following the release of our Fair Value Gap script, we received numerous requests from our community to release more features in the same category.
"Smart Money Concepts" (SMC) is a fairly new yet widely used term amongst price action traders looking to more accurately navigate liquidity & find more optimal points of interest in the market. Trying to determine where institutional market participants have orders placed (buy or sell side liquidity) can be a very reasonable approach to finding more practical entries & exits based on price action.
The indicator includes alerts for the presence of swing structures and many other relevant conditions.
Features
This indicator includes many features relevant to SMC, these are highlighted below:
Full internal & swing market structure labeling in real-time
Break of Structure (BOS)
Change of Character (CHoCH)
Order Blocks (bullish & bearish)
Equal Highs & Lows
Fair Value Gap Detection
Previous Highs & Lows
Premium & Discount Zones as a range
Options to style the indicator to more easily display these concepts
Settings
Mode: Allows the user to select Historical (default) or Present, which displays only recent data on the chart.
Style: Allows the user to select different styling for the entire indicator between Colored (default) and Monochrome.
Color Candles: Plots candles based on the internal & swing structures from within the indicator on the chart.
Internal Structure: Displays the internal structure labels & dashed lines to represent them. (BOS & CHoCH).
Confluence Filter: Filter non-significant internal structure breakouts.
Swing Structure: Displays the swing structure labels & solid lines on the chart (larger BOS & CHoCH labels).
Swing Points: Displays swing points labels on chart such as HH, HL, LH, LL.
Internal Order Blocks: Enables Internal Order Blocks & allows the user to select how many most recent Internal Order Blocks appear on the chart.
Swing Order Blocks: Enables Swing Order Blocks & allows the user to select how many most recent Swing Order Blocks appear on the chart.
Equal Highs & Lows: Displays EQH/EQL labels on chart for detecting equal highs & lows.
Bars Confirmation: Allows the user to select how many bars are needed to confirm an EQH/EQL symbol on chart.
Fair Value Gaps: Displays boxes to highlight imbalance areas on the chart.
Auto Threshold: Filter out non-significant fair value gaps.
Timeframe: Allows the user to select the timeframe for the Fair Value Gap detection.
Extend FVG: Allows the user to choose how many bars to extend the Fair Value Gap boxes on the chart.
Highs & Lows MTF: Allows the user to display previous highs & lows from daily, weekly, & monthly timeframes as significant levels.
Premium/Discount Zones: Allows the user to display Premium, Discount, and Equilibrium zones on the chart
*【一分鐘找最佳進場】1-Mins Entry Point-1/5/15在 1 分鐘時間框架內尋找進場點,當 Stochastic 指標於 1 分鐘、5 分鐘、15 分鐘週期中,同時位於低檔(低於 15)或同時位於高檔(高於 85)時。
==================================
Stoch 1 / 5 / 15 Both Low(15) or Both High(85) , looking for entry point in 1 Min TimeFrame

Pivot Points with CPR by Fin Virajఈ indicator ద్వారా మీరు Pivot Points మరియు Central Pivot Range (CPR) రెండింటినీ ఒకే chartలో చూడవచ్చు.
ఇది Intraday traders మరియు Swing traders కి చాలా ఉపయోగపడే tool, ఎందుకంటే ఇది clear support & resistance zones ని చూపిస్తుంది.
🔑 Key Features:
✅ Daily Pivot Points (Classic formula ఆధారంగా)
✅ Central Pivot Range (CPR) with Top, Bottom & Pivot levels
✅ Next Day Pivot Levels కూడా calculation ద్వారా చూపిస్తుంది
✅ Institutional traders ఎక్కువగా use చేసే Opening Range Reference తో confluence చెక్ చేయడానికి perfect
✅ Easy-to-use, clutter-free visualization
🎯 Why use this?
Intradayలో సరైన Support & Resistance levels identify చేయడానికి
CPR ద్వారా మార్కెట్లోని trend strength ని అర్థం చేసుకోవడానికి
Next day preparation కోసం pivot levels ముందే readyగా ఉండటానికి
Professional trading styleకి దగ్గరగా ఉండే price action + pivot confluence ను చూసేందుకు
👉 ఈ indicatorని consistentగా practice చేస్తే, మీ entries & exits మరింత confidentగా చేయగలరు.
Created & Published by Fin Viraj
📌 Visit: finviraj.com
🔥 "Master the market with the power of Pivots & CPR!"

Leg Out Candle V2.0The Script marks candles that could be considered as a leg out of a supply/demand and are bigger than the previous ones based on the adjustable lookback value. There is also the option to adjust the threshold ob the body to wick ratio of the leg out candle. The lowest value is 50% because anything lower would be a basing candle.

Markov Chain [3D] | FractalystWhat exactly is a Markov Chain?
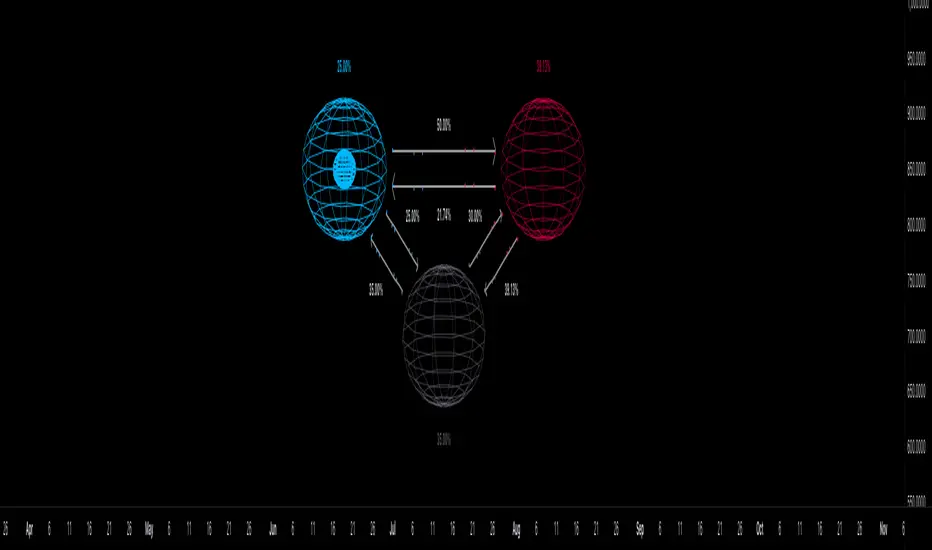
This indicator uses a Markov Chain model to analyze, quantify, and visualize the transitions between market regimes (Bull, Bear, Neutral) on your chart. It dynamically detects these regimes in real-time, calculates transition probabilities, and displays them as animated 3D spheres and arrows, giving traders intuitive insight into current and future market conditions.
How does a Markov Chain work, and how should I read this spheres-and-arrows diagram?
Think of three weather modes: Sunny, Rainy, Cloudy.
Each sphere is one mode. The loop on a sphere means “stay the same next step” (e.g., Sunny again tomorrow).
The arrows leaving a sphere show where things usually go next if they change (e.g., Sunny moving to Cloudy).
Some paths matter more than others. A more prominent loop means the current mode tends to persist. A more prominent outgoing arrow means a change to that destination is the usual next step.
Direction isn’t symmetric: moving Sunny→Cloudy can behave differently than Cloudy→Sunny.
Now relabel the spheres to markets: Bull, Bear, Neutral.
Spheres: market regimes (uptrend, downtrend, range).
Self‑loop: tendency for the current regime to continue on the next bar.
Arrows: the most common next regime if a switch happens.
How to read: Start at the sphere that matches current bar state. If the loop stands out, expect continuation. If one outgoing path stands out, that switch is the typical next step. Opposite directions can differ (Bear→Neutral doesn’t have to match Neutral→Bear).
What states and transitions are shown?
The three market states visualized are:
Bullish (Bull): Upward or strong-market regime.
Bearish (Bear): Downward or weak-market regime.
Neutral: Sideways or range-bound regime.
Bidirectional animated arrows and probability labels show how likely the market is to move from one regime to another (e.g., Bull → Bear or Neutral → Bull).
How does the regime detection system work?
You can use either built-in price returns (based on adaptive Z-score normalization) or supply three custom indicators (such as volume, oscillators, etc.).
Values are statistically normalized (Z-scored) over a configurable lookback period.
The normalized outputs are classified into Bull, Bear, or Neutral zones.
If using three indicators, their regime signals are averaged and smoothed for robustness.
How are transition probabilities calculated?
On every confirmed bar, the algorithm tracks the sequence of detected market states, then builds a rolling window of transitions.
The code maintains a transition count matrix for all regime pairs (e.g., Bull → Bear).
Transition probabilities are extracted for each possible state change using Laplace smoothing for numerical stability, and frequently updated in real-time.
What is unique about the visualization?
3D animated spheres represent each regime and change visually when active.
Animated, bidirectional arrows reveal transition probabilities and allow you to see both dominant and less likely regime flows.
Particles (moving dots) animate along the arrows, enhancing the perception of regime flow direction and speed.
All elements dynamically update with each new price bar, providing a live market map in an intuitive, engaging format.
Can I use custom indicators for regime classification?
Yes! Enable the "Custom Indicators" switch and select any three chart series as inputs. These will be normalized and combined (each with equal weight), broadening the regime classification beyond just price-based movement.
What does the “Lookback Period” control?
Lookback Period (default: 100) sets how much historical data builds the probability matrix. Shorter periods adapt faster to regime changes but may be noisier. Longer periods are more stable but slower to adapt.
How is this different from a Hidden Markov Model (HMM)?
It sets the window for both regime detection and probability calculations. Lower values make the system more reactive, but potentially noisier. Higher values smooth estimates and make the system more robust.
How is this Markov Chain different from a Hidden Markov Model (HMM)?
Markov Chain (as here): All market regimes (Bull, Bear, Neutral) are directly observable on the chart. The transition matrix is built from actual detected regimes, keeping the model simple and interpretable.
Hidden Markov Model: The actual regimes are unobservable ("hidden") and must be inferred from market output or indicator "emissions" using statistical learning algorithms. HMMs are more complex, can capture more subtle structure, but are harder to visualize and require additional machine learning steps for training.
A standard Markov Chain models transitions between observable states using a simple transition matrix, while a Hidden Markov Model assumes the true states are hidden (latent) and must be inferred from observable “emissions” like price or volume data. In practical terms, a Markov Chain is transparent and easier to implement and interpret; an HMM is more expressive but requires statistical inference to estimate hidden states from data.
Markov Chain: states are observable; you directly count or estimate transition probabilities between visible states. This makes it simpler, faster, and easier to validate and tune.
HMM: states are hidden; you only observe emissions generated by those latent states. Learning involves machine learning/statistical algorithms (commonly Baum–Welch/EM for training and Viterbi for decoding) to infer both the transition dynamics and the most likely hidden state sequence from data.
How does the indicator avoid “repainting” or look-ahead bias?
All regime changes and matrix updates happen only on confirmed (closed) bars, so no future data is leaked, ensuring reliable real-time operation.
Are there practical tuning tips?
Tune the Lookback Period for your asset/timeframe: shorter for fast markets, longer for stability.
Use custom indicators if your asset has unique regime drivers.
Watch for rapid changes in transition probabilities as early warning of a possible regime shift.
Who is this indicator for?
Quants and quantitative researchers exploring probabilistic market modeling, especially those interested in regime-switching dynamics and Markov models.
Programmers and system developers who need a probabilistic regime filter for systematic and algorithmic backtesting:
The Markov Chain indicator is ideally suited for programmatic integration via its bias output (1 = Bull, 0 = Neutral, -1 = Bear).
Although the visualization is engaging, the core output is designed for automated, rules-based workflows—not for discretionary/manual trading decisions.
Developers can connect the indicator’s output directly to their Pine Script logic (using input.source()), allowing rapid and robust backtesting of regime-based strategies.
It acts as a plug-and-play regime filter: simply plug the bias output into your entry/exit logic, and you have a scientifically robust, probabilistically-derived signal for filtering, timing, position sizing, or risk regimes.
The MC's output is intentionally "trinary" (1/0/-1), focusing on clear regime states for unambiguous decision-making in code. If you require nuanced, multi-probability or soft-label state vectors, consider expanding the indicator or stacking it with a probability-weighted logic layer in your scripting.
Because it avoids subjectivity, this approach is optimal for systematic quants, algo developers building backtested, repeatable strategies based on probabilistic regime analysis.
What's the mathematical foundation behind this?
The mathematical foundation behind this Markov Chain indicator—and probabilistic regime detection in finance—draws from two principal models: the (standard) Markov Chain and the Hidden Markov Model (HMM).
How to use this indicator programmatically?
The Markov Chain indicator automatically exports a bias value (+1 for Bullish, -1 for Bearish, 0 for Neutral) as a plot visible in the Data Window. This allows you to integrate its regime signal into your own scripts and strategies for backtesting, automation, or live trading.
Step-by-Step Integration with Pine Script (input.source)
Add the Markov Chain indicator to your chart.
This must be done first, since your custom script will "pull" the bias signal from the indicator's plot.
In your strategy, create an input using input.source()
Example:
//@version=5
strategy("MC Bias Strategy Example")
mcBias = input.source(close, "MC Bias Source")
After saving, go to your script’s settings. For the “MC Bias Source” input, select the plot/output of the Markov Chain indicator (typically its bias plot).
Use the bias in your trading logic
Example (long only on Bull, flat otherwise):
if mcBias == 1
strategy.entry("Long", strategy.long)
else
strategy.close("Long")
For more advanced workflows, combine mcBias with additional filters or trailing stops.
How does this work behind-the-scenes?
TradingView’s input.source() lets you use any plot from another indicator as a real-time, “live” data feed in your own script (source).
The selected bias signal is available to your Pine code as a variable, enabling logical decisions based on regime (trend-following, mean-reversion, etc.).
This enables powerful strategy modularity : decouple regime detection from entry/exit logic, allowing fast experimentation without rewriting core signal code.
Integrating 45+ Indicators with Your Markov Chain — How & Why
The Enhanced Custom Indicators Export script exports a massive suite of over 45 technical indicators—ranging from classic momentum (RSI, MACD, Stochastic, etc.) to trend, volume, volatility, and oscillator tools—all pre-calculated, centered/scaled, and available as plots.
// Enhanced Custom Indicators Export - 45 Technical Indicators
// Comprehensive technical analysis suite for advanced market regime detection
//@version=6
indicator('Enhanced Custom Indicators Export | Fractalyst', shorttitle='Enhanced CI Export', overlay=false, scale=scale.right, max_labels_count=500, max_lines_count=500)
// |----- Input Parameters -----| //
momentum_group = "Momentum Indicators"
trend_group = "Trend Indicators"
volume_group = "Volume Indicators"
volatility_group = "Volatility Indicators"
oscillator_group = "Oscillator Indicators"
display_group = "Display Settings"
// Common lengths
length_14 = input.int(14, "Standard Length (14)", minval=1, maxval=100, group=momentum_group)
length_20 = input.int(20, "Medium Length (20)", minval=1, maxval=200, group=trend_group)
length_50 = input.int(50, "Long Length (50)", minval=1, maxval=200, group=trend_group)
// Display options
show_table = input.bool(true, "Show Values Table", group=display_group)
table_size = input.string("Small", "Table Size", options= , group=display_group)
// |----- MOMENTUM INDICATORS (15 indicators) -----| //
// 1. RSI (Relative Strength Index)
rsi_14 = ta.rsi(close, length_14)
rsi_centered = rsi_14 - 50
// 2. Stochastic Oscillator
stoch_k = ta.stoch(close, high, low, length_14)
stoch_d = ta.sma(stoch_k, 3)
stoch_centered = stoch_k - 50
// 3. Williams %R
williams_r = ta.stoch(close, high, low, length_14) - 100
// 4. MACD (Moving Average Convergence Divergence)
= ta.macd(close, 12, 26, 9)
// 5. Momentum (Rate of Change)
momentum = ta.mom(close, length_14)
momentum_pct = (momentum / close ) * 100
// 6. Rate of Change (ROC)
roc = ta.roc(close, length_14)
// 7. Commodity Channel Index (CCI)
cci = ta.cci(close, length_20)
// 8. Money Flow Index (MFI)
mfi = ta.mfi(close, length_14)
mfi_centered = mfi - 50
// 9. Awesome Oscillator (AO)
ao = ta.sma(hl2, 5) - ta.sma(hl2, 34)
// 10. Accelerator Oscillator (AC)
ac = ao - ta.sma(ao, 5)
// 11. Chande Momentum Oscillator (CMO)
cmo = ta.cmo(close, length_14)
// 12. Detrended Price Oscillator (DPO)
dpo = close - ta.sma(close, length_20)
// 13. Price Oscillator (PPO)
ppo = ta.sma(close, 12) - ta.sma(close, 26)
ppo_pct = (ppo / ta.sma(close, 26)) * 100
// 14. TRIX
trix_ema1 = ta.ema(close, length_14)
trix_ema2 = ta.ema(trix_ema1, length_14)
trix_ema3 = ta.ema(trix_ema2, length_14)
trix = ta.roc(trix_ema3, 1) * 10000
// 15. Klinger Oscillator
klinger = ta.ema(volume * (high + low + close) / 3, 34) - ta.ema(volume * (high + low + close) / 3, 55)
// 16. Fisher Transform
fisher_hl2 = 0.5 * (hl2 - ta.lowest(hl2, 10)) / (ta.highest(hl2, 10) - ta.lowest(hl2, 10)) - 0.25
fisher = 0.5 * math.log((1 + fisher_hl2) / (1 - fisher_hl2))
// 17. Stochastic RSI
stoch_rsi = ta.stoch(rsi_14, rsi_14, rsi_14, length_14)
stoch_rsi_centered = stoch_rsi - 50
// 18. Relative Vigor Index (RVI)
rvi_num = ta.swma(close - open)
rvi_den = ta.swma(high - low)
rvi = rvi_den != 0 ? rvi_num / rvi_den : 0
// 19. Balance of Power (BOP)
bop = (close - open) / (high - low)
// |----- TREND INDICATORS (10 indicators) -----| //
// 20. Simple Moving Average Momentum
sma_20 = ta.sma(close, length_20)
sma_momentum = ((close - sma_20) / sma_20) * 100
// 21. Exponential Moving Average Momentum
ema_20 = ta.ema(close, length_20)
ema_momentum = ((close - ema_20) / ema_20) * 100
// 22. Parabolic SAR
sar = ta.sar(0.02, 0.02, 0.2)
sar_trend = close > sar ? 1 : -1
// 23. Linear Regression Slope
lr_slope = ta.linreg(close, length_20, 0) - ta.linreg(close, length_20, 1)
// 24. Moving Average Convergence (MAC)
mac = ta.sma(close, 10) - ta.sma(close, 30)
// 25. Trend Intensity Index (TII)
tii_sum = 0.0
for i = 1 to length_20
tii_sum += close > close ? 1 : 0
tii = (tii_sum / length_20) * 100
// 26. Ichimoku Cloud Components
ichimoku_tenkan = (ta.highest(high, 9) + ta.lowest(low, 9)) / 2
ichimoku_kijun = (ta.highest(high, 26) + ta.lowest(low, 26)) / 2
ichimoku_signal = ichimoku_tenkan > ichimoku_kijun ? 1 : -1
// 27. MESA Adaptive Moving Average (MAMA)
mama_alpha = 2.0 / (length_20 + 1)
mama = ta.ema(close, length_20)
mama_momentum = ((close - mama) / mama) * 100
// 28. Zero Lag Exponential Moving Average (ZLEMA)
zlema_lag = math.round((length_20 - 1) / 2)
zlema_data = close + (close - close )
zlema = ta.ema(zlema_data, length_20)
zlema_momentum = ((close - zlema) / zlema) * 100
// |----- VOLUME INDICATORS (6 indicators) -----| //
// 29. On-Balance Volume (OBV)
obv = ta.obv
// 30. Volume Rate of Change (VROC)
vroc = ta.roc(volume, length_14)
// 31. Price Volume Trend (PVT)
pvt = ta.pvt
// 32. Negative Volume Index (NVI)
nvi = 0.0
nvi := volume < volume ? nvi + ((close - close ) / close ) * nvi : nvi
// 33. Positive Volume Index (PVI)
pvi = 0.0
pvi := volume > volume ? pvi + ((close - close ) / close ) * pvi : pvi
// 34. Volume Oscillator
vol_osc = ta.sma(volume, 5) - ta.sma(volume, 10)
// 35. Ease of Movement (EOM)
eom_distance = high - low
eom_box_height = volume / 1000000
eom = eom_box_height != 0 ? eom_distance / eom_box_height : 0
eom_sma = ta.sma(eom, length_14)
// 36. Force Index
force_index = volume * (close - close )
force_index_sma = ta.sma(force_index, length_14)
// |----- VOLATILITY INDICATORS (10 indicators) -----| //
// 37. Average True Range (ATR)
atr = ta.atr(length_14)
atr_pct = (atr / close) * 100
// 38. Bollinger Bands Position
bb_basis = ta.sma(close, length_20)
bb_dev = 2.0 * ta.stdev(close, length_20)
bb_upper = bb_basis + bb_dev
bb_lower = bb_basis - bb_dev
bb_position = bb_dev != 0 ? (close - bb_basis) / bb_dev : 0
bb_width = bb_dev != 0 ? (bb_upper - bb_lower) / bb_basis * 100 : 0
// 39. Keltner Channels Position
kc_basis = ta.ema(close, length_20)
kc_range = ta.ema(ta.tr, length_20)
kc_upper = kc_basis + (2.0 * kc_range)
kc_lower = kc_basis - (2.0 * kc_range)
kc_position = kc_range != 0 ? (close - kc_basis) / kc_range : 0
// 40. Donchian Channels Position
dc_upper = ta.highest(high, length_20)
dc_lower = ta.lowest(low, length_20)
dc_basis = (dc_upper + dc_lower) / 2
dc_position = (dc_upper - dc_lower) != 0 ? (close - dc_basis) / (dc_upper - dc_lower) : 0
// 41. Standard Deviation
std_dev = ta.stdev(close, length_20)
std_dev_pct = (std_dev / close) * 100
// 42. Relative Volatility Index (RVI)
rvi_up = ta.stdev(close > close ? close : 0, length_14)
rvi_down = ta.stdev(close < close ? close : 0, length_14)
rvi_total = rvi_up + rvi_down
rvi_volatility = rvi_total != 0 ? (rvi_up / rvi_total) * 100 : 50
// 43. Historical Volatility
hv_returns = math.log(close / close )
hv = ta.stdev(hv_returns, length_20) * math.sqrt(252) * 100
// 44. Garman-Klass Volatility
gk_vol = math.log(high/low) * math.log(high/low) - (2*math.log(2)-1) * math.log(close/open) * math.log(close/open)
gk_volatility = math.sqrt(ta.sma(gk_vol, length_20)) * 100
// 45. Parkinson Volatility
park_vol = math.log(high/low) * math.log(high/low)
parkinson = math.sqrt(ta.sma(park_vol, length_20) / (4 * math.log(2))) * 100
// 46. Rogers-Satchell Volatility
rs_vol = math.log(high/close) * math.log(high/open) + math.log(low/close) * math.log(low/open)
rogers_satchell = math.sqrt(ta.sma(rs_vol, length_20)) * 100
// |----- OSCILLATOR INDICATORS (5 indicators) -----| //
// 47. Elder Ray Index
elder_bull = high - ta.ema(close, 13)
elder_bear = low - ta.ema(close, 13)
elder_power = elder_bull + elder_bear
// 48. Schaff Trend Cycle (STC)
stc_macd = ta.ema(close, 23) - ta.ema(close, 50)
stc_k = ta.stoch(stc_macd, stc_macd, stc_macd, 10)
stc_d = ta.ema(stc_k, 3)
stc = ta.stoch(stc_d, stc_d, stc_d, 10)
// 49. Coppock Curve
coppock_roc1 = ta.roc(close, 14)
coppock_roc2 = ta.roc(close, 11)
coppock = ta.wma(coppock_roc1 + coppock_roc2, 10)
// 50. Know Sure Thing (KST)
kst_roc1 = ta.roc(close, 10)
kst_roc2 = ta.roc(close, 15)
kst_roc3 = ta.roc(close, 20)
kst_roc4 = ta.roc(close, 30)
kst = ta.sma(kst_roc1, 10) + 2*ta.sma(kst_roc2, 10) + 3*ta.sma(kst_roc3, 10) + 4*ta.sma(kst_roc4, 15)
// 51. Percentage Price Oscillator (PPO)
ppo_line = ((ta.ema(close, 12) - ta.ema(close, 26)) / ta.ema(close, 26)) * 100
ppo_signal = ta.ema(ppo_line, 9)
ppo_histogram = ppo_line - ppo_signal
// |----- PLOT MAIN INDICATORS -----| //
// Plot key momentum indicators
plot(rsi_centered, title="01_RSI_Centered", color=color.purple, linewidth=1)
plot(stoch_centered, title="02_Stoch_Centered", color=color.blue, linewidth=1)
plot(williams_r, title="03_Williams_R", color=color.red, linewidth=1)
plot(macd_histogram, title="04_MACD_Histogram", color=color.orange, linewidth=1)
plot(cci, title="05_CCI", color=color.green, linewidth=1)
// Plot trend indicators
plot(sma_momentum, title="06_SMA_Momentum", color=color.navy, linewidth=1)
plot(ema_momentum, title="07_EMA_Momentum", color=color.maroon, linewidth=1)
plot(sar_trend, title="08_SAR_Trend", color=color.teal, linewidth=1)
plot(lr_slope, title="09_LR_Slope", color=color.lime, linewidth=1)
plot(mac, title="10_MAC", color=color.fuchsia, linewidth=1)
// Plot volatility indicators
plot(atr_pct, title="11_ATR_Pct", color=color.yellow, linewidth=1)
plot(bb_position, title="12_BB_Position", color=color.aqua, linewidth=1)
plot(kc_position, title="13_KC_Position", color=color.olive, linewidth=1)
plot(std_dev_pct, title="14_StdDev_Pct", color=color.silver, linewidth=1)
plot(bb_width, title="15_BB_Width", color=color.gray, linewidth=1)
// Plot volume indicators
plot(vroc, title="16_VROC", color=color.blue, linewidth=1)
plot(eom_sma, title="17_EOM", color=color.red, linewidth=1)
plot(vol_osc, title="18_Vol_Osc", color=color.green, linewidth=1)
plot(force_index_sma, title="19_Force_Index", color=color.orange, linewidth=1)
plot(obv, title="20_OBV", color=color.purple, linewidth=1)
// Plot additional oscillators
plot(ao, title="21_Awesome_Osc", color=color.navy, linewidth=1)
plot(cmo, title="22_CMO", color=color.maroon, linewidth=1)
plot(dpo, title="23_DPO", color=color.teal, linewidth=1)
plot(trix, title="24_TRIX", color=color.lime, linewidth=1)
plot(fisher, title="25_Fisher", color=color.fuchsia, linewidth=1)
// Plot more momentum indicators
plot(mfi_centered, title="26_MFI_Centered", color=color.yellow, linewidth=1)
plot(ac, title="27_AC", color=color.aqua, linewidth=1)
plot(ppo_pct, title="28_PPO_Pct", color=color.olive, linewidth=1)
plot(stoch_rsi_centered, title="29_StochRSI_Centered", color=color.silver, linewidth=1)
plot(klinger, title="30_Klinger", color=color.gray, linewidth=1)
// Plot trend continuation
plot(tii, title="31_TII", color=color.blue, linewidth=1)
plot(ichimoku_signal, title="32_Ichimoku_Signal", color=color.red, linewidth=1)
plot(mama_momentum, title="33_MAMA_Momentum", color=color.green, linewidth=1)
plot(zlema_momentum, title="34_ZLEMA_Momentum", color=color.orange, linewidth=1)
plot(bop, title="35_BOP", color=color.purple, linewidth=1)
// Plot volume continuation
plot(nvi, title="36_NVI", color=color.navy, linewidth=1)
plot(pvi, title="37_PVI", color=color.maroon, linewidth=1)
plot(momentum_pct, title="38_Momentum_Pct", color=color.teal, linewidth=1)
plot(roc, title="39_ROC", color=color.lime, linewidth=1)
plot(rvi, title="40_RVI", color=color.fuchsia, linewidth=1)
// Plot volatility continuation
plot(dc_position, title="41_DC_Position", color=color.yellow, linewidth=1)
plot(rvi_volatility, title="42_RVI_Volatility", color=color.aqua, linewidth=1)
plot(hv, title="43_Historical_Vol", color=color.olive, linewidth=1)
plot(gk_volatility, title="44_GK_Volatility", color=color.silver, linewidth=1)
plot(parkinson, title="45_Parkinson_Vol", color=color.gray, linewidth=1)
// Plot final oscillators
plot(rogers_satchell, title="46_RS_Volatility", color=color.blue, linewidth=1)
plot(elder_power, title="47_Elder_Power", color=color.red, linewidth=1)
plot(stc, title="48_STC", color=color.green, linewidth=1)
plot(coppock, title="49_Coppock", color=color.orange, linewidth=1)
plot(kst, title="50_KST", color=color.purple, linewidth=1)
// Plot final indicators
plot(ppo_histogram, title="51_PPO_Histogram", color=color.navy, linewidth=1)
plot(pvt, title="52_PVT", color=color.maroon, linewidth=1)
// |----- Reference Lines -----| //
hline(0, "Zero Line", color=color.gray, linestyle=hline.style_dashed, linewidth=1)
hline(50, "Midline", color=color.gray, linestyle=hline.style_dotted, linewidth=1)
hline(-50, "Lower Midline", color=color.gray, linestyle=hline.style_dotted, linewidth=1)
hline(25, "Upper Threshold", color=color.gray, linestyle=hline.style_dotted, linewidth=1)
hline(-25, "Lower Threshold", color=color.gray, linestyle=hline.style_dotted, linewidth=1)
// |----- Enhanced Information Table -----| //
if show_table and barstate.islast
table_position = position.top_right
table_text_size = table_size == "Tiny" ? size.tiny : table_size == "Small" ? size.small : size.normal
var table info_table = table.new(table_position, 3, 18, bgcolor=color.new(color.white, 85), border_width=1, border_color=color.gray)
// Headers
table.cell(info_table, 0, 0, 'Category', text_color=color.black, text_size=table_text_size, bgcolor=color.new(color.blue, 70))
table.cell(info_table, 1, 0, 'Indicator', text_color=color.black, text_size=table_text_size, bgcolor=color.new(color.blue, 70))
table.cell(info_table, 2, 0, 'Value', text_color=color.black, text_size=table_text_size, bgcolor=color.new(color.blue, 70))
// Key Momentum Indicators
table.cell(info_table, 0, 1, 'MOMENTUM', text_color=color.purple, text_size=table_text_size, bgcolor=color.new(color.purple, 90))
table.cell(info_table, 1, 1, 'RSI Centered', text_color=color.purple, text_size=table_text_size)
table.cell(info_table, 2, 1, str.tostring(rsi_centered, '0.00'), text_color=color.purple, text_size=table_text_size)
table.cell(info_table, 0, 2, '', text_color=color.blue, text_size=table_text_size)
table.cell(info_table, 1, 2, 'Stoch Centered', text_color=color.blue, text_size=table_text_size)
table.cell(info_table, 2, 2, str.tostring(stoch_centered, '0.00'), text_color=color.blue, text_size=table_text_size)
table.cell(info_table, 0, 3, '', text_color=color.red, text_size=table_text_size)
table.cell(info_table, 1, 3, 'Williams %R', text_color=color.red, text_size=table_text_size)
table.cell(info_table, 2, 3, str.tostring(williams_r, '0.00'), text_color=color.red, text_size=table_text_size)
table.cell(info_table, 0, 4, '', text_color=color.orange, text_size=table_text_size)
table.cell(info_table, 1, 4, 'MACD Histogram', text_color=color.orange, text_size=table_text_size)
table.cell(info_table, 2, 4, str.tostring(macd_histogram, '0.000'), text_color=color.orange, text_size=table_text_size)
table.cell(info_table, 0, 5, '', text_color=color.green, text_size=table_text_size)
table.cell(info_table, 1, 5, 'CCI', text_color=color.green, text_size=table_text_size)
table.cell(info_table, 2, 5, str.tostring(cci, '0.00'), text_color=color.green, text_size=table_text_size)
// Key Trend Indicators
table.cell(info_table, 0, 6, 'TREND', text_color=color.navy, text_size=table_text_size, bgcolor=color.new(color.navy, 90))
table.cell(info_table, 1, 6, 'SMA Momentum %', text_color=color.navy, text_size=table_text_size)
table.cell(info_table, 2, 6, str.tostring(sma_momentum, '0.00'), text_color=color.navy, text_size=table_text_size)
table.cell(info_table, 0, 7, '', text_color=color.maroon, text_size=table_text_size)
table.cell(info_table, 1, 7, 'EMA Momentum %', text_color=color.maroon, text_size=table_text_size)
table.cell(info_table, 2, 7, str.tostring(ema_momentum, '0.00'), text_color=color.maroon, text_size=table_text_size)
table.cell(info_table, 0, 8, '', text_color=color.teal, text_size=table_text_size)
table.cell(info_table, 1, 8, 'SAR Trend', text_color=color.teal, text_size=table_text_size)
table.cell(info_table, 2, 8, str.tostring(sar_trend, '0'), text_color=color.teal, text_size=table_text_size)
table.cell(info_table, 0, 9, '', text_color=color.lime, text_size=table_text_size)
table.cell(info_table, 1, 9, 'Linear Regression', text_color=color.lime, text_size=table_text_size)
table.cell(info_table, 2, 9, str.tostring(lr_slope, '0.000'), text_color=color.lime, text_size=table_text_size)
// Key Volatility Indicators
table.cell(info_table, 0, 10, 'VOLATILITY', text_color=color.yellow, text_size=table_text_size, bgcolor=color.new(color.yellow, 90))
table.cell(info_table, 1, 10, 'ATR %', text_color=color.yellow, text_size=table_text_size)
table.cell(info_table, 2, 10, str.tostring(atr_pct, '0.00'), text_color=color.yellow, text_size=table_text_size)
table.cell(info_table, 0, 11, '', text_color=color.aqua, text_size=table_text_size)
table.cell(info_table, 1, 11, 'BB Position', text_color=color.aqua, text_size=table_text_size)
table.cell(info_table, 2, 11, str.tostring(bb_position, '0.00'), text_color=color.aqua, text_size=table_text_size)
table.cell(info_table, 0, 12, '', text_color=color.olive, text_size=table_text_size)
table.cell(info_table, 1, 12, 'KC Position', text_color=color.olive, text_size=table_text_size)
table.cell(info_table, 2, 12, str.tostring(kc_position, '0.00'), text_color=color.olive, text_size=table_text_size)
// Key Volume Indicators
table.cell(info_table, 0, 13, 'VOLUME', text_color=color.blue, text_size=table_text_size, bgcolor=color.new(color.blue, 90))
table.cell(info_table, 1, 13, 'Volume ROC', text_color=color.blue, text_size=table_text_size)
table.cell(info_table, 2, 13, str.tostring(vroc, '0.00'), text_color=color.blue, text_size=table_text_size)
table.cell(info_table, 0, 14, '', text_color=color.red, text_size=table_text_size)
table.cell(info_table, 1, 14, 'EOM', text_color=color.red, text_size=table_text_size)
table.cell(info_table, 2, 14, str.tostring(eom_sma, '0.000'), text_color=color.red, text_size=table_text_size)
// Key Oscillators
table.cell(info_table, 0, 15, 'OSCILLATORS', text_color=color.purple, text_size=table_text_size, bgcolor=color.new(color.purple, 90))
table.cell(info_table, 1, 15, 'Awesome Osc', text_color=color.blue, text_size=table_text_size)
table.cell(info_table, 2, 15, str.tostring(ao, '0.000'), text_color=color.blue, text_size=table_text_size)
table.cell(info_table, 0, 16, '', text_color=color.red, text_size=table_text_size)
table.cell(info_table, 1, 16, 'Fisher Transform', text_color=color.red, text_size=table_text_size)
table.cell(info_table, 2, 16, str.tostring(fisher, '0.000'), text_color=color.red, text_size=table_text_size)
// Summary Statistics
table.cell(info_table, 0, 17, 'SUMMARY', text_color=color.black, text_size=table_text_size, bgcolor=color.new(color.gray, 70))
table.cell(info_table, 1, 17, 'Total Indicators: 52', text_color=color.black, text_size=table_text_size)
regime_color = rsi_centered > 10 ? color.green : rsi_centered < -10 ? color.red : color.gray
regime_text = rsi_centered > 10 ? "BULLISH" : rsi_centered < -10 ? "BEARISH" : "NEUTRAL"
table.cell(info_table, 2, 17, regime_text, text_color=regime_color, text_size=table_text_size)
This makes it the perfect “indicator backbone” for quantitative and systematic traders who want to prototype, combine, and test new regime detection models—especially in combination with the Markov Chain indicator.
How to use this script with the Markov Chain for research and backtesting:
Add the Enhanced Indicator Export to your chart.
Every calculated indicator is available as an individual data stream.
Connect the indicator(s) you want as custom input(s) to the Markov Chain’s “Custom Indicators” option.
In the Markov Chain indicator’s settings, turn ON the custom indicator mode.
For each of the three custom indicator inputs, select the exported plot from the Enhanced Export script—the menu lists all 45+ signals by name.
This creates a powerful, modular regime-detection engine where you can mix-and-match momentum, trend, volume, or custom combinations for advanced filtering.
Backtest regime logic directly.
Once you’ve connected your chosen indicators, the Markov Chain script performs regime detection (Bull/Neutral/Bear) based on your selected features—not just price returns.
The regime detection is robust, automatically normalized (using Z-score), and outputs bias (1, -1, 0) for plug-and-play integration.
Export the regime bias for programmatic use.
As described above, use input.source() in your Pine Script strategy or system and link the bias output.
You can now filter signals, control trade direction/size, or design pairs-trading that respect true, indicator-driven market regimes.
With this framework, you’re not limited to static or simplistic regime filters. You can rigorously define, test, and refine what “market regime” means for your strategies—using the technical features that matter most to you.
Optimize your signal generation by backtesting across a universe of meaningful indicator blends.
Enhance risk management with objective, real-time regime boundaries.
Accelerate your research: iterate quickly, swap indicator components, and see results with minimal code changes.
Automate multi-asset or pairs-trading by integrating regime context directly into strategy logic.
Add both scripts to your chart, connect your preferred features, and start investigating your best regime-based trades—entirely within the TradingView ecosystem.
References & Further Reading
Ang, A., & Bekaert, G. (2002). “Regime Switches in Interest Rates.” Journal of Business & Economic Statistics, 20(2), 163–182.
Hamilton, J. D. (1989). “A New Approach to the Economic Analysis of Nonstationary Time Series and the Business Cycle.” Econometrica, 57(2), 357–384.
Markov, A. A. (1906). "Extension of the Limit Theorems of Probability Theory to a Sum of Variables Connected in a Chain." The Notes of the Imperial Academy of Sciences of St. Petersburg.
Guidolin, M., & Timmermann, A. (2007). “Asset Allocation under Multivariate Regime Switching.” Journal of Economic Dynamics and Control, 31(11), 3503–3544.
Murphy, J. J. (1999). Technical Analysis of the Financial Markets. New York Institute of Finance.
Brock, W., Lakonishok, J., & LeBaron, B. (1992). “Simple Technical Trading Rules and the Stochastic Properties of Stock Returns.” Journal of Finance, 47(5), 1731–1764.
Zucchini, W., MacDonald, I. L., & Langrock, R. (2017). Hidden Markov Models for Time Series: An Introduction Using R (2nd ed.). Chapman and Hall/CRC.
On Quantitative Finance and Markov Models:
Lo, A. W., & Hasanhodzic, J. (2009). The Heretics of Finance: Conversations with Leading Practitioners of Technical Analysis. Bloomberg Press.
Patterson, S. (2016). The Man Who Solved the Market: How Jim Simons Launched the Quant Revolution. Penguin Press.
TradingView Pine Script Documentation: www.tradingview.com
TradingView Blog: “Use an Input From Another Indicator With Your Strategy” www.tradingview.com
GeeksforGeeks: “What is the Difference Between Markov Chains and Hidden Markov Models?” www.geeksforgeeks.org
What makes this indicator original and unique?
- On‑chart, real‑time Markov. The chain is drawn directly on your chart. You see the current regime, its tendency to stay (self‑loop), and the usual next step (arrows) as bars confirm.
- Source‑agnostic by design. The engine runs on any series you select via input.source() — price, your own oscillator, a composite score, anything you compute in the script.
- Automatic normalization + regime mapping. Different inputs live on different scales. The script standardizes your chosen source and maps it into clear regimes (e.g., Bull / Bear / Neutral) without you micromanaging thresholds each time.
- Rolling, bar‑by‑bar learning. Transition tendencies are computed from a rolling window of confirmed bars. What you see is exactly what the market did in that window.
- Fast experimentation. Switch the source, adjust the window, and the Markov view updates instantly. It’s a rapid way to test ideas and feel regime persistence/switch behavior.
Integrate your own signals (using input.source())
- In settings, choose the Source . This is powered by input.source() .
- Feed it price, an indicator you compute inside the script, or a custom composite series.
- The script will automatically normalize that series and process it through the Markov engine, mapping it to regimes and updating the on‑chart spheres/arrows in real time.
Credits:
Deep gratitude to @RicardoSantos for both the foundational Markov chain processing engine and inspiring open-source contributions, which made advanced probabilistic market modeling accessible to the TradingView community.
Special thanks to @Alien_Algorithms for the innovative and visually stunning 3D sphere logic that powers the indicator’s animated, regime-based visualization.
Disclaimer
This tool summarizes recent behavior. It is not financial advice and not a guarantee of future results.
CleanBreak Lines (Break + First Retest)CleanBreak lines draws one robust support line (green) from swing lows and one robust resistance line (red) from swing highs, then optionally signals a confirmed break and the first clean retest back to that line. Lines are scored with a transparent W-Score (0–100) so traders can judge quality at a glance. The script is non-repainting and uses only confirmed bar data.
What it does
Auto-builds two trendlines that aim to represent meaningful support and resistance.
Uses a median-based slope so outliers and single spikes do not distort the line.
Computes a W-Score per line from three things: touches, span (how long it held), and respect (staying on the correct side).
Optionally triggers a single, tightly-gated signal on Break + First Retest.
How it works (plain English)
Detect recent swing highs and swing lows.
Fit one line through highs and one through lows using a robust, median-style slope estimate.
Score each line: more clean touches and longer span raise the W-Score; frequent violations lower it.
A break requires a candle close beyond the line by a small ATR margin.
A first retest requires price to come back to the line within a limited number of bars and hold on close.
A single arrow may print on that confirmed retest, with optional alerts.
What it is not
Not a prediction model and not a promises-of-profit tool.
Not a multi-signal spammer: by design it aims to allow one retest entry per break.
Not a regression channel or machine-learning system.
How to use
At a glance: treat the green line as candidate support and the red line as candidate resistance.
Conservative approach: wait for a break on close and then the first retest to hold; use the arrow as a prompt, not a command.
Context-only mode: hide arrows in Style if you want the lines and W-Score only.
Inputs (brief)
Core: Swing Length, Max Pivots, Min Touches, Min Span Bars.
Scoring: Touches Max (cap), Weights for touches vs span, Min W-Score to arm.
Break and Retest: Break Margin x ATR, Retest Tolerance x ATR, Retest Window (bars).
Visuals: Show Labels, Show Table, Line Width, Fade When Refit.
Recommended presets
Cleaner, fewer signals: Min Touches 4–5, Min Span Bars 100–150, Min W-Score 70–80, Break Margin 0.40–0.60 ATR, Retest Tolerance 0.10–0.15 ATR, Retest Window 8–12 bars.
Lines-only: keep defaults and uncheck the two plotshapes in Style.
Alerts
CB Long Retest: break above the red line and first retest holds.
CB Short Retest: break below the green line and first retest holds.
Use “Once per bar close” for consistency.
On-chart table (if enabled)
RES / SUP: W-Score and distance from price in ATR terms.
Status: “Waiting Long RT”, “Waiting Short RT”, or “Idle”.
Thresholds: MinScore and Retest bars for quick context.
Timeframes
Works well on 1h to 1D. On very low timeframes, raise Break Margin x ATR to reduce whipsaw effects. On higher timeframes, increase Min Touches and Min Span Bars.
Non-repainting policy
All logic uses confirmed pivots and confirmed bar closes.
Breaks and retests are validated on close; alerts reference only confirmed conditions.
No lookahead in any request.security call.
Original implementation focused on a median-based robust slope for auto trendlines, plus a transparent W-Score and a single retest gate.
Disclosure
This script is for education and charting. It does not guarantee outcomes, and past behavior does not imply future results. Always validate on historical data and practice risk management.

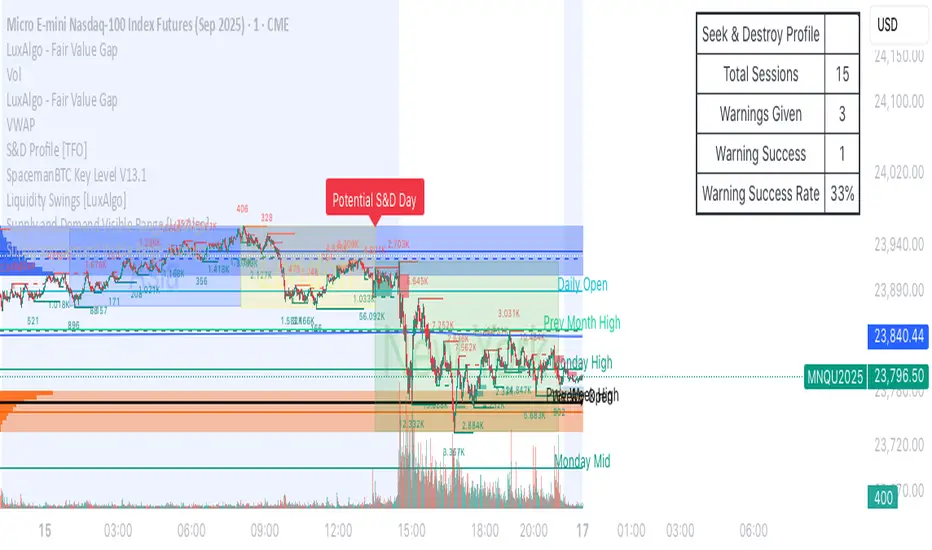
liquidity reversalThis script detects liquidity sweeps and confirms reversals based on price action. It looks for:
- A sweep of a recent high or low
- A reversal candle closing back inside range
- (Optional) Confirmation via market structure break (MSB)
When confirmed, it plots:
- BUY signals after low sweep + bullish break
- SELL signals after high sweep + bearish break
Works on any timeframe. Designed for MNQ scalping during NY open.
Currency Strength v3.0Currency Strength v3.0
Summary
The Currency Strength indicator is a powerful tool designed to gauge the relative strength of major and emerging market currencies. By plotting the True Strength Index (TSI) of various currency indices, it provides a clear visual representation of which currencies are gaining momentum and which are losing it. This indicator automatically detects the currency pair on your chart and highlights the corresponding strength lines, simplifying analysis and helping you quickly identify potential trading opportunities based on currency dynamics.
Key Features
Comprehensive Currency Analysis: Tracks the strength of 19 currencies, including major pairs and several emerging market currencies.
Automatic Pair Detection: Intelligently identifies the base and quote currency of the active chart, automatically highlighting the relevant strength lines.
Dynamic Coloring: The base currency is consistently colored blue, and the quote currency is colored gold, making it easy to distinguish between the two at a glance.
Non-Repainting TSI Calculation: Uses the True Strength Index (TSI) for smooth and reliable momentum readings that do not repaint.
Customizable Settings: Allows for adjustment of the fast and slow periods for the TSI calculation to fit your specific trading style.
Clean Interface: Features a minimalist legend table that only displays the currencies relevant to your current chart, keeping your workspace uncluttered.
How It Works
The indicator pulls data from major currency indices (like DXY for the US Dollar and EXY for the Euro). For currencies that don't have a dedicated index, it uses their USD pair (e.g., USDCNY) and inverts the calculation to derive the currency's strength relative to the dollar. It then applies the True Strength Index (TSI) to this data. The TSI is a momentum oscillator that is less volatile than other oscillators, providing a more reliable measure of strength. The resulting values are plotted on the chart, allowing you to see how different currencies are performing against each other in real-time.
How to Use
Trend Confirmation: When the base currency's line is rising and above the zero line, and the quote currency's line is falling, it can confirm a bullish trend for the pair. The opposite would suggest a bearish trend.
Identifying Divergences: Look for divergences between the currency strength lines and the price action of the pair. For example, if the price is making higher highs but the base currency's strength is making lower highs, it could signal a potential reversal.
Crossovers: A crossover of the base and quote currency lines can signal a shift in momentum. A bullish signal occurs when the base currency line crosses above the quote currency line. A bearish signal occurs when it crosses below.
Overbought/Oversold Levels: The horizontal dashed lines at 0.5 and -0.5 can be used as general guides for overbought and oversold conditions, respectively. Strength moving beyond these levels may indicate an unsustainable move that is due for a correction.
Settings
Fast Period: The short-term period for the TSI calculation. Default is 7.
Slow Period: The long-term period for the TSI calculation. Default is 15.
Index Source: The price source used for the calculations (e.g., Close, Open). Default is Close.
Base Currency Color: The color for the base currency line. Default is Royal Blue.
Quote Currency Color: The color for the quote currency line. Default is Goldenrod.
Disclaimer
This indicator is intended for educational and analytical purposes only. It is not financial advice. Trading involves substantial risk, and past performance is not indicative of future results. Always conduct your own research and risk management before making any trading decisions.

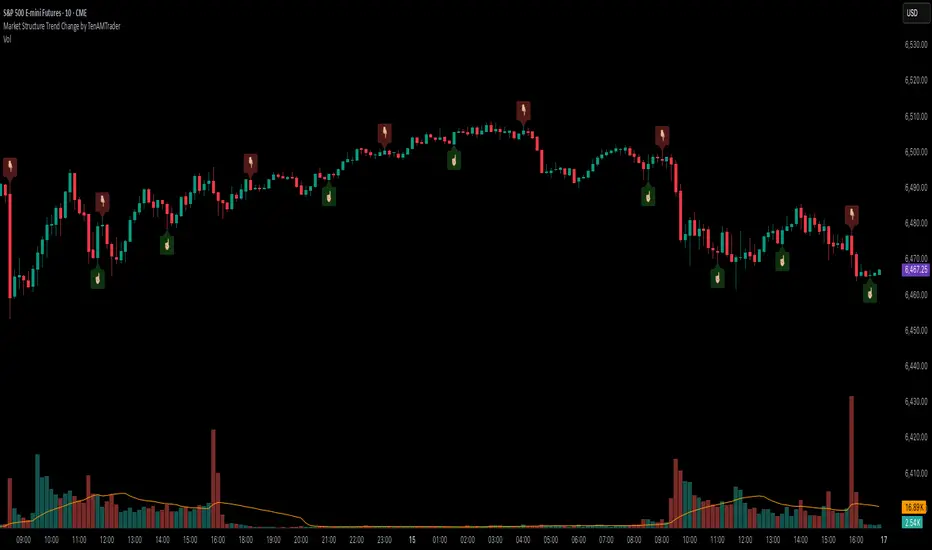
Market Structure Trend Change by TenAMTraderMarket Structure Trend Change Indicator
Description:
This indicator detects changes in market trend by analyzing swing highs and lows to identify Higher Highs (HH), Higher Lows (HL), Lower Highs (LH), and Lower Lows (LL). It helps traders quickly see potential reversals and trend continuation points.
Features:
Automatically identifies pivots based on configurable left and right bars.
Labels pivot points (HH, HL, LH, LL) directly on the chart (text-only for clarity).
Generates buy and sell signals when a trend change is detected:
Buy Signal: HL after repeated LLs.
Sell Signal: LH after repeated HHs.
Fully customizable signal appearance: arrow type, circle, label, color, and size.
Adjustable minimum number of repeated highs or lows before a trend change triggers a signal.
Alerts built in for automated notifications when buy/sell signals occur.
Default Settings:
Optimized for a 10-minute chart.
Default “Min repeats before trend change” and pivot left/right bars are set for typical 10-min price swings.
User Customization:
Adjust the “Pivot Left Bars,” “Pivot Right Bars,” and “Min repeats before trend change” to match your trading style, chart timeframe, and volatility.
Enable pivot labels for visual clarity if desired.
Set alerts to receive notifications of trend changes in real time.
How to Use:
Apply the indicator to any chart and timeframe. It works best on swing-trading or trend-following strategies.
Watch for Buy/Sell signals in conjunction with your other analysis, such as volume, support/resistance, or other indicators.
Legal Disclaimer:
This indicator is provided for educational and informational purposes only. It is not financial advice. Trading involves substantial risk, and past performance is not indicative of future results. Users should trade at their own risk and are solely responsible for any gains or losses incurred.
Intraday Spark Chart [AstrideUnicorn]The Intraday Spark Chart (ISC) is a minimalist yet powerful tool designed to track an asset’s performance relative to its daily opening price. Inspired by Nasdaq's trading-floor analog dashboards, it visualizes intraday percentage changes as a color-coded sparkline, helping traders quickly gauge momentum and session bias.
Ideal for: Day trading, scalping, and multi-asset monitoring.
Best paired with: 1m to 4H timeframes (auto-warns on higher TFs).
Key metrics:
Real-time % change from daily open.
Final daily % change (updated at session close).
Daily open price labels for orientation.
HOW TO USE
Visual Guide
Sparkline Plot:
A green area/line indicates price is above the daily open (bullish).
A red area/line signals price is below the daily open (bearish).
The baseline (0%) represents the daily open price.
Session Markers:
The dotted vertical lines separate trading days.
Gray labels near the baseline show the exact daily open price at the start of each session.
Dynamic Labels:
The labels in the upper left corner of each session range display the current (or final) daily % change. Color matches the trend (green/red) for instant readability.
Practical Use Cases
Opening Range Breakouts: Spot early momentum by observing how price reacts to the daily open.
Multi-Asset Screening: Compare intraday strength across symbols by choosing an asset in the indicator settings panel.
Session Close Prep: Anticipate daily settlement by tracking the final % change (useful for futures/swing traders).
SETTINGS
Asset (Input Symbol) : Defaults to the current chart symbol. Choose any asset to monitor its price action without switching charts - ideal for intermarket analysis or correlation tracking.

Sector Rotation & Money Flow Dashboard📊 Overview
The Sector Rotation & Money Flow Dashboard is a comprehensive market analysis tool that tracks 39 major sector ETFs in real-time, providing institutional-grade insights into sector rotation, momentum shifts, and money flow patterns. This indicator helps traders identify which sectors are attracting capital, which are losing favor, and where the next opportunities might emerge.
Perfect for swing traders, position traders, and investors who want to stay ahead of sector rotation and ride the strongest trends while avoiding weak sectors.
🎯 What This Indicator Does
Tracks 39 Major Sectors: From technology to utilities, cryptocurrencies to commodities
Calculates Multiple Timeframes: 1-week, 1-month, 3-month, and 6-month performance
Advanced Momentum Metrics: Proprietary momentum score and acceleration calculations
Relative Strength Analysis: Compare sector performance against any benchmark index
Money Flow Signals: Visual indicators showing where institutional money is moving
Smart Filtering: Pre-built strategy filters for different trading styles
Trend Detection: Emoji-based visual system for quick trend identification
💡 Key Features
1. Performance Metrics
Multiple timeframe analysis (1W, 1M, 3M, 6M)
Month-over-month change tracking
Relative strength vs benchmark index
2. Advanced Analytics
Momentum Score: Weighted composite of recent performance
Acceleration: Rate of change in momentum (second derivative)
Money Flow Signals: IN/OUT/TURN/WATCH indicators
3. Strategy Preset Filters
🎯 Swing Trade: High momentum opportunities
📈 Trend Follow: Established uptrends
🔄 Mean Reversion: Oversold bounce candidates
💎 Value Hunt: Deep value opportunities
🚀 Breakout: Emerging strength
⚠️ Risk Off: Sectors to avoid
4. Customization
All 39 sector ETFs can be customized
Adjustable benchmark index
Flexible display options
Multiple sorting methods
📋 Settings Documentation
Display Settings
Show Table (Default: On)
Toggles the entire dashboard display
Table Position (Default: Middle Center)
Choose from 9 positions on your chart
Options: Top/Middle/Bottom × Left/Center/Right
Rows to Show (Default: 15)
Number of sectors displayed (5-40)
Useful for focusing on top/bottom performers
Sort By (Default: Momentum)
1M/3M/6M: Sort by specific timeframe performance
Momentum: Weighted recent performance score
Acceleration: Rate of momentum change
1M Change: Month-over-month improvement
RS: Relative strength vs benchmark
Flow: IN First: Prioritize sectors with inflows
Flow: TURN First: Focus on reversal candidates
Recovery Plays: Oversold sectors recovering
Oversold Bounce: Deepest declines with positive signs
Top Gainers/Losers 3M: Best/worst quarterly performers
Best Acc + Mom: Combined strength score
Worst Acc (Topping): Sectors losing momentum
Filter Settings
Strategy Preset Filter (Default: All)
All: No filtering
🎯 Swing Trade: Mom >5, Acc >2, Money flowing in
📈 Trend Follow: Positive 1M & 3M, RS >0
🔄 Mean Reversion: Oversold but improving
💎 Value Hunt: Down >10% with recovery signs
🚀 Breakout: Rapid momentum surge
⚠️ Risk Off: Declining or topping sectors
Custom Flow Filter: Use manual flow filter
Custom Flow Signal Filter (Default: All)
Only active when Strategy Preset = "Custom Flow Filter"
IN Only: Strong inflows
TURN Only: Reversal signals
WATCH Only: Recovery candidates
OUT Only: Outflow sectors
Active Flows Only: Any non-neutral signal
Hide Low Volume ETFs (Default: Off)
Filters out illiquid sectors (future enhancement)
Visual Settings
Show Trend Emojis (Default: On)
🚀 Breakout (Strong 1M + High Acceleration)
🔥 Hot Recovery (From -10% to positive)
💪 Steady Uptrend (All timeframes positive)
➡️ Sideways/Ranging
⚠️ Warning/Topping (Up >15%, now slowing)
📉 Falling (Negative + declining)
🔄 Bottoming (Improving from lows)
Compact Mode (Default: Off)
Removes decimals for cleaner display
Useful when showing many rows
Min Data Points Required (Default: 3)
Minimum data points needed to display a sector
Prevents showing sectors with insufficient data
Relative Strength Settings
RS Benchmark Index (Default: AMEX:SPY)
Index to compare all sectors against
Can use SPY, QQQ, IWM, or any other index
RS Period (Days) (Default: 21)
Lookback period for RS calculation
21 days = 1 month, 63 days = 3 months, etc.
Sector ETF Settings (Groups 1-39)
Each sector has two inputs:
Symbol: The ticker (e.g., "AMEX:XLF")
Name: Display name (e.g., "Financials")
All 39 sectors can be customized to track different ETFs or markets.
📈 Column Explanations
Sector: ETF name/description
1M%: 1-month (21-day) performance
3M%: 3-month (63-day) performance
6M%: 6-month (126-day) performance
Mom: Momentum score (weighted average, recent-biased)
Acc: Acceleration (momentum rate of change)
Δ1M: Month-over-month change
RS: Relative strength vs benchmark
Flow: Money flow signal
↗️ IN: Strong inflows
🔄 TURN: Potential reversal
👀 WATCH: Recovery candidate
↘️ OUT: Outflows
—: Neutral
🎮 Usage Tips
For Swing Traders (3-14 days)
Use "🎯 Swing Trade" filter
Sort by "Acceleration" or "Momentum"
Look for Flow = "IN" and Mom >10
Confirm with positive RS
For Position Traders (2-8 weeks)
Use "📈 Trend Follow" filter
Sort by "RS" or "Best Acc + Mom"
Focus on consistent green across timeframes
Ensure RS >3 for market leaders
For Value Investors
Use "💎 Value Hunt" filter
Sort by "Recovery Plays" or "Top Losers 3M"
Look for improving Δ1M
Check for "WATCH" or "TURN" signals
For Risk Management
Regularly check "⚠️ Risk Off" filter
Sort by "Worst Acc (Topping)"
Review holdings for ⚠️ warning emojis
Exit sectors showing "OUT" flow
Market Regime Recognition
Bull Market: Many sectors showing "IN" flow, positive RS
Bear Market: Widespread "OUT" flows, negative RS
Rotation: Mixed flows, some "IN" while others "OUT"
Recovery: Multiple "TURN" and "WATCH" signals
🔧 Pro Tips
Combine Filters + Sorting: Filter first to narrow candidates, then sort to prioritize
Multi-Timeframe Confirmation: Best setups show alignment across 1M, 3M, and momentum
RS is Key: Sectors outperforming SPY (RS >0) tend to continue outperforming
Acceleration Matters: Positive acceleration often precedes price breakouts
Flow Transitions: "WATCH" → "TURN" → "IN" progression identifies new trends early
Regular Scans:
Daily: Check "Acceleration" sort
Weekly: Review "1M Change"
Monthly: Analyze "RS" shifts
Divergence Signals:
Price up but Acceleration down = Potential top
Price down but Acceleration up = Potential bottom
Sector Pairs Trading: Long sectors with "IN" flow, short sectors with "OUT" flow
⚠️ Important Notes
This indicator makes 40 security requests (maximum allowed)
Best used on Daily timeframe
Data updates in real-time during market hours
Some ETFs may show "—" if data is unavailable
🎯 Common Strategies
"Follow the Flow"
Only trade sectors showing "IN" flow with positive RS
"Rotation Catcher"
Focus on "TURN" signals in sectors down >15% from highs
"Momentum Rider"
Trade top 3 sectors by Momentum score, exit when Acceleration turns negative
"Mean Reversion"
Buy sectors in bottom 20% by 3M performance when Δ1M improves
"Relative Strength Leader"
Maintain positions only in sectors with RS >5
Not financial advice - always do additional research

Key Levels & Session Highs/Lows by OdegosProfessional multi-timeframe support and resistance level indicator that automatically tracks and displays key price levels across different trading sessions and timeframes.
🎯 What it shows:
Session Open - Daily market open reference line
Asia & London Sessions - High/low levels from major trading sessions
Previous Day - Yesterday's actual high and low levels
Weekly & Monthly - Higher timeframe support/resistance levels
⚡ Smart Features:
Auto-combines overlapping levels with merged labels
Break detection - Lines stop when price breaks through (optional)
Timezone support - Works with any global timezone
Universal colors - Optimized for both light and dark chart themes
Clean interface - Organized settings with intuitive dropdowns
🛠️ Fully Customizable:
Individual show/hide toggles for each level type
Custom colors, line styles, and widths
Adjustable label text and positioning
Global text color override option
Perfect for day traders, swing traders, and anyone who relies on key support/resistance levels for market analysis.

SONIC R BREAK FINAL (VER5)
Purpose: Capture breakouts through Support/Resistance (S/R) zones based on Pivot and filter signals using EMA 34 (High/Low/Close), EMA 89, volume, and candle structure. Includes a Higher Timeframe (H4) RSI risk warning (visual only, does not block entries).
How it works
S/R zones from Pivot
Draws Resistance and Support using ta.pivothigh/ta.pivotlow with Left/Right Bars.
S/R lines are locked with offset to reduce repaint.
EMA trend filters
EMA34 High/Low/Close build a “EMA 34 band”.
EMA89 works as the main trend filter.
Trend conditions:
Long: close above all EMA34 High/Low/Close and EMA89.
Short: close below all EMA34 High/Low/Close and EMA89.
Volume filter (optional)
Signal valid only if Volume > SMA(Volume, n).
Wick filter
Each wick (upper/lower) ≤ 50% of candle range to avoid weak breakouts.
Higher TF RSI risk (H4)
Fetches RSI from a higher timeframe (default H4).
If RSI exceeds threshold, breakout labels turn gray (risk warning only).
Anti-repeat mechanism
Each new pivot resets trigger.
Each S/R level triggers only once until the next pivot is formed.
Signals & Alerts
Label “B” (green) below candle: breakout above Resistance, valid EMA/Volume/Wick conditions.
Label “S” (red) above candle: breakout below Support, valid EMA/Volume/Wick conditions.
Gray labels = H4 RSI risk warning.
Unified alert: “S/R Breakout (Unified)” with message B=Buy, S=Sell, Gray=Risk.
Parameters
Show Breaks: toggle breakout detection.
Left/Right Bars: pivot sensitivity.
Require Volume > Average + Volume MA Length: volume filter.
Use H4 RSI Risk Warning: enable higher TF RSI check.
RSI Length, Higher TF (minutes), RSI thresholds for Buy/Sell risk.
Usage tips
Prioritize trades in the same direction as EMA89 and EMA34 trend.
Works on M5 to H4; best combined with RSI H4 when trading M15/M30.
Place SL behind the S/R just broken, TP by fixed RR or EMA trailing.
Increase Left/Right Bars for stronger zones and less noise in sideways markets.
Notes
Pivot still has repaint element (mitigated by offset).
This indicator is not financial advice. Always combine with proper risk management.
Version
Clean v4: added wick ≤50% filter, H4 RSI risk coloring, volume filter, anti-repeat pivot trigger, unified alert, EMA34 H/L/C background shading.
Fibo Swing MFI by julzALGOOVERVIEW
Fibo Swing MFI by julzALGO blends MFI → RSI → Least-Squares smoothing to flag overbought/oversold swings and continuously plot Fibonacci retracements from the rolling high/low of the last 200 bars. It’s built to spot momentum shifts while giving you a clean, always-current fib map of the recent market range.
CORE PRINCIPLES
Hybrid Momentum Signal
- Uses MFI to integrate price and volume.
- Applies RSI to MFI for momentum clarity.
- Smooths the result with Least Squares regression to reduce noise.
Swing Identification
- Marks potential swing highs when momentum is overbought.
- Marks potential swing lows when momentum is oversold.
Fixed-Window Fibonacci Mapping
- Always calculates fib levels from the highest high and lowest low of the last 200 bars.
- This keeps fib zones consistent, independent of swing point detection.
Visual Clarity & Non-Repainting Logic
- Clean labels for OB/OS zones.
- Lines and levels update only as new bars confirm changes.
Adaptability
- Works on any market and timeframe.
- Adjustable momentum length, OB/OS thresholds, and smoothing.
HOW IT WORKS
- Computes Money Flow Index (MFI) from price & volume.
- Applies RSI to the MFI for clearer OB/OS momentum.
- Smooths the hybrid with a Least Squares (linear regression) filter.
- Swing labels appear when OB/OS conditions are met (green = swing low, red = swing high).
- Fibonacci retracements are always drawn from the highest high and lowest low of the last 200 bars (rolling window), independent of swing labels.
HOW TO USE
- Watch for OB/OS flips to mark potential swing highs/lows.
- Use the 200-bar fib grid as your active map of pullback levels and reaction zones.
- Combine fib reactions with your price action/volume cues for confirmation.
- Works across markets and timeframes.
SETTINGS
- Length – Period for both MFI and RSI.
- OB/OS Levels – Overbought/oversold thresholds (default 70/30).
- Smooth – Least-Squares smoothing length.
- Fibonacci Window – Fixed at 200 bars in this version (changeable in code via fibLen).
NOTES
- Logic is non-repainting aside from standard bar/label confirmation.
- Increase Length on very low timeframes to reduce noise.
- Swing labels help context; fibs are always based on the most recent 200-bar high/low range.
SUMMARY
Fibo Swing MFI by julzALGO is a momentum-plus-price action tool that merges MFI → RSI → smoothing to identify overbought/oversold swings and automatically plot Fibonacci retracements based on the rolling high/low of the last 200 bars. It’s designed to help traders quickly see potential reversal points and pullback zones, offering visual confluence between momentum shifts and fixed-window price structure.
DISCLAIMER
For educational purposes only. Not financial advice. Trade responsibly with proper risk management.

QFisher-R™ [ParadoxAlgo]QFISHER-R™ (Regime-Aware Fisher Transform)
A research/education tool that helps visualize potential momentum exhaustion and probable inflection zones using a quantitative, non-repainting Fisher framework with regime filters and multi-timeframe (MTF) confirmation.
What it does
Converts normalized price movement into a stabilized Fisher domain to highlight potential turning points.
Uses adaptive smoothing, robust (MAD/quantile) thresholds, and optional MTF alignment to contextualize extremes.
Provides a Reversal Probability Score (0–100) to summarize signal confluence (extreme, slope, cross, divergence, regime, and MTF checks).
Key features
Non-repainting logic (bar-close confirmation; security() with no lookahead).
Dynamic exhaustion bands (data-driven thresholds vs fixed ±2).
Adaptive smoothing (efficiency-ratio based).
Optional divergence tags on structurally valid pivots.
MTF confirmation (same logic computed on a higher timeframe).
Compact visuals with subtle plotting to reduce chart clutter.
Inputs (high level)
Source (e.g., HLC3 / Close / HA).
Core lookback, fast/slow range blend, and ER length.
Band sensitivity (robust thresholding).
MTF timeframe(s) and agreement requirement.
Toggle divergence & intrabar previews (default off).
Signals & Alerts
Turn Candidate (Up/Down) when multiple conditions align.
Trade-Grade Turn when score ≥ threshold and MTF agrees.
Divergence Confirmed when structural criteria are met.
Alerts are generated on confirmed bar close by default. Optional “preview” mode is available for experimentation.
How to use
Start on your preferred timeframe; optionally enable an HTF (e.g., 4×) for confirmation.
Look for RPS clusters near the exhaustion bands, slope inflections, and (optionally) divergences.
Combine with your own risk management, liquidity, and trend context.
Paper test first and calibrate thresholds to your instrument and timeframe.
Notes & limitations
This is not a buy/sell signal generator and does not predict future returns.
Readings can remain extreme during strong trends; use HTF context and your own filters.
Parameters are intentionally conservative by default; adjust carefully.
Compliance / Disclaimer
Educational & research tool only. Not financial advice. No recommendation to buy/sell any security or derivative.
Past performance, backtests, or examples (if any) are not indicative of future results.
Trading involves risk; you are responsible for your own decisions and risk management.
Built upon the Fisher Transform concept (Ehlers); all modifications, smoothing, regime logic, scoring, and visualization are original work by Paradox Algo.

Fibo & Gann Advanced Auto[CongTrader]🔍 Description:
"Fibo & Gann Advanced Auto by CongTrader" is a smart automatic indicator that combines Fibonacci Retracement & Extension levels with Gann Boxes and Fan lines, helping traders identify key support/resistance zones and potential turning points in the market.
This tool automatically detects recent swing highs/lows using pivots and overlays:
📏 Fibonacci Retracement & Extension (0.236 to 1.618)
🟪 Gann Box between 2 latest pivots
📐 Gann Fan Lines (1x1, 2x1, etc.)
🟢 Optional filtered Buy/Sell signals based on wave size and RSI
Designed for discretionary and technical traders who want a visual confirmation of price geometry and market structure.
📘 How to Use:
Apply to any chart & timeframe.
Adjust pivot sensitivity via “Pivot Length” input.
Look for confluence between Fib retracement/extension and Gann box edges for trade entries.
Gann fan lines help visualize trend angles or speed.
Combine with your own strategy for better confirmation (e.g., volume, candlestick pattern).
💡 Tip: Use in higher timeframes (H1, H4, D1) for cleaner and more reliable pivots.
🙏 Thanks:
Created with love and passion for the trading community by CongTrader.
If you find it helpful, please give a like or comment. Feedback is always appreciated!
⚠️ Disclaimer:
This script is for educational and informational purposes only.
It does not constitute financial advice and should not be used as a sole basis for trading decisions.
Always use proper risk management and perform your own analysis before entering any trade.
Trading involves risk, and past performance is not indicative of future results..#fibonacci #gann #gannbox #gannfan #elliottwave #marketstructure
#priceaction #autopivot #congtrader #tradingviewindicator
#technicalanalysis #tradingtools #forextrading #cryptoindicator
#tradingstrategy #tradingsetup #smartmoney #supportresistance

Trend Signals with TP & SL Kang//@version=5
strategy("Buy/Sell with SL & TP", overlay=true, initial_capital=100000, default_qty_type=strategy.percent_of_equity, default_qty_value=10)
//===== Inputs =====
fastLen = input.int(9, "Fast MA Length")
slowLen = input.int(21, "Slow MA Length")
stopLossP = input.float(0.5, "Stop Loss %", step=0.1)
takeProfP = input.float(1.0, "Take Profit %", step=0.1)
//===== Indicators =====
fastMA = ta.ema(close, fastLen)
slowMA = ta.ema(close, slowLen)
plot(fastMA, color=color.new(color.green, 0))
plot(slowMA, color=color.new(color.red, 0))
//===== Conditions =====
longCondition = ta.crossover(fastMA, slowMA)
shortCondition = ta.crossunder(fastMA, slowMA)
//===== Entry Logic =====
if (longCondition)
strategy.entry("Long", strategy.long)
if (shortCondition)
strategy.entry("Short", strategy.short)
//===== Exit Logic =====
if (strategy.position_size > 0)
strategy.exit("Long Exit", "Long", stop=strategy.position_avg_price * (1 - stopLossP/100), limit=strategy.position_avg_price * (1 + takeProfP/100))
if (strategy.position_size < 0)
strategy.exit("Short Exit", "Short", stop=strategy.position_avg_price * (1 + stopLossP/100), limit=strategy.position_avg_price * (1 - takeProfP/100))

KhoiHV - Bollinger Bands Buy/Sell Area ProBollinger Bands Buy/Sell Area Pro is a professional-grade indicator designed to identify potential trading opportunities based on Bollinger Bands. It highlights dynamic buy and sell areas by combining price action with volatility, helping traders quickly visualize market conditions.
✨ Key Features
Automatically plots upper, middle, and lower Bollinger Bands.
Marks Buy Areas when price enters oversold zones near the lower band.
Marks Sell Areas when price enters overbought zones near the upper band.
Configurable inputs for length, source, and multiplier to fit any trading style.
Easy-to-read chart visuals with colored zones for instant recognition.
💡 How to Use
Look for Buy Areas near the lower band in trending markets to catch potential rebounds.
Watch for Sell Areas near the upper band to anticipate possible pullbacks.
Combine with volume, momentum, or trend indicators for stronger confirmation.
This tool is especially useful for traders who want a clear, visual edge in spotting volatility-based entries and exits without constantly recalculating signals.