Reversal Strength with Momentum Ratings on 4hr charts Here's a quick breakdown of what you'll see on your chart and how to actually use the indicator!
Reversal Labels:
↑ = Bullish reversal (price reversing upward)
↓ = Bearish reversal (price reversing downward)
STRONG (bright green/red) = High-confidence reversal (score > 65)
weak (faded green/red) = Low-confidence reversal (score ≤ 65)
Number on label = Reversal strength score (0-100)
Momentum Table (Top Right):
Overall Score (0-100) = Total momentum strength
Green (80+) = Very strong momentum
Yellow (40-60) = Moderate momentum
Orange/Red (<40) = Weak/stalling momentum
Individual Momentum Scores (each worth 0-20 points):
Volume = How much trading activity vs average
Price ROC = How fast price is moving (rate of change)
MA Spacing = How spread out the moving averages are (trend strength)
ADX = Directional movement indicator (trend conviction)
RSI Mom. = How far RSI is from neutral 50 (momentum extreme)
Status Indicators:
🔥 STRONG = Momentum > 70 (strong move happening)
📈 BUILDING = Momentum 50-70 (gaining strength)
⚠️ WEAK = Momentum 30-50 (losing steam)
💤 STALLING = Momentum < 30 (very weak/choppy)
Background Tint:
Light green background = Strong momentum (>70)
Light red background = Very weak momentum (<30)
The key is: look for STRONG reversal labels when momentum is building/strong for the best trade setups! Also this is mainly for the 4hr time frame.
Indicators and strategies

MP SESSIONS, DST, OTTMP SESSIONS, DST, OTT – What this indicator does
This script is a multi-session market timing tool that:
Draws full trading sessions on the chart (Asia, Sydney, Tokyo, Shanghai, Europe, London, New York, NYSE)
Automatically adjusts for Daylight Saving Time (DST) for Sydney, London, and New York
Shows a live info table with session times, DST status, and whether each session is currently open or closed
Adds optional custom “OTT” vertical lines at user-defined intraday times (for your own models, killzones, or time blocks)
Main Features (high level)
1. Market mode & time zone handling
Market Mode:
Forex
Stock
User Custom (you type your own session ranges)
TFlab suggestion (predefined “optimized” session times)
Time Zone Mode:
UTC
Session Local Time (local exchange time: Sydney, Tokyo, London, New York etc.)
Your Time Zone (converts to the user-selected TZ, e.g. UTC-4:00)
Handles separate time zones for:
Asia, Sydney, Tokyo, Shanghai, Europe, London, New York, NYSE
Has logic to recalculate session start/end depending on DST and the chosen mode.
2. Daylight Saving Time (DST) engine
The function DST_Detector:
Calculates when DST starts and ends for:
Australia/Sydney
Europe/London
America/New_York
Detects the correct Sunday (2nd, 4th, etc.) for start/end using day-of-week and week counts.
Returns 'Active' or 'Inactive' for each region.
These values are then used to shift the sessions (e.g. New York 13:00–21:00 vs 12:00–20:00 in UTC).
The script can also draw vertical lines on the chart when DST starts/ends and label them:
“Sydney DST Started / Ended”
“London DST Started / Ended”
“New York DST Started / Ended”
3. Session timing & sessions on the chart
The function Market_TimeZone_Calculator:
Based on Market Mode + Time Zone Mode + DST state, it returns:
Time ranges for: Sydney, Tokyo, Shanghai, Asia (combined), Europe, London, New York, NYSE
These ranges are in "HHMM-HHMM" format.
Then the script:
Converts these to time() conditions using the proper time zone
Creates boolean series like On_sesAsia, On_sesEurope, On_sesNewYork, etc., which are 1 when the session is open and 0 when closed.
4. Session high/low boxes & labels
The function LowHighSessionDetector:
Tracks high and low of each session while it’s active.
When a new session starts:
Resets and starts recording the session high/low.
While session is active:
Updates High with the max of current bar high and previous session high.
Updates Low with the min of current bar low and previous session low.
When the session is "on":
Draws a box from session low to high (box.new) and extends it to the right as long as the session continues.
Places a label with session name (Asia, London, New York, etc.) near the high:
Style depends on the session (down/right/left).
You have visibility toggles per session:
Asia Session, Sydney Session, Tokyo Session, Shanghai Session, Europe Session, London Session, New York Session, NYSE (for TFlab mode).
So you visually see:
A shaded box for each session
The full H/L range for that session
A text label with the session name.
5. Info table
The indicator builds a table in a corner of the chart showing:
Header:
“FOREX Session”, “Stock Market Trading Hours”, “User Custom Session”, or “TFlab suggestion” depending on mode.
Columns:
Session name (Asia, Sydney, Tokyo, Shanghai, Europe, London, New York, NYSE)
DST status for that region (“Active 🌞 / Inactive 🍂 / Not Observed”)
Session start time
Session end time
Current status (“Open / Closed”, with green/red background)
The function SplitFunction:
Parses the "HHMM-HHMM" strings for each session.
Converts them into:
Either raw times (if viewing in UTC/session local)
Or converted times in Your Time Zone using timestamp and hour/ minute with YourTZ.
Returns formatted Start and End strings like 9:30, 13:00, etc.
So the table is effectively a live session schedule that:
Auto-adjusts to DST
Can show times in your own time zone
Shows which session is open right now.
6. OTT vertical lines (custom intraday markers)
At the bottom, there is an OTT section which lets you draw up to three sets of vertical lines at specific times:
Each OTT block has:
Enable toggle (Enable OTT 1/2/3)
Start hour & minute
End hour & minute
Color
Global OTT settings:
Line style: Solid / Dashed / Dotted
Line width
Toggle: “Show OTT Labels?”
Logic:
is_ott_time() checks if current bar’s hour and minute match the OTT input time.
draw_ott():
When the bar time matches, draws a vertical line through the candle from low to high (extend.both).
Optionally adds a label above the bar, like "OTT1 Start", "OTT1 End", etc.
Use cases:
Marking open/close of your trading session
Defining killzones, news times, or custom model windows
Visual anchors for your intraday routine (NY open, 10 AM candle, etc.)

Volatility Targeting: Single Asset [BackQuant]Volatility Targeting: Single Asset
An educational example that demonstrates how volatility targeting can scale exposure up or down on one symbol, then applies a simple EMA cross for long or short direction and a higher timeframe style regime filter to gate risk. It builds a synthetic equity curve and compares it to buy and hold and a benchmark.
Important disclaimer
This script is a concept and education example only . It is not a complete trading system and it is not meant for live execution. It does not model many real world constraints, and its equity curve is only a simplified simulation. If you want to trade any idea like this, you need a proper strategy() implementation, realistic execution assumptions, and robust backtesting with out of sample validation.
Single asset vs the full portfolio concept
This indicator is the single asset, long short version of the broader volatility targeted momentum portfolio concept. The original multi asset concept and full portfolio implementation is here:
That portfolio script is about allocating across multiple assets with a portfolio view. This script is intentionally simpler and focuses on one symbol so you can clearly see how volatility targeting behaves, how the scaling interacts with trend direction, and what an equity curve comparison looks like.
What this indicator is trying to demonstrate
Volatility targeting is a risk scaling framework. The core idea is simple:
If realized volatility is low relative to a target, you can scale position size up so the strategy behaves like it has a stable risk budget.
If realized volatility is high relative to a target, you scale down to avoid getting blown around by the market.
Instead of always being 1x long or 1x short, exposure becomes dynamic. This is often used in risk parity style systems, trend following overlays, and volatility controlled products.
This script combines that risk scaling with a simple trend direction model:
Fast and slow EMA cross determines whether the strategy is long or short.
A second, longer EMA cross acts as a regime filter that decides whether the system is ACTIVE or effectively in CASH.
An equity curve is built from the scaled returns so you can visualize how the framework behaves across regimes.
How the logic works step by step
1) Returns and simple momentum
The script uses log returns for the base return stream:
ret = log(price / price )
It also computes a simple momentum value:
mom = price / price - 1
In this version, momentum is mainly informational since the directional signal is the EMA cross. The lookback input is shared with volatility estimation to keep the concept compact.
2) Realized volatility estimation
Realized volatility is estimated as the standard deviation of returns over the lookback window, then annualized:
vol = stdev(ret, lookback) * sqrt(tradingdays)
The Trading Days/Year input controls annualization:
252 is typical for traditional markets.
365 is typical for crypto since it trades daily.
3) Volatility targeting multiplier
Once realized vol is estimated, the script computes a scaling factor that tries to push realized volatility toward the target:
volMult = targetVol / vol
This is then clamped into a reasonable range:
Minimum 0.1 so exposure never goes to zero just because vol spikes.
Maximum 5.0 so exposure is not allowed to lever infinitely during ultra low volatility periods.
This clamp is one of the most important “sanity rails” in any volatility targeted system. Without it, very low volatility regimes can create unrealistic leverage.
4) Scaled return stream
The per bar return used for the equity curve is the raw return multiplied by the volatility multiplier:
sr = ret * volMult
Think of this as the return you would have earned if you scaled exposure to match the volatility budget.
5) Long short direction via EMA cross
Direction is determined by a fast and slow EMA cross on price:
If fast EMA is above slow EMA, direction is long.
If fast EMA is below slow EMA, direction is short.
This produces dir as either +1 or -1. The scaled return stream is then signed by direction:
avgRet = dir * sr
So the strategy return is volatility targeted and directionally flipped depending on trend.
6) Regime filter: ACTIVE vs CASH
A second EMA pair acts as a top level regime filter:
If fast regime EMA is above slow regime EMA, the system is ACTIVE.
If fast regime EMA is below slow regime EMA, the system is considered CASH, meaning it does not compound equity.
This is designed to reduce participation in long bear phases or low quality environments, depending on how you set the regime lengths. By default it is a classic 50 and 200 EMA cross structure.
Important detail, the script applies regime_filter when compounding equity, meaning it uses the prior bar regime state to avoid ambiguous same bar updates.
7) Equity curve construction
The script builds a synthetic equity curve starting from Initial Capital after Start Date . Each bar:
If regime was ACTIVE on the previous bar, equity compounds by (1 + netRet).
If regime was CASH, equity stays flat.
Fees are modeled very simply as a per bar penalty on returns:
netRet = avgRet - (fee_rate * avgRet)
This is not realistic execution modeling, it is just a simple turnover penalty knob to show how friction can reduce compounded performance. Real backtesting should model trade based costs, spreads, funding, and slippage.
Benchmark and buy and hold comparison
The script pulls a benchmark symbol via request.security and builds a buy and hold equity curve starting from the same date and initial capital. The buy and hold curve is based on benchmark price appreciation, not the strategy’s asset price, so you can compare:
Strategy equity on the chart symbol.
Buy and hold equity for the selected benchmark instrument.
By default the benchmark is TVC:SPX, but you can set it to anything, for crypto you might set it to BTC, or a sector index, or a dominance proxy depending on your study.
What it plots
If enabled, the indicator plots:
Strategy Equity as a line, colored by recent direction of equity change, using Positive Equity Color and Negative Equity Color .
Buy and Hold Equity for the chosen benchmark as a line.
Optional labels that tag each curve on the right side of the chart.
This makes it easy to visually see when volatility targeting and regime gating change the shape of the equity curve relative to a simple passive hold.
Metrics table explained
If Show Metrics Table is enabled, a table is built and populated with common performance statistics based on the simulated daily returns of the strategy equity curve after the start date. These include:
Net Profit (%) total return relative to initial capital.
Max DD (%) maximum drawdown computed from equity peaks, stored over time.
Win Rate percent of positive return bars.
Annual Mean Returns (% p/y) mean daily return annualized.
Annual Stdev Returns (% p/y) volatility of daily returns annualized.
Variance of annualized returns.
Sortino Ratio annualized return divided by downside deviation, using negative return stdev.
Sharpe Ratio risk adjusted return using the risk free rate input.
Omega Ratio positive return sum divided by negative return sum.
Gain to Pain total return sum divided by absolute loss sum.
CAGR (% p/y) compounded annual growth rate based on time since start date.
Portfolio Alpha (% p/y) alpha versus benchmark using beta and the benchmark mean.
Portfolio Beta covariance of strategy returns with benchmark returns divided by benchmark variance.
Skewness of Returns actually the script computes a conditional value based on the lower 5 percent tail of returns, so it behaves more like a simple CVaR style tail loss estimate than classic skewness.
Important note, these are calculated from the synthetic equity stream in an indicator context. They are useful for concept exploration, but they are not a substitute for professional backtesting where trade timing, fills, funding, and leverage constraints are accurately represented.
How to interpret the system conceptually
Vol targeting effect
When volatility rises, volMult falls, so the strategy de risks and the equity curve typically becomes smoother. When volatility compresses, volMult rises, so the system takes more exposure and tries to maintain a stable risk budget.
This is why volatility targeting is often used as a “risk equalizer”, it can reduce the “biggest drawdowns happen only because vol expanded” problem, at the cost of potentially under participating in explosive upside if volatility rises during a trend.
Long short directional effect
Because direction is an EMA cross:
In strong trends, the direction stays stable and the scaled return stream compounds in that trend direction.
In choppy ranges, the EMA cross can flip and create whipsaws, which is where fees and regime filtering matter most.
Regime filter effect
The 50 and 200 style filter tries to:
Keep the system active in sustained up regimes.
Reduce exposure during long down regimes or extended weakness.
It will always be late at turning points, by design. It is a slow filter meant to reduce deep participation, not to catch bottoms.
Common applications
This script is mainly for understanding and research, but conceptually, volatility targeting overlays are used for:
Risk budgeting normalize risk so your exposure is not accidentally huge in high vol regimes.
System comparison see how a simple trend model behaves with and without vol scaling.
Parameter exploration test how target volatility, lookback length, and regime lengths change the shape of equity and drawdowns.
Framework building as a reference blueprint before implementing a proper strategy() version with trade based execution logic.
Tuning guidance
Lookback lower values react faster to vol shifts but can create unstable scaling, higher values smooth scaling but react slower to regime changes.
Target volatility higher targets increase exposure and drawdown potential, lower targets reduce exposure and usually lower drawdowns, but can under perform in strong trends.
Signal EMAs tighter EMAs increase trade frequency, wider EMAs reduce churn but react slower.
Regime EMAs slower regime filters reduce false toggles but will miss early trend transitions.
Fees if you crank this up you will see how sensitive higher turnover parameter sets are to friction.
Final note
This is a compact educational demonstration of a volatility targeted, long short single asset framework with a regime gate and a synthetic equity curve. If you want a production ready implementation, the correct next step is to convert this concept into a strategy() script, add realistic execution and cost modeling, test across multiple timeframes and market regimes, and validate out of sample before making any decision based on the results.

"Clean Market Structure & Trend Confirmation" TP LADDER(UPDATED)Clean Market Structure & Trend Confirmation — TP Ladder
This indicator is designed to identify high-probability intraday trend trades using market structure, momentum confirmation, and a visual ribbon system, with automatic take-profit and stop-loss levels plotted after confirmed signals.
WHAT THIS INDICATOR IS FOR
This script is built for active intraday traders trading SPY, QQQ, It focuses on trend continuation and directional momentum rather than scalping chop. It works best during regular market hours with extended hours enabled.
HOW TO LOAD (IMPORTANT)
Add the script to your chart
Set chart timeframe to 5-minute
Turn Extended Trading Hours ON
Use during the NY session (especially open and trend periods)
THE RIBBON (MOST IMPORTANT RULE)
The ribbon defines the trend.
• Blue/Teal ribbon = bullish trend
• Red ribbon = bearish trend
• Gray ribbon = compression / no trade zone
Only trade in the direction of the ribbon.
No ribbon alignment = no trade.
BULL & BEAR DOTS
“BULL” dot appears when structure flips bullish.
“BEAR” dot appears when structure flips bearish.
These confirm trend direction, not entries by themselves.
BUY & SELL ARROWS (ENTRIES)
• BUY arrow prints only when bullish ribbon, structure, momentum, and filters align
• SELL arrow prints only when bearish ribbon, structure, momentum, and filters align
• Arrows are non-repainting when using close-confirmed mode
No arrow = no trade.
CONTINUATION (C) LOGIC
The script allows limited continuation entries after pullbacks when structure realigns.
By default, only one continuation per direction per day is allowed to prevent overtrading and signal spam.
TAKE-PROFIT (TP) LADDER
When a BUY or SELL arrow confirms, the script automatically plots:
• TP1 = partial profit
• TP2 = extended target
• TP3 = final extension
• STOP = ATR-based stop loss
All levels are calculated using ATR and adjust automatically to volatility.
The ladder only appears after a confirmed signal.
HOW TO TRADE IT (SIMPLE FLOW)
Identify ribbon direction
Wait for BUY or SELL arrow
Enter on confirmation
Scale out at TP1, TP2, TP3
Respect the STOP line
If structure breaks or ribbon flips, exit.
WHAT TO AVOID
• Do not trade against the ribbon
• Do not trade in gray ribbon conditions
• Do not chase candles without arrows
• Do not expect constant signals (quality over quantity)

3SPC Three Candle Price Action Setup3SPC (Three Candle Price Action Setup) is an open-source indicator designed to detect
a simple and clearly defined three-candle price action pattern.
The logic is based on the following structure:
• The first two candles move in the same direction (bullish or bearish).
• The third candle interacts with the real bodies of both previous candles,
which may indicate a short-term liquidity sweep or price reaction.
• A bullish setup is confirmed when price holds above the open of the first candle.
• A bearish setup is confirmed when price holds below the open of the first candle.
This script does not use oscillators or lagging indicators.
It is intended as a visual aid for discretionary traders and should be used
together with market context, risk management and higher timeframe analysis.
The script is published as open-source for educational and transparency purposes.
UI Labels Translation:
- نمایش ستاپ صعودی: Show bullish setups
- نمایش ستاپ نزولی: Show bearish setups

COIN-Clean Market Structure & Trend Confirmation TP(Updated)COIN-Clean Market Structure & Trend Confirmation TP(Updated) — COIN (Simple Trend + Buy/Sell Confirmation + Take-Profit Targets)
This indicator is designed to help you trade COIN by clearly showing trend direction, confirmation signals, and predefined take-profit levels. It removes guesswork and helps you stay on the right side of the move.
HOW TO LOAD
Add the indicator to a COIN chart. Turn on Extended Hours for best results. The default settings are already optimized and do not need to be changed.
THE RIBBON (WHAT TO TRADE)
The ribbon shows the overall trend.
Teal ribbon = price is trending up (look for BUY setups).
Red ribbon = price is trending down (look for SELL setups).
Gray ribbon = no clear trend (do not trade).
If the ribbon is gray, the indicator will block signals to protect you from choppy markets.
BULL AND BEAR DOTS (TREND CHANGE ALERTS)
Bull dot appears when the trend turns bullish.
Bear dot appears when the trend turns bearish.
These dots are early warnings, not entries. Always wait for a BUY or SELL arrow before taking a trade.
BUY AND SELL ARROWS (WHEN TO ENTER)
BUY arrows appear only when conditions strongly favor upward movement.
SELL arrows appear only when conditions strongly favor downward movement.
These arrows are confirmation signals. Enter only after the arrow appears.
Not every move will get a signal. Fewer, higher-quality signals are intentional.
OPENING BIAS (FIRST MINUTES PROTECTION)
Right after the market opens, the indicator sets a directional bias.
During this time, it will only allow trades in the safer direction.
This helps avoid getting chopped up during the opening volatility.
TAKE-PROFIT TARGETS AND STOP
When a BUY or SELL arrow appears, take-profit levels automatically show on the chart:
TP1, TP2, and TP3 are profit targets.
STOP is where the trade is considered wrong.
You can scale out at each target or exit fully at any level.
Only the most recent targets are shown to keep the chart clean.
SIMPLE WAY TO USE IT
Check the ribbon color (teal or red).
Ignore the chart if the ribbon is gray.
Wait for a BUY or SELL arrow.
Use the take-profit targets and stop provided.
Do not chase moves without arrows.
IMPORTANT NOTES
This indicator does not repaint confirmed signals.
It is meant to keep trading simple and disciplined.
It works best during strong trend days, not sideways markets.

Heikin Ashi + Real Price OverlayHeikin-Ashi + Real Price Overlay
This indicator combines the smooth trend visualization of Heikin-Ashi candles with the true market price for precise execution.
Features:
Heikin-Ashi Candles: Provides a clear, smoothed view of market trends and momentum.
Real Close Price Overlay: Plots the actual closing price as a line on top of HA candles, ensuring accurate entry, exit, and stop placement.
Trend-Based Coloring: The real price line is colored according to HA trend (green for bullish, red for bearish), making trend bias instantly visible.
Lightweight and ideal for scalping, day trading, or any strategy where trend bias + exact price matters.
Use Case:
Use HA candles to identify market bias and momentum.
Use the real price line for precise entries, exits, and stop levels.
Perfect for traders who want the clarity of HA without sacrificing real price accuracy.

X-Trend Macro Command CenterX-Trend Macro Command Center (MCC) | Institutional Grade Dashboard
📝 Description Body
The Invisible Engine of the Market Revealed.
Traders often focus solely on Price Action, ignoring the massive underwater currents that actually drive trends: Global Liquidity, Inflation, and Central Bank Policy. We created X-Trend Macro Command Center (MCC) to solve this problem.
This is not just an indicator. It is a fundamental heads-up display that bridges the gap between technical charts and macroeconomic reality.
💡 The Idea & Philosophy
Markets don't move in a vacuum. Bull runs are fueled by M2 Money Supply expansion and negative real yields. Crashes are triggered by liquidity crunches and aggressive rate hikes. X-Trend MCC was built to give retail traders the same "Macro Awareness" that institutional desks possess. It aggregates fragmented economic data from Federal Reserve databases (FRED) directly onto your chart in real-time.
🚀 Application & Logic
This tool is designed for Trend Traders, Crypto Investors, and Macro Analysts.
Identify the Regime: Instantly see if the environment is "RISK ON" (High Liquidity, Low Real Rates) or "RISK OFF" (Monetary Tightening).
Validate the Trend: Don't buy the dip if Liquidity (M2) is crashing. Don't short the rally if Real Yields are negative.
Multi-Region Analysis: Switch instantly between economic powerhouses (US, China, Japan) to see where the capital is flowing.
📊 Dashboard Metrics Explained
Every row in the Command Center tells a specific story about the economy:
Interest Rate: The "Gravity" of finance. Higher rates weigh down risk assets (Stocks/Crypto).
Inflation (YoY): The erosion of purchasing power. We calculate this dynamically based on CPI data.
Real Yield (The "Golden" Metric): Calculated as Interest Rate - Inflation.
Green: Real Yield is low/negative. Cash is trash, assets fly.
Red: Real Yield is high. Cash is King, assets struggle.
US Debt & GDP: Fiscal health indicators formatted in Trillions ($T). Watch the Debt-to-GDP ratio—if it spikes >120%, expect currency debasement.
M2 Money Supply: The fuel tank of the market. Tracks the total amount of money in circulation.
↗ Trend: Liquidity is entering the system (Bullish).
↘ Trend: Liquidity is drying up (Bearish).
🧩 The X-Trend Ecosystem
X-Trend MCC is just the tip of the iceberg. This module is part of the larger X-Trend Project — a comprehensive suite of algorithmic tools being developed to quantify market chaos. While our Price Action algorithms (Lite/Pro/Ultra) handle the Micro, the MCC handles the Macro.
Technical Note:
Data Sources: Direct connection to FRED (Federal Reserve Economic Data).
Zero Repainting: Historical data is requested strictly using closed bars to ensure accuracy.
Open Source: We believe in transparency. The code is open for study under MPL 2.0.
Build by Dev0880 | X-Trend © 2025

EMA COLOR CHANCE
indicator("Renk Değiştiren EMA & Mum Al-Sat", overlay=true)
emaLength = input.int(50, "EMA Periyodu", minval=1)
emaValue = ta.ema(close, emaLength)
trendUp = close > emaValue
trendDown = close < emaValue
plot(emaValue, title="EMA", color = (trendUp ? color.lime : color.red), linewidth=2)
barcolor(trendUp ? color.lime : color.red)
buySignal = ta.crossover(close, emaValue)
sellSignal = ta.crossunder(close, emaValue)
plotshape(buySignal, title="BuySignal", location=location.belowbar, style=shape.triangleup, size=size.large, color=color.lime)
plotshape(sellSignal, title="SellSignal", location=location.abovebar, style=shape.triangledown, size=size.large, color=color.red)
alertcondition(buySignal, title="AL Sinyali", message="AL sinyali - fiyat EMA'yı yukarı kesti")
alertcondition(sellSignal, title="SAT Sinyali", message="SAT sinyali - fiyat EMA'yı aşağı kesti")

Demi's + EMAs + VWAP + Key SR Lines + RSI SignalsBasic buy sell script for 5 min chart updated daily

Liquidity Sweep Reentry ToolkitHere’s a clear breakdown of what your Liquidity Sweep Reentry Toolkit script does, and how you can use it on your charts:
🔎 Script Breakdown
1. Visual Controls (Inputs)
• : Master toggle to turn all visuals on/off.
• : Show labels when a liquidity sweep + ChoCh condition occurs.
• : Plot green/red triangles for bullish/bearish reentry signals.
• : Prevent multiple signals within the same swing.
• : Show HH/HL/LL/LH market structure letters.
• : Slider to adjust how dim the background of HH/HL/LL/LH labels appear.
2. Core Conditions
• Defines simple bullish () and bearish () candles.
• is a placeholder for your Change of Character logic.
3. Sweep Detection
• : Detects when price makes a new high compared to the last 5 bars.
• : Detects when price makes a new low compared to the last 5 bars.
4. Restriction Flags
• Tracks whether a sweep signal has already triggered in the current swing.
• Resets when sweeps end, so new signals can appear.
5. Composite Triggers
• : Fires when bullish candle + buy-side sweep + ChoCh condition align.
• : Fires when bearish candle + sell-side sweep + ChoCh condition align.
6. Visual Labels
• Gold labels mark “BS Sweep + ChoCh” or “SS Sweep + ChoCh” events.
• Green triangle below bar = bullish reentry.
• Red triangle above bar = bearish reentry.
• Blue HH/HL/LL/LH labels narrate market structure pivots, with adjustable transparency.
7. Alerts
• Alerts can be set for bullish or bearish sweep reentry triggers, so you get notified when conditions align.
📘 How to Use It
1. Apply to Chart
Add the script to your TradingView chart (works best on intraday timeframes like 5‑minute).
2. Configure Visuals
• Use the Visual Controls panel to toggle features on/off.
• Adjust the Label Transparency slider to dim or brighten the HH/HL/LL/LH labels.
3. Interpret Signals
• Gold labels show when a sweep + ChoCh condition occurs.
• Triangles mark potential reentry points (green = bullish, red = bearish).
• HH/HL/LL/LH labels narrate market structure shifts for clarity.
4. Set Alerts
• Use the built‑in alert conditions to get notified when bullish or bearish sweep reentry triggers fire.
👉 In short: this toolkit helps you spot liquidity sweeps, confirm with ChoCh, and visualize reentry signals, while also narrating market structure pivots. It’s modular, so you can toggle features depending on how much visual clutter you want.
🛠 Workflow Example
1. Setup
• Apply the script to your chart (e.g., 5‑minute S&P futures).
• In the indicator settings, decide which visuals you want:
• Turn on Sweep + ChoCh labels if you want to see gold tags narrating liquidity events.
• Keep Entry triangles on to highlight actionable reentry points.
• Adjust the Label Transparency slider so HH/HL/LL/LH structure labels are dim enough not to clutter.
2. Watch for Sweeps
• As price pushes above recent highs → a Buy‑side Sweep is detected.
• As price dips below recent lows → a Sell‑side Sweep is detected.
• If ChoCh logic is true at the same time, you’ll see a gold label (“BS Sweep + ChoCh” or “SS Sweep + ChoCh”).
3. Confirm Reentry
• If conditions align (bullish candle + buy‑side sweep + ChoCh), you’ll see a green triangle below the bar.
• If bearish candle + sell‑side sweep + ChoCh, you’ll see a red triangle above the bar.
• These triangles are your potential reentry triggers.
4. Narrate Market Structure
• HH/HL/LL/LH labels appear at pivots, giving you a running commentary of structure shifts.
• Example: HH → HL → HH shows bullish continuation; LH → LL → LH shows bearish pressure.
• Use the transparency slider to keep these labels subtle but visible.
5. Alerts
• Set alerts for “Bullish Sweep Reentry” or “Bearish Sweep Reentry” so you don’t miss signals even if you’re away from the screen.
📘 How to Use in Practice
• Intraday trading: On a 5‑minute chart, use the toolkit to spot liquidity grabs and confirm reentry points.
• Narration: The HH/HL/LL/LH labels help you keep track of structure without manually marking pivots.
• Decision making: Gold labels + triangles = potential trade setups. Structure labels = context for trend bias.
• Customization: Dim labels when you want a cleaner chart, brighten them when you’re focused on structure.
👉 In short: this script gives you a modular toolkit — sweeps, ChoCh confirmation, reentry signals, and structure narration — all adjustable so you can tailor the visuals to your workflow.
📈 Bullish Scenario Walkthrough
1. Market Context
• You’re watching the 5‑minute chart.
• Price has been consolidating near recent highs, building liquidity above.
2. Liquidity Sweep
• Price spikes above the prior swing high → the script detects a buy‑side sweep.
• A gold label appears: “BS Sweep + ChoCh” (if your ChoCh condition is true).
3. Change of Character (ChoCh)
• The candle closes bullish ().
• Your ChoCh condition confirms a structural shift.
• Together, sweep + ChoCh = potential reentry setup.
4. Reentry Trigger
• The script plots a green triangle below the bar.
• This marks a bullish sweep reentry signal: price grabbed liquidity and is now showing strength.
5. Market Structure Narration
• At the same time, the HH/HL labels update:
• The sweep bar prints a new HH.
• The next pivot low prints an HL.
• This narrates bullish continuation: HH → HL → HH.
6. Trade Decision
• You can use the green triangle as your entry cue.
• The HH/HL narration gives you confidence that structure supports the trade.
• Alerts can be set so you don’t miss the trigger.
7. Risk Management
• Stop placement: below the HL pivot or sweep low.
• Target: next liquidity pool above, or measured move.
🧭 How to Use This in Practice
• Gold label = liquidity event + ChoCh confirmation.
• Green triangle = actionable bullish reentry trigger.
• HH/HL narration = context for trend bias and trade management.
• Transparency slider = keep structure labels subtle so the chart stays clean.
📉 Bearish Scenario Walkthrough
1. Market Context
• You’re watching the 5‑minute chart.
• Price has been consolidating near recent lows, building liquidity underneath.
2. Liquidity Sweep
• Price spikes below the prior swing low → the script detects a sell‑side sweep.
• A gold label appears: “SS Sweep + ChoCh” (if your ChoCh condition is true).
3. Change of Character (ChoCh)
• The candle closes bearish ().
• Your ChoCh condition confirms a structural shift.
• Together, sweep + ChoCh = potential bearish reentry setup.
4. Reentry Trigger
• The script plots a red triangle above the bar.
• This marks a bearish sweep reentry signal: price grabbed liquidity below and is now showing weakness.
5. Market Structure Narration
• At the same time, the LH/LL labels update:
• The sweep bar prints a new LL.
• The next pivot high prints a LH.
• This narrates bearish continuation: LH → LL → LH.
6. Trade Decision
• You can use the red triangle as your entry cue.
• The LH/LL narration gives you confidence that structure supports the short.
• Alerts can be set so you don’t miss the trigger.
7. Risk Management
• Stop placement: above the LH pivot or sweep high.
• Target: next liquidity pool below, or measured move.
🧭 How to Use This in Practice
• Gold label = liquidity event + ChoCh confirmation.
• Red triangle = actionable bearish reentry trigger.
• LH/LL narration = context for trend bias and trade management.
• Transparency slider = keep structure labels subtle so the chart stays clean.

Confluence Levels + Vol Triangles + No-Trade GrayWhen two levels cross: Premarket High (PMH), Premarket Low (PML), Yesterday High (YH), Yesterday Low (YL), Opening Range High (ORH), Opening Range Low (ORL),VWAP, you get a confluence trigger (line cross) that is green for a bull signal and red for a bear signal. Orange line cross signals confluence, but it is unclear what direction. Additional confluence is signaled by a triangle once volume

BTC - Bitcoin Strategic Dashboard by RM Title: BTC - Bitcoin Strategic Dashboard | RM
Overview & Philosophy
The Bitcoin Strategic Dashboard is a comprehensive analytics tool designed to provide deeper market context beyond simple price action.
While a standard chart displays price history, this dashboard focuses on the structural health of the market. It aims to answer clearer questions: Is the asset statistically overextended? Is the current volatility compressed or expanding? How is Bitcoin currently correlating with traditional equity markets?
This script aggregates key data points—Performance, Risk, Valuation, and Macro Correlations—into a single, organized table. It is designed to be a quiet, high-density reference tool that sits unobtrusively in the corner of your screen, helping to contextualize daily price movements without cluttering your workspace.
Methodology & Module Breakdown
The dashboard is divided into 5 strategic modules. Here is exactly how to read them, how they are calculated, and how to interpret the data.
1. PERFORMANCE
This section answers: "Is Bitcoin actually beating the traditional market, and by how much?"
BTC Return : The raw percentage growth of Bitcoin.
Timeframes: 1-Year (Tactical Trend) and 4-Year (The Halving Cycle).
Alpha (vs SPX / Gold):
Meaning : "Alpha" measures true outperformance. It tells you how much better your capital worked in Bitcoin compared to the S&P 500 (Stocks) or Gold.
Calculation : We use a Relative Growth Ratio. Instead of simple subtraction, we calculate the growth factor of BTC divided by the growth factor of the Benchmark.
Interpretation :
Green: Bitcoin is outperforming. It is the superior vehicle for capital.
Red: Bitcoin is underperforming traditional assets (Opportunity Cost is high).
2. RISK PROFILE
This section answers: "How dangerous is the market right now?"
Drawdown (DD):
Meaning : The percentage loss from the 1-Year High.
Interpretation : Deep Drawdowns (e.g., > -50%) historically signal generational buying opportunities (Deep Red). Small Drawdowns (< -5%) signal we are near "Discovery Mode" (Blue/Green).
Sharpe Ratio:
Meaning : The industry standard for "Risk-Adjusted Return." It asks: "Is the profit worth the stress?"
Timeframe : Annualized over 365 Days.
Interpretation :
> 1.0: Good. The return justifies the risk.
> 2.0: Excellent. (Dark Green).
< 0.0: Bad. You are taking risk for negative returns.
Sortino Ratio:
Meaning : Similar to Sharpe, but it only counts downside volatility as "risk." Bitcoin often rallies aggressively (Good Volatility); Sortino ignores the upside "risk" and focuses only on minimizing losses.
Volatility (Vol) & Rank:
Meaning : How violently the price is moving.
Calculation : We compare the current 30-Day Volatility against the last 4 Years of volatility history (Rank 0-100).
Interpretation (The Squeeze Strategy) :
BLUE (Cold / <25%): Volatility is historically low. The market is "compressed." Big moves often follow these periods.
RED (Hot / >75%): Volatility is extreme. High risk of mean reversion or panic.
3. VALUATION & MOMENTUM
This section answers: "Is Bitcoin cheap or expensive?"
Mayer Multiple (MM):
Meaning: A "Godfather" of Bitcoin ratios.
Calculation : Current Price divided by the 200-Day Moving Average.
Interpretation :
< 0.8 (Blue): Historically "Cheap."
1.0: Fair Value (Price = Trend).
> 2.4 (Red): Speculative Bubble territory.
RSI (Relative Strength Index):
Timeframe : 14 Days.
Interpretation : >70 suggests the market is overheated (Red). <30 suggests oversold conditions (Blue).
Trend (ADX) :
Meaning : The Average Directional Index measures the strength of a trend, not the direction.
Interpretation : Values >25 (Green) indicate a strong trend is present. Values <20 (Gray) indicate a choppy/sideways market (no trend).
vs 200W (Macro):
Meaning : The distance to the 200-Week Moving Average.
Interpretation : This line is historically the "Cycle Bottom" or "Absolute Support" for Bitcoin. Being close to it (or below it) is rare and often marks cycle lows.
4. MACRO CORRELATIONS
This section answers: "Is Bitcoin moving on its own, or just following the Stock Market?"
vs TradFi (SPX):
Timeframe : 90-Day Correlation Coefficient.
Interpretation :
High Positive (Red): BTC is just acting like a tech stock. No "Safe Haven" status.
Negative/Zero (Green): BTC is "decoupled." It is moving independently of Wall Street.
vs DXY (US Dollar):
Interpretation : Bitcoin usually moves inverse to the Dollar.
Negative (Green): Normal healthy behavior.
Positive (Red): Warning signal. If both DXY and BTC rise, something is breaking in the system.
5. HISTORICAL LEDGER
A Year-by-Year breakdown of returns.
Feature : You can toggle the comparison column in the settings to compare Bitcoin against either S&P 500 or Gold.
Usage : Helps visualize the cyclical nature of returns (e.g., the 4-year cycle pattern of Green-Green-Green-Red).
How to Read the Visuals (Heatmap)
The dashboard uses a standardized Bloomberg-style heatmap to let you assess the market state in milliseconds:
🟢 Green: Profit / Good Performance / Positive Alpha.
🔴 Red: Loss / Overheating / High Risk.
🔵 Blue: "Cold" / Cheap / Low Volatility (Potential Buy Zones).
🟠 Orange: Warning / High Drawdown.
⚫ Gray/Black: Neutral or Fair Value.
Settings & Customization
Visuals: Change the text size (Tiny, Small, Normal) to fit your screen resolution.
Modules: You can toggle individual sections on/off to save screen space.
Calculation: Switch the Historical Benchmark between "S&P 500" and "Gold" depending on your thesis.
Disclaimer
This script is for research and educational purposes only. The metrics provided (Sharpe, Sortino, Mayer Multiple) are derived from historical data and do not guarantee future performance. "Cheap" (Low Mayer Multiple) does not mean the price cannot go lower. Always manage your own risk.
Tags
bitcoin, btc, bloomberg, terminal, dashboard, onchain, mayer multiple, sharpe ratio, volatility, alpha, risk management, Rob Maths

Kinetic RSI [Vel + Accel] + AlertsThe Problem with Standard RSI
Most traders use the Relative Strength Index (RSI) to see if a market is "Overbought" (above 70) or "Oversold" (below 30). The problem? A strong trend can stay overbought for days, burning short sellers, or an asset can stay oversold while price continues to crash. Standard RSI tells you where the price is, but it doesn't tell you how hard it is moving.
The Solution: Kinetic RSI
This script reimagines RSI by applying basic physics concepts: Velocity and Acceleration.
Instead of asking "Is RSI below 30?", this indicator asks: "Is RSI below 35 AND did it just make a violent, high-speed turn upwards?"
It filters out lazy, drifting price action and only signals when momentum is accelerating in a new direction.
How It Works (The Math)
Velocity: We calculate the speed of the RSI change (Current RSI - Previous RSI).
Acceleration: We calculate if that speed is increasing (Current Velocity - Previous Velocity).
The Trigger: A signal is only generated if the RSI is in an extreme zone (<35 or >65) AND it has high Velocity AND positive Acceleration.
How to Trade It
1. The "Kick" Signals (Background Highlights)
🟢 Green Background (Bullish Kick): The RSI was low, but buyers stepped in aggressively. The momentum is not just positive; it is accelerating upward. This is often a "V-Bottom" catch.
🔴 Red Background (Bearish Kick): The RSI was high, but sellers slammed the price down. Momentum is accelerating downward.
2. The Line Color
Lime Line: Velocity is positive (Momentum is rising).
Fuchsia Line: Velocity is negative (Momentum is falling).
Usage: If the background flashes Green (Buy Signal), but the line turns back to Fuchsia (Red) a few bars later, the move has failed—exit the trade.
Settings & Alerts
RSI Length: Standard 14 (Adjustable).
Velocity Threshold: Controls sensitivity.
Lower (e.g., 2-3): More signals, catches smaller reversals.
Higher (e.g., 5+): Fewer signals, catches only massive "shocks" to the price.
Alerts Included: You can set alerts for "Bullish Kick," "Bearish Kick," or "Any Kick" to get notified of volatility spikes.
Best Practices
Wait for the Close: This indicator measures the closing velocity. Always wait for the bar to close to confirm the background color signal.
Trend Filtering: This works best as a "Reversal" indicator. If the market is in a super-strong uptrend, ignore the Bearish (Red) signals and only take the Bullish (Green) dips.

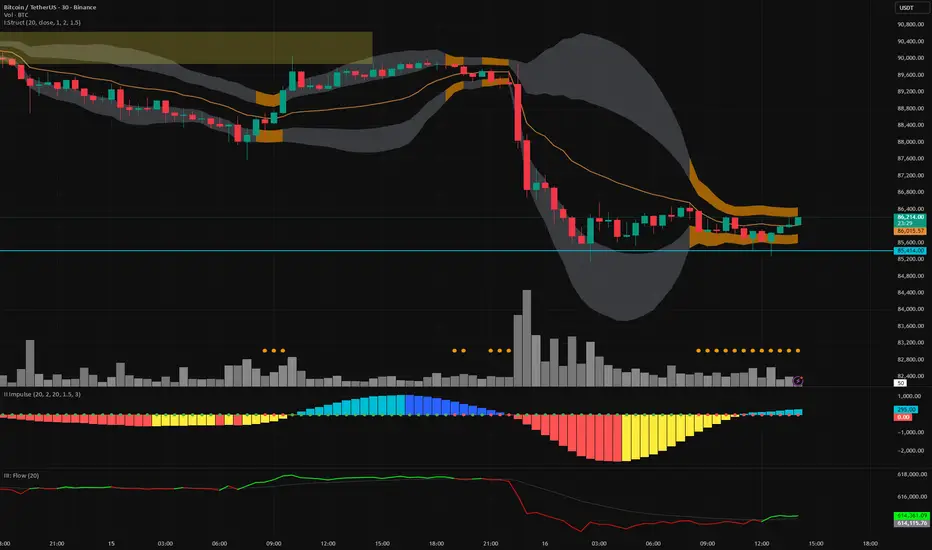
Vector Trinity indicator II: [Bottom: TTM Squeeze]**1. Introduction: The Engine of the System**
This indicator is **Part 2** of the "Vector Trinity" trading system. While Part I (Structure) defines *where* the price is, **Part II (Impulse)** defines *when* the move will happen and *how strong* it is.
It represents the **Time Dimension** of the system, focusing on momentum ignition and energy release.
* **I: Structure:** Spatial boundaries.
* **II: Impulse:** **Momentum velocity & Squeeze timing (Current Indicator).**
* **III: Flow:** Capital validation.
**2. Core Logic: Linear Regression Momentum**
Unlike standard momentum indicators (like MACD) which are based on Moving Averages and often lag significantly, **Vector Trinity II** utilizes **Linear Regression** on price deviations.
* **Math:** It calculates the distance between the price and the mean, then runs a linear regression to determine the angle of attack.
* **Benefit:** This provides a near-instantaneous reading of market "Velocity" and "Acceleration," reducing lag and allowing traders to see the turn before price fully commits.
**3. The "Squeeze" Mechanics (The Dots)**
The central line features dots that indicate the volatility state of the market:
* **🔴 Red Dot (Squeeze ON):** The Bollinger Bands have moved inside the Keltner Channels. Volatility is critically low. The market is storing energy like a compressed spring. **Action:** Wait. Do not trade yet.
* **🟢 Green Dot (Squeeze Fired):** The Bands have popped out of the Channels. The energy is releasing. **Action:** This is the "Ignition" signal. Look at the histogram color for direction.
**4. The 4-Color Momentum System**
The histogram bars are color-coded to tell the full story of the trend's lifecycle, not just direction:
* **Bullish Territory (Above 0):**
* **🟦 Cyan (Light Blue):** **Bullish Acceleration.** Buyers are aggressive. Momentum is increasing. (Best for entry).
* **🔷 Blue (Dark Blue):** **Bullish Deceleration.** Buyers are tired. Momentum is fading. (Prepare to take profit).
* **Bearish Territory (Below 0):**
* **🟥 Red:** **Bearish Acceleration.** Sellers are aggressive. Momentum is increasing. (Best for shorting).
* **🟨 Yellow:** **Bearish Deceleration.** Sellers are exhausted. Momentum is recovering towards zero. (Warning: Trend potential reversal).
**5. How to Use**
* **Step 1:** Look for **Red Dots** on the zero line. This identifies a high-potential setup building up.
* **Step 2:** Wait for the **First Green Dot**. This is the "Squeeze Fired" signal.
* **Step 3:** Confirm with the **Histogram Color**.
* If Green Dot + **Cyan Bar** = Long Signal.
* If Green Dot + **Red Bar** = Short Signal.
* **Advanced:** Use the **Yellow Bars** as an early warning to exit short positions before price actually reverses.
**Settings:**
* **Length:** 20 (Standard calculation period).
* **BB/KC Mult:** 2.0 / 1.5 (Standard ratios to define the Squeeze).
* **Smoothing:** Enabled (Default 3) to reduce noise and provide clearer color transitions.
---
### **中文说明**
**1. 简介:系统的核心引擎**
本指标是“矢量三位一体”交易系统的 **第二部分**。如果说第一部分 (Structure) 定义了价格*在哪里*,那么 **第二部分 (Impulse)** 则定义了行情*何时*启动以及力度*有多强*。
它代表了系统的 **时间维度**,专注于动能的点火与能量释放。
* **I: Structure 结构:** 空间边界。
* **II: Impulse 脉冲:** **动能速度与挤压时机(本指标)。**
* **III: Flow 流向:** 资金验证。
**2. 核心逻辑:线性回归动能**
传统的动能指标(如 MACD)通常基于移动平均线,存在显著的滞后性。**Vector Trinity II** 采用了基于价格偏离度的 **Linear Regression (线性回归)** 算法。
* **数学原理:** 它计算价格与均值的距离,并通过回归分析确定攻击的角度。
* **优势:** 这提供了几乎零滞后的市场“速度”与“加速度”读数,允许交易者在价格完全反转之前看到动能的拐点。
**3. “挤压”机制 (圆点信号)**
0轴上的圆点指示了市场的波动率状态:
* **🔴 红点 (Squeeze ON):** 布林带完全进入了肯特纳通道内部。波动率极低。市场像被压缩的弹簧一样在积蓄能量。**操作:** 等待,不要急于进场。
* **🟢 绿点 (Squeeze Fired):** 布林带扩张冲出通道。能量开始释放。**操作:** 这是“点火”信号。观察柱状图颜色以确定方向。
**4. 四色动能战术系统**
柱状图通过四种颜色讲述了趋势完整的生命周期,而不仅仅是涨跌:
* **多头区域 (0轴上方):**
* **🟦 青色 (Cyan):** **多头加速。** 买盘积极,动能增强。(最佳进场期)
* **🔷 蓝色 (Blue):** **多头减速。** 买盘疲惫,动能衰减。(准备止盈)
* **空头区域 (0轴下方):**
* **🟥 红色 (Red):** **空头加速。** 卖盘积极,动能增强。(最佳做空期)
* **🟨 黄色 (Yellow):** **空头减速。** 卖盘力竭,动能向0轴修复。(警告:趋势可能反转/抄底信号)
**5. 使用方法**
* **第一步:** 寻找0轴上的 **红点**。这标志着一个高爆发潜力的机会正在酝酿。
* **第二步:** 等待 **第一个绿点** 出现。这是“挤压释放/点火”的信号。
* **第三步:** 结合 **柱状图颜色** 确认。
* 绿点 + **青色柱** = 做多信号。
* 绿点 + **红色柱** = 做空信号。
* **进阶用法:** 利用 **黄色柱** 作为空单止盈的先行指标,往往在价格反弹之前,动能就已经变黄了。
**参数设置:**
* **Length (周期):** 20 (标准计算周期)。
* **BB/KC Mult (倍数):** 2.0 / 1.5 (定义挤压状态的标准比率)。
* **Smoothing (平滑):** 开启 (默认3) 以减少噪音,提供更平滑的颜色转换体验。


Moving Averages 20 & 200Moving Averages 20&200. Help you decide buy signal to find bullish or bearish.

Vector Trinity III: Flow [CVD]**1. Introduction: The Truth Serum**
This indicator is **Part 3** of the "Vector Trinity" trading system. It is the final validator in the decision-making process.
While Part I defines the *Structure* and Part II identifies the *Impulse*, **Part III (Flow)** answers the most critical question in trading: **"Is there real money behind this move?"**
It represents the **Energy Dimension**, analyzing the Cumulative Volume Delta (CVD) to spot true breakouts and expose traps.
* **I: Structure:** Spatial boundaries.
* **II: Impulse:** Momentum timing.
* **III: Flow:** **Capital validation & Divergence detection (Current Indicator).**
**2. Core Logic: CVD Estimation**
True "Delta" requires tick-by-tick data, which is often unavailable or premium-locked. **Vector Trinity III** uses a sophisticated **Intrabar Position Estimation** algorithm to mathematically approximate buying vs. selling pressure:
* **The Math:** It analyzes where the Close sits relative to the High and Low of the candle.
* Close near High = Dominant Aggressive Buying.
* Close near Low = Dominant Aggressive Selling.
* **The CVD:** It accumulates these delta values over time to create a continuous "Flow" line. This reveals the long-term intent of smart money.
**3. The Trend Line & Divergence**
The indicator features a **Grey Trend Line** (EMA of CVD) which serves as the baseline for "Net Flow."
* **Teal Zone (Above Trend):** Net Inflow. Capital is aggressively entering the market, supporting the price.
* **Maroon Zone (Below Trend):** Net Outflow. Capital is leaving the market, suggesting weakness.
**4. The "Trap" Detector (Divergence)**
The primary superpower of this indicator is spotting **Divergences**:
* **The Bull Trap (Fakeout):** Price makes a Higher High, but CVD makes a Lower High (or trends down).
* *Meaning:* The price is rising due to a lack of liquidity, not aggressive buying. **Smart money is selling into the rally.**
* **The Bear Trap (Shakeout):** Price makes a Lower Low, but CVD makes a Higher Low.
* *Meaning:* Smart money is absorbing the selling pressure (buying the dip).
**5. How to Use**
* **The "Trinity" Confirmation:** Before taking a trade based on Part I (Structure) and Part II (Impulse), look at Part III.
* **For a Long Setup:**
1. Price breaks the Structure (Part I).
2. Momentum fires Green/Cyan (Part II).
3. **Flow (Part III) MUST be Teal and rising.**
* **The Veto Rule:** If Price breaks up, but Flow is Maroon/Falling, **CANCEL the trade**. It is likely a trap.
**Settings:**
* **Trend Length:** 20 (Standard trend baseline to determine Net Inflow/Outflow).
---
### **中文说明**
**1. 简介:市场的“测谎仪”**
本指标是“矢量三位一体”交易系统的 **第三部分**。它是决策过程中最后的验证者。
第一部分 (Structure) 定义了结构,第二部分 (Impulse) 识别了脉冲,而 **第三部分 (Flow)** 则回答了交易中最关键的问题:**“这波行情背后有真钱吗?”**
它代表了系统的 **能量维度**,通过分析累积成交量 Delta (CVD) 来识别真正的突破并揭露市场陷阱。
* **I: Structure 结构:** 空间边界。
* **II: Impulse 脉冲:** 动能时机。
* **III: Flow 流向:** **资金验证与背离侦测(本指标)。**
**2. 核心逻辑:CVD 估算算法**
真正的“Delta”数据通常需要逐笔成交数据 (Tick Data),这往往需要付费数据源。**Vector Trinity III** 使用了一套精密的 **K线内相对位置估算 (Intrabar Position Estimation)** 算法,在数学上逼近真实的买卖压力:
* **算法原理:** 它分析收盘价在 K 线最高价和最低价之间的相对位置。
* 收盘接近最高价 = 主动买入主导。
* 收盘接近最低价 = 主动卖出主导。
* **CVD (累积值):** 它将这些 Delta 值随时间累积,形成一条连续的“资金流向”线。这揭示了主力资金的长期意图。
**3. 趋势线与背离**
指标包含一条 **灰色趋势线** (CVD 的均线),作为“净流量”的基准。
* **青色区域 (趋势线上方):** 净流入。资金正在积极入场,支撑价格上涨。
* **深红区域 (趋势线下方):** 净流出。资金正在撤离市场,暗示行情虚弱。
**4. “陷阱”侦测器 (背离)**
本指标的核心超能力是识别 **背离 (Divergence)**:
* **多头陷阱 (诱多/假突破):** 价格创出新高,但 CVD 却创出新低(或趋势向下)。
* *含义:* 价格上涨是因为缺乏流动性(空涨),而不是因为有主动买盘。**主力资金正在借反弹出货。**
* **空头陷阱 (诱空/洗盘):** 价格创出新低,但 CVD 却在抬高。
* *含义:* 主力资金正在吸收抛压(在此位置吸筹)。
**5. 使用方法**
* **“三位一体”共振验证:** 在根据第一部分 (结构) 和第二部分 (脉冲) 开单之前,必须查看第三部分。
* **做多设置:**
1. 价格突破结构 (Part I)。
2. 动能点火变绿/青色 (Part II)。
3. **资金流 (Part III) 必须呈现青色且向上攀升。**
* **一票否决权:** 如果价格向上突破,但资金流是深红色/下降的,**立即取消交易**。这极大概率是一个陷阱。
**参数设置:**
* **Trend Length (趋势周期):** 20 (用于确定净流入/流出的标准基准线)。
Vector Trinity I: Structure [VWAP-DBB] This indicator is **Part 1** of the "Vector Trinity" trading system—a comprehensive, data-driven framework designed to analyze market behavior through three distinct physical dimensions:
* **I: Structure (Space):** Defines the battlefield and volatility boundaries (Current Indicator).
* **II: Impulse (Time):** Identifies momentum ignition and energy release.
* **III: Flow (Energy):** Validates the move via volume and capital flow.
**2. Core Logic: Why Rolling VWAP?**
Most standard Bollinger Bands use a Simple Moving Average (SMA) as the centerline. The flaw in SMA is that it treats every candle equally, regardless of trading activity.
**Vector Trinity I** replaces the SMA with a **Rolling VWAP (Volume-Weighted Average Price)** over a rolling window (default 20).
* **Data Logic:** Price combined with Volume represents the true "cost basis" of the market.
* **Behavior:** The centerline becomes "sticky" during high-volume nodes and moves faster when real capital enters. It represents the *True Mean* of the market structure.
**3. The Dual-Band "Highway" Structure**
Instead of a single channel, this system utilizes a Double Bollinger Band (DBB) architecture based on Standard Deviations (StdDev) from the VWAP:
* **The Noise Zone (Basis to 1.0 StdDev):** The empty space in the middle. Price action here is often choppy and directionless.
* **The Acceleration Zone (1.0 to 2.0 StdDev):** The filled "Cloud." When candles close and stay within this zone, it indicates a strong trend (The Highway).
* **The Reversion Zone (> 2.0 StdDev):** Price is statistically extended and may revert to the mean.
**4. Volatility Squeeze Detection**
The indicator integrates a mechanical "Squeeze" detection based on the relationship between the Bollinger Bands (Variance) and Keltner Channels (ATR).
* **Squeeze ON (Orange Cloud & Dots):** Daily variance is at extreme lows. Energy is compressing. Do not trade direction; prepare for a breakout.
* **Squeeze OFF (Grey Cloud):** Expansion phase. Volatility is returning to the market.
**5. How to Use**
* **Step 1:** Observe the **Purple Line (VWAP)**. Its slope dictates the dominant trend structure.
* **Step 2:** Look for **Orange Zones**. This indicates a "Squeeze." Wait for the cloud to turn Grey.
* **Step 3:** Trade the breakout when price closes inside the "Acceleration Zone" (between the inner and outer bands) accompanied by Volume.
**Settings:**
* **Rolling Length:** 20 (Standard for swing/day trading).
* **Inner/Outer Bands:** 1.0 / 2.0 (The standard trend definition).
* **Squeeze Sensitivity:** 1.5 (Standard KC Multiplier).
---
### **中文说明**
**1. 简介:矢量三位一体系统 (Vector Trinity)**
本指标是“矢量三位一体”交易系统的 **第一部分**。这是一套基于数据逻辑的综合分析框架,旨在通过三个物理维度解构市场行为:
* **I: Structure 结构 (空间):** 定义价格运行的战场边界与波动率结构(本指标)。
* **II: Impulse 脉冲 (时间):** 识别动能的点火与能量释放。
* **III: Flow 流向 (能量):** 通过成交量与资金流验证突破的真伪。
**2. 核心逻辑:为什么要用 Rolling VWAP?**
传统的布林带使用简单移动平均线 (SMA) 作为中轨。SMA 的缺陷在于它平等地对待每一根 K 线,而忽略了成交量的权重。
**Vector Trinity I** 使用 **Rolling VWAP (滚动成交量加权平均价)** 替代了 SMA。
* **数据逻辑:** 只有结合了成交量的价格,才代表市场真实的“平均持仓成本”。
* **表现特征:** 在放量交易区,中轨会表现出更强的支撑/阻力特性;在缩量区则表现平滑。它代表了市场结构的*真实均值*。
**3. 双通道“高速公路”结构**
本系统不使用单条轨道,而是基于 VWAP 的标准差 (StdDev) 构建了双重布林带 (DBB) 架构:
* **噪音区 (中轨 到 1.0 标准差):** 中间的空白区域。在此区域内的价格通常是无方向的震荡。
* **加速区 (1.0 到 2.0 标准差):** 填充颜色的“云带”。当 K 线收盘并运行于此区域时,代表趋势确立,价格进入了“高速公路”。
* **回归区 (> 2.0 标准差):** 价格在统计学上过热,可能面临均值回归。
**4. 波动率挤压监测 (Squeeze)**
指标内置了基于布林带(方差)与肯特纳通道(ATR)对比的机械化“挤压”监测。
* **挤压状态 (橙色云带 & 底部圆点):** 每日方差处于极低值 (Variance at extreme lows)。市场正在积蓄能量。此时不应猜测方向,而应等待爆发。
* **扩张状态 (灰色云带):** 挤压结束,波动率回归,趋势展开。
**5. 使用方法**
* **第一步:** 观察 **紫色中轨 (VWAP)**。它的倾斜方向决定了主要的结构趋势。
* **第二步:** 寻找 **橙色区域**。这代表“挤压”正在发生。耐心等待云带变回灰色。
* **第三步:** 当价格突破并收盘在“加速区”(内轨与外轨之间)时,配合成交量介入交易。
**参数设置:**
* **Rolling Length (周期):** 20 (波段/日内交易的标准设置)。
* **Inner/Outer Bands (内外轨):** 1.0 / 2.0 (经典的趋势定义范围)。
* **Squeeze Sensitivity (敏感度):** 1.5 (标准肯特纳通道倍数)。

ETIQUETAS 5M.This is the best way to determinate interval from five minutes to 1 minute in that time range of 9:25 am to 4:15 pm. you can know how to enter or exit trading action.

Rainbow MA Width█ OVERVIEW
Rainbow MA Width is a companion indicator for Rainbow MA Cloud. It displays ribbon width as a normalized Z-Score, allowing traders to visualize trend momentum expansion and contraction relative to recent history.
█ CONCEPTS
Z-Score Normalization:
Rather than displaying raw width values (which vary by asset and timeframe),
this indicator normalizes the ribbon width using Z-Score calculation:
Z-Score = (Current Width - Average Width) / Standard Deviation
Z-Score Interpretation:
• 0 = Average width (mean)
• +1 to +2 = Expanding (above average, strong trend)
• -1 to -2 = Contracting (below average, weakening trend)
• Beyond ±2 = Extreme (statistical outlier, potential reversal)
Width Calculation Modes:
• Outer — Distance between fastest and slowest MA: |MA1 - MA8|
• Average Gap — Mean of all adjacent MA gaps
• Total Gap — Sum of all adjacent MA gaps
█ FEATURES
1 — Width Mode Selection
Three methods to calculate ribbon width.
"Outer" recommended for aligned trends.
2 — Z-Score Period
Configurable lookback for mean and standard deviation.
Default 20 bars; increase for smoother, less reactive readings.
3 — Zone Fill Coloring
Cyan fill when expanding (Z > 0).
Orange fill when contracting (Z < 0).
Yellow fill for extreme values (|Z| > 2) as warning.
4 — Alignment Background
Green background during bullish alignment.
Red background during bearish alignment.
Synced with Rainbow MA Cloud for consistency.
5 — Reference Lines
Horizontal lines at 0 (mean), ±1σ, and ±2σ levels.
Provides clear visual boundaries for interpretation.
6 — Raw Width Display
Optional secondary line showing original width percentage.
Useful for comparing normalized vs absolute values.
█ HOW TO USE
Trend Confirmation:
• Z-Score rising above 0 confirms trend acceleration
• Z-Score staying above +1 indicates sustained strong momentum
• Use alongside alignment background for confluence
Reversal Warning:
• Z-Score exceeding +2 suggests overextension (yellow warning zone)
• Z-Score dropping below -2 indicates extreme contraction
• Extreme readings often precede trend reversals or consolidation
Entry Timing:
• Enter trends when Z-Score crosses above 0 (expansion beginning)
• Avoid entries when Z-Score is at extreme highs (potential exhaustion)
• Consider exits when Z-Score peaks and begins declining
█ LIMITATIONS
• Z-Score is relative to lookback period; different periods give different readings
• Extreme zones (±2) are statistical guides, not guarantees
• Best used in conjunction with Rainbow MA Cloud for full context
█ ALERTS
Four built-in alert conditions:
• Z-Score crosses above/below zero
• Z-Score enters extreme high/low zones (±2)

Large Candle HighlightHighlights candles whose range exceeds a specified threshold by shading the chart background.
This indicator is designed to visually identify unusually large price movements without generating trade signals.
キャンドルの長さを設定し、数値以上なら背景をハイライトするインジケーターです。
