EMA MACD - 5-20Based on Crossover and Big timeframe EMA Support and resistance this strategy is developed.
Indicators and strategies

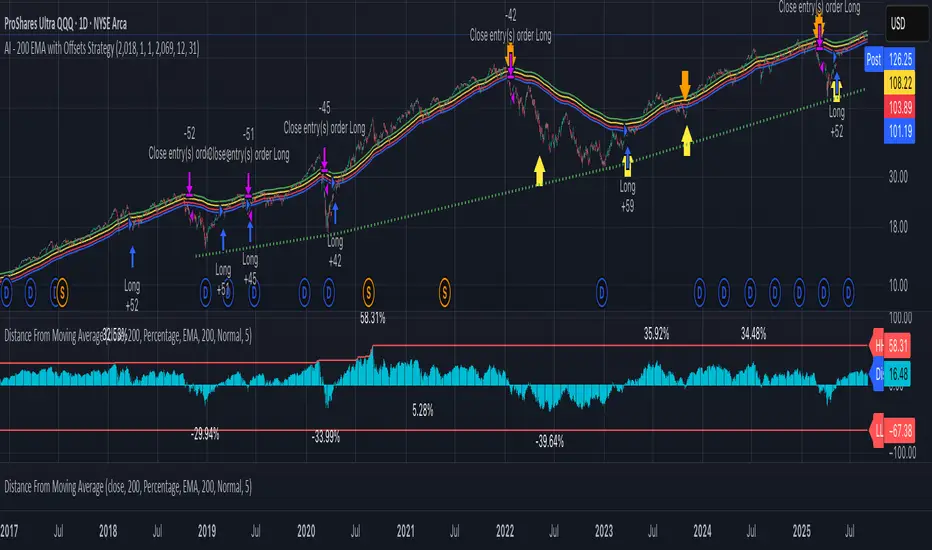
AI - 200 EMA with Offsets StrategyLong when close price crosses above +4% offset 200 day EMA
Sell when close price crosses below -6.5% offset 200 day EMA
EMA20 Cross Strategy with countertrades and signalsEMA20 Cross Strategy Documentation
Overview
The EMA20 Cross Strategy with Counter-Trades and Instant Signals is a Pine Script (version 6) trading strategy designed for the TradingView platform. It implements an Exponential Moving Average (EMA) crossover system to generate buy and sell signals, with optional trend filtering, session-based trading, instant signal processing, and visual/statistical feedback. The strategy supports counter-trades (closing opposing positions before entering new ones) and operates with a fixed trade size in EUR.
Features
EMA Crossover Mechanism:
Uses a short-term EMA (configurable length, default: 1) and a long-term EMA (default: 20) to detect crossovers.
A buy signal is generated when the short EMA crosses above the long EMA.
A sell signal is generated when the short EMA crosses below the long EMA.
Instant Signals:
If enabled (useInstantSignals), signals are based on the current price crossing the short EMA, rather than waiting for the candle close.
This allows faster trade execution but may increase sensitivity to price fluctuations.
Trend Filter:
Optionally filters trades based on the trend direction (useTrendFilter).
Long trades are allowed only when the short EMA (or price, for instant signals) is above the long EMA.
Short trades are allowed only when the short EMA (or price) is below the long EMA.
Session Filter:
Restricts trading to specific market hours (sessionStart, default: 09:00–17:00) if enabled (useSessionFilter).
Ensures trades occur only during active market sessions, reducing exposure to low-liquidity periods.
Customizable Timeframe:
The EMA calculations can use a higher timeframe (e.g., 5m, 15m, 1H, 4H, 1D, default: 1H) via request.security.
This allows the strategy to base signals on longer-term trends while operating on a shorter-term chart.
Trade Management:
Fixed trade size of €100,000 per trade (tradeAmount), with a maximum quantity cap (maxQty = 10,000) to prevent oversized trades.
Counter-trades: Closes short positions before entering a long position and vice versa.
Trades are executed with a minimum quantity of 1 to ensure valid orders.
Visualization:
EMA Lines: The short EMA is colored based on the last signal (green for buy, red for sell, gray for neutral), and the long EMA is orange.
Signal Markers: Displays buy/sell signals as arrows (triangles) above/below candles if enabled (showSignalShapes).
Background/Candle Coloring: Optionally colors the chart background or candles green (bullish) or red (bearish) based on the trend (useColoredBars).
Statistics Display:
If enabled (useStats), a label on the chart shows:
Total closed trades
Open trades
Win rate (%)
Number of winning/losing trades
Profit factor (gross profit / gross loss)
Net profit
Maximum drawdown
Configuration Inputs
EMA Short Length (emaLength): Length of the short-term EMA (default: 1).
Trend EMA Length (trendLength): Length of the long-term EMA (default: 20).
Enable Trend Filter (useTrendFilter): Toggles trend-based filtering (default: true).
Color Candles (useColoredBars): Colors candles instead of the background (default: true).
Enable Session Filter (useSessionFilter): Restricts trading to specified hours (default: false).
Trading Session (sessionStart): Defines trading hours (default: 09:00–17:00).
Show Statistics (useStats): Displays performance stats on the chart (default: true).
Show Signal Arrows (showSignalShapes): Displays buy/sell signals as arrows (default: true).
Use Instant Signals (useInstantSignals): Generates signals based on live price action (default: false).
EMA Timeframe (emaTimeframe): Timeframe for EMA calculations (options: 5m, 15m, 1H, 4H, 1D; default: 1H).
Strategy Logic
Signal Generation:
Standard Mode: Signals are based on EMA crossovers (short EMA crossing long EMA) at candle close.
Instant Mode: Signals are based on the current price crossing the short EMA, enabling faster reactions.
Trade Execution:
On a buy signal, closes any short position and opens a long position.
On a sell signal, closes any long position and opens a short position.
Position size is calculated as the minimum of €100,000 or available equity, divided by the current price, capped at 10,000 units.
Filters:
Trend Filter: Ensures trades align with the trend direction (if enabled).
Session Filter: Restricts trades to user-defined market hours (if enabled).
Visual Feedback
EMA Lines: Provide a clear view of the short and long EMAs, with the short EMA’s color reflecting the latest signal.
Signal Arrows: Large green triangles (buy) below candles or red triangles (sell) above candles for easy signal identification.
Chart Coloring: Highlights bullish (green) or bearish (red) trends via background or candle colors.
Statistics Label: Displays key performance metrics in a label above the chart for quick reference.
Usage Notes
Initial Capital: €100,000 (configurable via initial_capital).
Currency: EUR (set via currency).
Order Processing: Orders are processed at candle close (process_orders_on_close=true) unless instant signals are enabled.
Dynamic Requests: Allows dynamic timeframe adjustments for EMA calculations (dynamic_requests=true).
Platform: Designed for TradingView, compatible with any market supported by the platform (e.g., stocks, forex, crypto).
Example Use Case
Scenario: Trading on a 5-minute chart with a 1-hour EMA timeframe, trend filter enabled, and session filter set to 09:00–17:00.
Behavior: The strategy will:
Calculate EMAs on the 1-hour timeframe.
Generate buy signals when the short EMA crosses above the long EMA (and price is above the long EMA).
Generate sell signals when the short EMA crosses below the long EMA (and price is below the long EMA).
Execute trades only during 09:00–17:00.
Display green/red candles and performance stats on the chart.
Limitations
Instant Signals: May lead to more frequent signals, increasing the risk of false positives in volatile markets.
Fixed Trade Size: Does not adjust dynamically based on market conditions beyond equity and max quantity limits.
Session Filter: Simplified and may not account for complex session rules or holidays.
Statistics: Displayed on-chart, which may clutter the view in smaller charts.
Customization
Adjust emaLength and trendLength to suit different market conditions (e.g., shorter for scalping, longer for swing trading).
Toggle useInstantSignals for faster or more stable signal generation.
Modify sessionStart to align with specific market hours.
Disable useStats or showSignalShapes for a cleaner chart.
This strategy is versatile for both manual and automated trading, offering flexibility for various markets and trading styles while providing clear visual and statistical feedback.

Trend Scalping Strategy Overview
This is a short-term trading strategy designed to capitalize on momentum shifts within a broader trend. It combines multiple technical indicators across different timeframes—including Stochastic, RSI, and custom trend logic—to generate entry and exit signals. The strategy incorporates a time filter to operate only during specified high-liquidity hours and includes a mandatory end-of-session close-out to avoid overnight risk. It is suitable for volatile markets like equities, futures, and cryptocurrencies.
Input Parameters
Source
The price data used for calculations. Default is hl2 (the average of high and low prices).
Short Term Trend (x_len_a)
The period for the short-term RSI calculation. Default is 5. Used to capture recent price momentum.
Long Term Trend (x_len_b)
The period for the Stochastic Oscillator calculation. Default is 60. Defines the medium-to-long-term trend context.
Smooth Long Term Trend (x_k_b)
The smoothing period applied to the Stochastic value (K). Default is 13. Reduces noise for a clearer trend signal.
Clear Short Term Pullback Appears Recently (x_changk)
The lookback period to identify a recent significant pullback. Default is 15.
Threshold of Short Term Pullback Clear (x_rsi_ct)
The RSI level indicating an oversold (for longs) or overbought (for shorts) condition. Default is 35.0.
Threshold of Short Term Pullback End (x_rsi_ft)
The RSI level signaling that the short-term pullback has concluded and momentum is reversing. Default is 50.0.
Exit if Reason Over (x_exit_if_reason_over)
A boolean switch. If enabled, the strategy will automatically close a position if the original entry condition is no longer valid.
Time Filter (Start/End Hour & Minute)
Defines the specific intraday window during which the strategy is active (e.g., 7:00 to 15:10). All trades are initiated and managed only within this window.
Strategy Logic
Indicator Calculation:
y_stoch: The raw Stochastic Oscillator value calculated over the x_len_b period.
y_k: A smoothed version of the Stochastic (y_stoch) using a Simple Moving Average with period x_k_b.
y_rsi: The Relative Strength Index calculated on the Source price over the short-term period x_len_a.
Entry & Exit Conditions:
The core logic generates a composite signal (y_upper for long, y_lower for short) based on three components:
The deviation of the smoothed Stochastic (y_k) from its midpoint (50).
The deviation of the RSI (y_rsi) from its pullback-end threshold (x_rsi_ft).
The extremity of the recent RSI move compared to the pullback-clear threshold (x_rsi_ct) over the x_changk period.
Long Entry (LE): Triggered when the composite signal y_upper is greater than 0 AND the current time is within the allowed trading window.
Short Entry (SE): Triggered when the composite signal y_lower is less than 0 AND the current time is within the allowed trading window.
Conditional Exit: If x_exit_if_reason_over is true, long positions are closed if y_upper <= 0, and short positions are closed if y_lower >= 0.
Time-Based Filter:
The strategy only evaluates entries and exits if the current bar's time falls within the user-defined start_time and end_time range.
Mandatory Close-Out:
A critical risk management feature: All open positions are automatically closed at 16:10 (4:10 PM) based on the chart's timezone, ensuring no positions are held overnight or into the late session.
Plotting
The strategy plots three key series in the indicator pane:
Stochastic (y_stoch): Red line.
Smoothed Stochastic (y_k): Blue line.
RSI (y_rsi): Yellow line.
A hline at 50 serves as a visual midpoint reference for both Stochastic and RSI.
Usage Recommendations
This strategy performs best in markets with high volatility and strong trending characteristics.
It is highly recommended to use this script with a brokerage account that supports and enforces stop-loss orders on the strategy's behalf, as the script itself does not calculate stop-loss levels.
Parameters, especially periods and thresholds, should be optimized for the specific asset and timeframe being traded.
Always conduct rigorous backtesting and forward testing before deploying capital. 策略概述
本策略是一个基于多时间框架动能的短线交易策略,通过结合短期与长期趋势指标、RSI超买超卖判断以及时间过滤机制,在趋势明确时入场,并在特定条件或时间点退出交易。策略适用于股票、期货、加密货币等高频波动的市场。
输入参数说明
数据源(Source)
默认使用 hl2(最高最低价的平均值),也可选择其他价格数据。
短期趋势周期(Short Term Trend)
默认值为5,用于计算短期RSI,捕捉近期价格动量的变化。
长期趋势周期(Long Term Trend)
默认值为60,用于计算随机指标(Stochastic)的周期,判断中长期趋势方向。
长期趋势平滑周期(Smooth Long Term Trend)
默认值为13,对长期随机指标进行平滑处理,减少噪音。
近期回调检测周期(Clear Short Term Pullback Appears Recently)
默认值为15,用于检测短期是否出现明显回调。
RSI超卖阈值(Threshold of Short Term Pullback Clear)
默认值为35.0,RSI低于该值视为短期超卖,可能出现反弹。
RSI回调结束阈值(Threshold of Short Term Pullback End)
默认值为50.0,RSI回升至此表示短期回调结束。
条件失效时退出(Exit if Reason Over)
若启用,当入场条件不再成立时自动平仓。
交易时间范围
可设置策略运行的开始与结束时间(以小时和分钟为单位),仅在指定时间段内交易。
策略逻辑
指标计算:
随机指标(Stochastic):基于长期周期计算,反映价格在近期区间内的位置。
平滑随机值(y_k):对随机指标进行移动平均平滑处理。
RSI指标:基于短期周期计算,反映近期价格动量的强弱。
多空判断:
多头信号(y_upper):
当平滑随机值高于50、RSI高于结束阈值,且近期出现明显超卖回调时,触发做多信号。
空头信号(y_lower):
当平滑随机值低于50、RSI低于结束阈值,且近期出现明显超买回调时,触发做空信号。
时间过滤:
策略仅在用户设定的时间范围内(例如7:00至15:10)运行,避免在波动性较低或非主力交易时段操作。
强制平仓机制:
每天下午16:10(或指定时间区间)强制平仓所有头寸,避免隔夜风险或尾盘波动。
图表显示
策略在副图中绘制以下三条线:
随机指标(红色)
平滑随机值(蓝色)
RSI指标(黄色)
水平线50:作为多空分界线参考。
使用建议
本策略适合在流动性高、波动性强的市场中运行。
建议配合止损机制使用,以控制单笔交易风险。
用户可根据不同品种调整参数周期和阈值,优化入场时机。

Optimized ADX DI CCI Strategy### Key Features:
- Combines ADX, DI+/-, CCI, and RSI for signal generation.
- Supports customizable timeframes for indicators.
- Offers multiple exit conditions (Moving Average cross, ADX change, performance-based stop-loss).
- Tracks and displays trade statistics (e.g., win rate, capital growth, profit factor).
- Visualizes trades with labels and optional background coloring.
- Allows countertrading (opening an opposite trade after closing one).
1. **Indicator Calculation**:
- **ADX and DI+/-**: Calculated using the `ta.dmi` function with user-defined lengths for DI and ADX smoothing.
- **CCI**: Computed using the `ta.cci` function with a configurable source (default: `hlc3`) and length.
- **RSI (optional)**: Calculated using the `ta.rsi` function to filter overbought/oversold conditions.
- **Moving Averages**: Used for CCI signal smoothing and trade exits, with support for SMA, EMA, SMMA (RMA), WMA, and VWMA.
2. **Signal Generation**:
- **Buy Signal**: Triggered when DI+ > DI- (or DI+ crosses over DI-), CCI > MA (or CCI crosses over MA), and optional ADX/RSI filters are satisfied.
- **Sell Signal**: Triggered when DI+ < DI- (or DI- crosses over DI+), CCI < MA (or CCI crosses under MA), and optional ADX/RSI filters are satisfied.
3. **Trade Execution**:
- **Entry**: Long or short trades are opened using `strategy.entry` when signals are detected, provided trading is allowed (`allow_long`/`allow_short`) and equity is positive.
- **Exit**: Trades can be closed based on:
- Opposite signal (if no other exit conditions are used).
- MA cross (price crossing below/above the exit MA for long/short trades).
- ADX percentage change exceeding a threshold.
- Performance-based stop-loss (trade loss exceeding a percentage).
- **Countertrading**: If enabled, closing a trade triggers an opposite trade (e.g., closing a long opens a short).
4. **Visualization**:
- Labels are plotted at trade entries/exits (e.g., "BUY," "SELL," arrows).
- Optional background coloring highlights open trades (green for long, red for short).
- A statistics table displays real-time metrics (e.g., capital, win rates).
5. **Trade Tracking**:
- Tracks the number of long/short trades, wins, and overall performance.
- Monitors equity to prevent trading if it falls to zero.
### 2.3 Key Components
- **Indicator Calculations**: Uses `request.security` to fetch indicator data for the specified timeframe.
- **MA Function**: A custom `ma_func` handles different MA types for CCI and exit conditions.
- **Signal Logic**: Combines crossover/under checks with recent bar windows for flexibility.
- **Exit Conditions**: Multiple configurable exit strategies for risk management.
- **Statistics Table**: Updates dynamically with trade and capital metrics.
## 3. Configuration Options
The script provides extensive customization through input parameters, grouped for clarity in the TradingView settings panel. Below is a detailed breakdown of each setting and its impact.
### 3.1 Strategy Settings (Global)
- **Initial Capital**: Default `10000`. Sets the starting capital for backtesting.
- **Effect**: Determines the base equity for calculating position sizes and performance metrics.
- **Default Quantity Type**: `strategy.percent_of_equity` (50% of equity).
- **Effect**: Controls the size of each trade as a percentage of available equity.
- **Pyramiding**: Default `2`. Allows up to 2 simultaneous trades in the same direction.
- **Effect**: Enables multiple entries if conditions are met, increasing exposure.
- **Commission**: 0.2% per trade.
- **Effect**: Simulates trading fees, reducing net profit in backtesting.
- **Margin**: 100% for long and short trades.
- **Effect**: Assumes no leverage; adjust for margin trading simulations.
- **Calc on Every Tick**: `true`.
- **Effect**: Ensures real-time signal updates for precise execution.
### 3.2 Indicator Settings
- **Indicator Timeframe** (`indicator_timeframe`):
- **Options**: `""` (chart timeframe), `1`, `5`, `15`, `30`, `60`, `240`, `D`, `W`.
- **Default**: `""` (uses chart timeframe).
- **Effect**: Determines the timeframe for ADX, DI, CCI, and RSI calculations. A higher timeframe reduces noise but may delay signals.
### 3.3 ADX & DI Settings
- **DI Length** (`adx_di_len`):
- **Default**: `30`.
- **Range**: Minimum `1`.
- **Effect**: Sets the period for calculating DI+ and DI-. Longer periods smooth trends but reduce sensitivity.
- **ADX Smoothing Length** (`adx_smooth_len`):
- **Default**: `14`.
- **Range**: Minimum `1`.
- **Effect**: Smooths the ADX calculation. Longer periods produce smoother ADX values.
- **Use ADX Filter** (`use_adx_filter`):
- **Default**: `false`.
- **Effect**: If `true`, requires ADX to exceed the threshold for signals to be valid, filtering out weak trends.
- **ADX Threshold** (`adx_threshold`):
- **Default**: `25`.
- **Range**: Minimum `0`.
- **Effect**: Sets the minimum ADX value for valid signals when the filter is enabled. Higher values restrict trades to stronger trends.
### 3.4 CCI Settings
- **CCI Length** (`cci_length`):
- **Default**: `20`.
- **Range**: Minimum `1`.
- **Effect**: Sets the period for CCI calculation. Longer periods reduce noise but may lag.
- **CCI Source** (`cci_src`):
- **Default**: `hlc3` (average of high, low, close).
- **Effect**: Defines the price data for CCI. `hlc3` is standard, but users can choose other sources (e.g., `close`).
- **CCI MA Type** (`ma_type`):
- **Options**: `SMA`, `EMA`, `SMMA (RMA)`, `WMA`, `VWMA`.
- **Default**: `SMA`.
- **Effect**: Determines the moving average type for CCI signal smoothing. EMA is more responsive; VWMA weights by volume.
- **CCI MA Length** (`ma_length`):
- **Default**: `14`.
- **Range**: Minimum `1`.
- **Effect**: Sets the period for the CCI MA. Longer periods smooth the MA but may delay signals.
### 3.5 RSI Filter Settings
- **Use RSI Filter** (`use_rsi_filter`):
- **Default**: `false`.
- **Effect**: If `true`, applies RSI-based overbought/oversold filters to signals.
- **RSI Length** (`rsi_length`):
- **Default**: `14`.
- **Range**: Minimum `1`.
- **Effect**: Sets the period for RSI calculation. Longer periods reduce sensitivity.
- **RSI Lower Limit** (`rsi_lower_limit`):
- **Default**: `30`.
- **Range**: `0` to `100`.
- **Effect**: Defines the oversold threshold for buy signals. Lower values allow trades in more extreme conditions.
- **RSI Upper Limit** (`rsi_upper_limit`):
- **Default**: `70`.
- **Range**: `0` to `100`.
- **Effect**: Defines the overbought threshold for sell signals. Higher values allow trades in more extreme conditions.
### 3.6 Signal Settings
- **Cross Window** (`cross_window`):
- **Default**: `0`.
- **Range**: `0` to `5` bars.
- **Effect**: Specifies the lookback period for detecting DI+/- or CCI crosses. `0` requires crosses on the current bar; higher values allow recent crosses, increasing signal frequency.
- **Allow Long Trades** (`allow_long`):
- **Default**: `true`.
- **Effect**: Enables/disables new long trades. If `false`, only closing existing longs is allowed.
- **Allow Short Trades** (`allow_short`):
- **Default**: `true`.
- **Effect**: Enables/disables new short trades. If `false`, only closing existing shorts is allowed.
- **Require DI+/DI- Cross for Buy** (`buy_di_cross`):
- **Default**: `true`.
- **Effect**: If `true`, requires a DI+ crossover DI- for buy signals; if `false`, DI+ > DI- is sufficient.
- **Require CCI Cross for Buy** (`buy_cci_cross`):
- **Default**: `true`.
- **Effect**: If `true`, requires a CCI crossover MA for buy signals; if `false`, CCI > MA is sufficient.
- **Require DI+/DI- Cross for Sell** (`sell_di_cross`):
- **Default**: `true`.
- **Effect**: If `true`, requires a DI- crossover DI+ for sell signals; if `false`, DI+ < DI- is sufficient.
- **Require CCI Cross for Sell** (`sell_cci_cross`):
- **Default**: `true`.
- **Effect**: If `true`, requires a CCI crossunder MA for sell signals; if `false`, CCI < MA is sufficient.
- **Countertrade** (`countertrade`):
- **Default**: `true`.
- **Effect**: If `true`, closing a trade triggers an opposite trade (e.g., close long, open short) if allowed.
- **Color Background for Open Trades** (`color_background`):
- **Default**: `true`.
- **Effect**: If `true`, colors the chart background green for long trades and red for short trades.
### 3.7 Exit Settings
- **Use MA Cross for Exit** (`use_ma_exit`):
- **Default**: `true`.
- **Effect**: If `true`, closes trades when the price crosses the exit MA (below for long, above for short).
- **MA Length for Exit** (`ma_exit_length`):
- **Default**: `20`.
- **Range**: Minimum `1`.
- **Effect**: Sets the period for the exit MA. Longer periods delay exits.
- **MA Type for Exit** (`ma_exit_type`):
- **Options**: `SMA`, `EMA`, `SMMA (RMA)`, `WMA`, `VWMA`.
- **Default**: `SMA`.
- **Effect**: Determines the MA type for exit signals. EMA is more responsive; VWMA weights by volume.
- **Use ADX Change Stop-Loss** (`use_adx_stop`):
- **Default**: `false`.
- **Effect**: If `true`, closes trades when the ADX changes by a specified percentage.
- **ADX % Change for Stop-Loss** (`adx_change_percent`):
- **Default**: `5.0`.
- **Range**: Minimum `0.0`, step `0.1`.
- **Effect**: Specifies the percentage change in ADX (vs. previous bar) that triggers a stop-loss. Higher values reduce premature exits.
- **Use Performance Stop-Loss** (`use_perf_stop`):
- **Default**: `false`.
- **Effect**: If `true`, closes trades when the loss exceeds a percentage threshold.
- **Performance Stop-Loss (%)** (`perf_stop_percent`):
- **Default**: `-10.0`.
- **Range**: `-100.0` to `0.0`, step `0.1`.
- **Effect**: Specifies the loss percentage that triggers a stop-loss. More negative values allow larger losses before exiting.
## 4. Visual and Statistical Output
- **Labels**: Displayed at trade entries/exits with arrows (↑ for buy, ↓ for sell) and text ("BUY," "SELL"). A "No Equity" label appears if equity is zero.
- **Background Coloring**: Optionally colors the chart background (green for long, red for short) to indicate open trades.
- **Statistics Table**: Displayed at the top center of the chart, updated on timeframe changes or trade events. Includes:
- **Capital Metrics**: Initial capital, current capital, capital growth (%).
- **Trade Metrics**: Total trades, long/short trades, win rate, long/short win rates, profit factor.
- **Open Trade Status**: Indicates if a long, short, or no trade is open.
## 5. Alerts
- **Buy Signal Alert**: Triggered when `buy_signal` is true ("Cross Buy Signal").
- **Sell Signal Alert**: Triggered when `sell_signal` is true ("Cross Sell Signal").
- **Usage**: Users can set up TradingView alerts to receive notifications for trade signals.

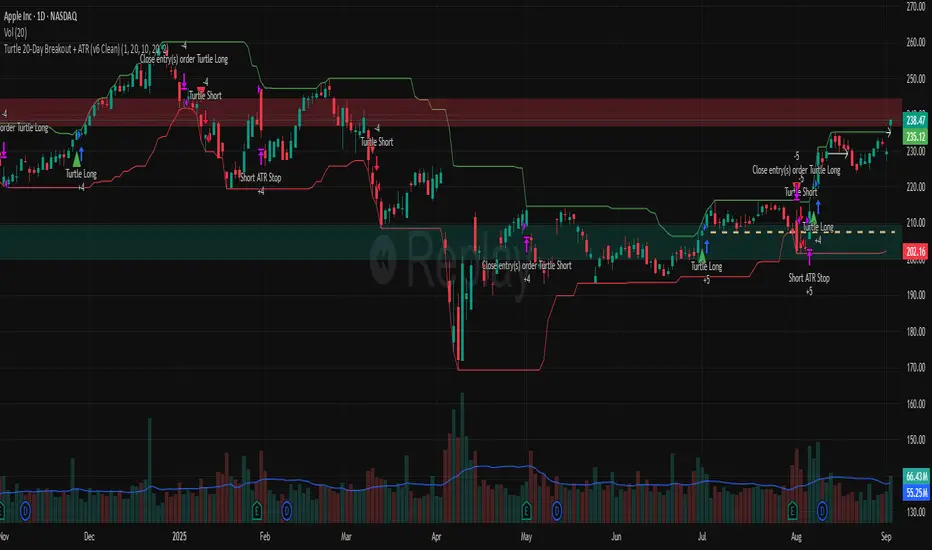
Turtle 20-Day Breakout + ATR (v6 Clean)20-bar breakout entries
ATR protective stops
Classic 10-bar opposite breakout exits
Proper plotting of breakout levels and stops
Signals on chart
Alert conditions in global scop
dabilThe strategy is probably to go short or long with the trend depending on the case, but if all time units 1 minute then 3 minutes then 5 minutes then 15 minutes then 1 hour all show the same direction, but first the 1 hour must be bullish in which the 1 hour candle closes above the previous one, for example if the trend is bearish then the market wants to change direction, then a 1 hour bullish close must then be followed by a 1 hour bearish close below the bullish candle, then another bullish candle must shoot above the previous bullish candle, then 15 minutes also shoot above the previous 15 bullish candles, then 1 and 2...3.5. Then I can rise with the market by only covering the last 15 bullish candles with my stop loss, if my SL is 50 pips then I want 100 pips and then I'm out.

Trend River Pullback (Avramis-style) v1//@version=5
strategy("Trend River Pullback (Avramis-style) v1",
overlay=true, initial_capital=10000, commission_type=strategy.commission.percent, commission_value=0.02,
pyramiding=0, calc_on_order_fills=true, calc_on_every_tick=true, margin_long=1, margin_short=1)
// ===== Inputs
// EMA "река"
emaFastLen = input.int(8, "EMA1 (быстрая)")
ema2Len = input.int(13, "EMA2")
emaMidLen = input.int(21, "EMA3 (средняя)")
ema4Len = input.int(34, "EMA4")
emaSlowLen = input.int(55, "EMA5 (медленная)")
// Откат и импульс
rsiLen = input.int(14, "RSI длина")
rsiOB = input.int(60, "RSI порог тренда (лонг)")
rsiOS = input.int(40, "RSI порог тренда (шорт)")
pullbackPct = input.float(40.0, "Глубина отката в % ширины реки", minval=0, maxval=100)
// Риск-менеджмент
riskPct = input.float(1.0, "Риск на сделку, % от капитала", step=0.1, minval=0.1)
atrLen = input.int(14, "ATR длина (стоп/трейлинг)")
atrMultSL = input.float(2.0, "ATR множитель для стопа", step=0.1)
tpRR = input.float(2.0, "Тейк-профит R-множитель", step=0.1)
// Трейлинг-стоп
useTrail = input.bool(true, "Включить трейлинг-стоп (Chandelier)")
trailMult = input.float(3.0, "ATR множитель трейлинга", step=0.1)
// Торговые часы (по времени биржи TradingView символа)
useSession = input.bool(false, "Ограничить торговые часы")
sessInput = input.session("0900-1800", "Сессия (локальная для биржи)")
// ===== Calculations
ema1 = ta.ema(close, emaFastLen)
ema2 = ta.ema(close, ema2Len)
ema3 = ta.ema(close, emaMidLen)
ema4 = ta.ema(close, ema4Len)
ema5 = ta.ema(close, emaSlowLen)
// "Река": верх/низ как конверт по средним
riverTop = math.max(math.max(ema1, ema2), math.max(ema3, math.max(ema4, ema5)))
riverBot = math.min(math.min(ema1, ema2), math.min(ema3, math.min(ema4, ema5)))
riverMid = (riverTop + riverBot) / 2.0
riverWidth = riverTop - riverBot
// Трендовые условия: выстроенность EMAs
bullAligned = ema1 > ema2 and ema2 > ema3 and ema3 > ema4 and ema4 > ema5
bearAligned = ema1 < ema2 and ema2 < ema3 and ema3 < ema4 and ema4 < ema5
// Импульс
rsi = ta.rsi(close, rsiLen)
// Откат внутрь "реки"
pullbackLevelBull = riverTop - riverWidth * (pullbackPct/100.0) // чем больше %, тем глубже внутрь
pullbackLevelBear = riverBot + riverWidth * (pullbackPct/100.0)
pullbackOkBull = bullAligned and rsi >= rsiOB and low <= pullbackLevelBull
pullbackOkBear = bearAligned and rsi <= rsiOS and high >= pullbackLevelBear
// Триггер входа: возврат в импульс (пересечение быстрой EMA)
longTrig = pullbackOkBull and ta.crossover(close, ema1)
shortTrig = pullbackOkBear and ta.crossunder(close, ema1)
// Сессия
inSession = useSession ? time(timeframe.period, sessInput) : true
// ATR для стопов
atr = ta.atr(atrLen)
// ===== Position sizing по риску
// Расчет размера позиции: риск% от капитала / (стоп в деньгах)
capital = strategy.equity
riskMoney = capital * (riskPct/100.0)
// Предварительные уровни стопов
longSL = close - atrMultSL * atr
shortSL = close + atrMultSL * atr
// Цена тика и размер — приблизительно через syminfo.pointvalue (может отличаться на разных рынках)
tickValue = syminfo.pointvalue
// Избежать деления на 0
slDistLong = math.max(close - longSL, syminfo.mintick)
slDistShort = math.max(shortSL - close, syminfo.mintick)
// Кол-во контрактов/лотов
qtyLong = riskMoney / (slDistLong * tickValue)
qtyShort = riskMoney / (slDistShort * tickValue)
// Ограничение: не меньше 0
qtyLong := math.max(qtyLong, 0)
qtyShort := math.max(qtyShort, 0)
// ===== Entries
if inSession and longTrig and strategy.position_size <= 0
strategy.entry("Long", strategy.long, qty=qtyLong)
if inSession and shortTrig and strategy.position_size >= 0
strategy.entry("Short", strategy.short, qty=qtyShort)
// ===== Exits: фиксированный TP по R и стоп
// Храним цену входа
var float entryPrice = na
if strategy.position_size != 0 and na(entryPrice)
entryPrice := strategy.position_avg_price
if strategy.position_size == 0
entryPrice := na
// Цели
longTP = na(entryPrice) ? na : entryPrice + tpRR * (entryPrice - longSL)
shortTP = na(entryPrice) ? na : entryPrice - tpRR * (shortSL - entryPrice)
// Трейлинг: Chandelier
trailLong = close - trailMult * atr
trailShort = close + trailMult * atr
// Итоговые уровни выхода
useTrailLong = useTrail and strategy.position_size > 0
useTrailShort = useTrail and strategy.position_size < 0
// Для лонга
if strategy.position_size > 0
stopL = math.max(longSL, na) // базовый стоп
tStop = useTrailLong ? trailLong : longSL
// Выход по стопу/трейлу и ТП
strategy.exit("L-Exit", from_entry="Long", stop=tStop, limit=longTP)
// Для шорта
if strategy.position_size < 0
stopS = math.min(shortSL, na)
tStopS = useTrailShort ? trailShort : shortSL
strategy.exit("S-Exit", from_entry="Short", stop=tStopS, limit=shortTP)
// ===== Visuals
plot(ema1, "EMA1", display=display.all, linewidth=1)
plot(ema2, "EMA2", display=display.all, linewidth=1)
plot(ema3, "EMA3", display=display.all, linewidth=2)
plot(ema4, "EMA4", display=display.all, linewidth=1)
plot(ema5, "EMA5", display=display.all, linewidth=1)
plot(riverTop, "River Top", style=plot.style_linebr, linewidth=1)
plot(riverBot, "River Bot", style=plot.style_linebr, linewidth=1)
fill(plot1=plot(riverTop, display=display.none), plot2=plot(riverBot, display=display.none), title="River Fill", transp=80)
plot(longTP, "Long TP", style=plot.style_linebr)
plot(shortTP, "Short TP", style=plot.style_linebr)
plot(useTrailLong ? trailLong : na, "Trail Long", style=plot.style_linebr)
plot(useTrailShort ? trailShort : na, "Trail Short", style=plot.style_linebr)
// Маркеры сигналов
plotshape(longTrig, title="Long Trigger", style=shape.triangleup, location=location.belowbar, size=size.tiny, text="L")
plotshape(shortTrig, title="Short Trigger", style=shape.triangledown, location=location.abovebar, size=size.tiny, text="S")
// ===== Alerts
alertcondition(longTrig, title="Long Signal", message="Long signal: trend aligned + pullback + momentum")
alertcondition(shortTrig, title="Short Signal", message="Short signal: trend aligned + pullback + momentum")

Mikey’s Strategy (AutoEMA+)
⚙️ Core Idea:
A long-only EMA crossover strategy that automatically selects the optimal EMA length (5–25) based on historical performance using a custom scoring system.
🎯 Entry Conditions:
Price crosses above the selected EMA.
(Optional) Price is above HTF EMA200 (higher timeframe trend).
(Optional) ADX is above a minimum threshold.
(Optional) Volume is above average × multiplier.
A cooldown period has passed since the last exit.
❌ Exit Condition:
Price closes fully below the EMA (current candle: high, low, and close all below),
and the previous candle was above or touched the EMA.
🧠 Auto EMA Selection Logic:
Scans EMAs in the range (e.g., 8–21) every N bars.
Scores each EMA based on:
Time price spent above the EMA
Respect for EMA (touches)
Trend consistency
Distance from EMA (when above)
Picks the EMA with the highest valid score, and updates only if it’s significantly better.
🛡️ Risk Management:
No pyramiding (1 position max).
Cooldown period after exit.
No hard stop loss or take profit.
📊 Visuals & Alerts:
Plots the selected EMA and optional HTF EMA200.
Entry markers and info label on the chart.
Alerts for valid entries and filtered signals.

Adaptive Confluence StrategyAdaptive Confluence Strategy brings institutional discipline to retail charts — blending adaptive EMA crossovers, RSI, VWAP, and higher-timeframe filters with ATR-driven risk management and smart position sizing to help traders capture trends with confidence.
Adaptive EMA Crossovers – auto-adjusted for intraday, daily, or weekly charts.
Multi-Factor Confluence – optional RSI filter, VWAP alignment (intraday), and higher timeframe EMA trend confirmation.
ATR-Based Risk Management – stop loss, take profit, and optional Chandelier trailing stop.
Position Sizing Guidance – suggested trade size and risk/reward metrics displayed on chart.
Flexible Use – suitable for both short-term day trading and longer-term swing setups.
Back test & Refine – built-in strategy logic for historical testing and optimization.
Overview:
A multi-factor trend-following strategy designed for both intraday
and swing trading. The system combines EMA crossovers with optional
RSI filters, VWAP confluence (intraday), and higher timeframe trend
confirmation. Risk management is enforced through ATR-based stop
loss / take profit and an optional ATR Chandelier trailing stop.
Position sizing guidance is included to assist with consistent
risk-per-trade allocation.
// Disclaimer:
// This script is for educational and research purposes only.
// Past performance in backtests does not guarantee future results.
// Use at your own risk.

FirstStrike Long 200 [KedArc Quant]Overview Strategy takes at most one LONG trade per day using a trend filter (EMA-200), a fast EMA confirmation, and a softened RSI trigger. Exits are managed with an ATR stop and an R-multiple take profit.
Entry Logic
Trend: Close > EMA-200 and Close > EMA-fast.
Trigger (selectable): Cross only; Cross+Grace; Cross+Grace+Sustain; or Any bar >= RSI trigger (default).
Optional hour window.
One trade per calendar day.
Exit Logic = ATR * multiplier below entry; Target = R-multiple above entry.
Key Inputs Length
Trigger level; Trigger mode; Grace window; Sustain bars; EMA lengths; ATR length; ATR multiplier; R multiple.

BB scalping1. Overview
The BB Scalping Strategy is a systematic trading approach designed for TradingView, implemented in Pine Script™ v5. It combines Bollinger Bands®, a fast-moving average, and the Awesome Oscillator to identify short-term (scalping) entry and exit opportunities in trending markets. The strategy includes configurable backtesting periods, trading time windows, and integrated risk management via stop-loss orders.
2. Core Trading Logic
The strategy generates signals based on the confluence of three technical indicators:
Bollinger Bands (BB): The core indicator. A crossover of a fast EMA above or below the BB middle line (basis) serves as the primary entry trigger.
Awesome Oscillator (AO): Used as a momentum filter. A buy signal requires bullish momentum (AO rising and above its midline), while a sell signal requires bearish momentum (AO falling and below its midline).
Fast Exponential Moving Average (EMA): A short-period EMA (default: 3) that quickly reacts to price changes, providing timely crossover signals with the BB basis.
3. Key Features
Dual Entry Signals:
Long Entry: Triggered when the Fast EMA crosses above the BB basis, price is above the basis, and the Awesome Oscillator confirms bullish momentum.
Short Entry: Triggered when the Fast EMA crosses below the BB basis, price is below the basis, and the Awesome Oscillator confirms bearish momentum.
Advanced Filtering Options:
BB Filter: When enabled, long entries are only valid if the price is below the BB upper band, and short entries are only valid if the price is above the BB lower band.
Squeeze Filter: When enabled, entries are only permitted during a "squeeze" (low volatility period), identified when the BB width is below a user-defined threshold percentage of its historical average.
Precise Backtesting Control:
Date Range Filter: Allows users to define a specific start and end date for historical backtesting.
Trading Time Window: Restricts trading activity to specific hours of the day (in 24h format), allowing simulation of a specific session (e.g., a market open session).
Integrated Risk Management:
Stop-Loss Orders: A fixed percentage-based stop-loss is automatically calculated and set for every trade upon entry (e.g., 1%). This is a critical feature for managing risk in a scalping strategy.
4. Chart Visualization
The script provides clear visual cues on the chart:
Plots the Bollinger Bands and the Fast EMA.
Colors the BB channel to indicate a "squeeze" (blue) or high-volatility (white) state.
Displays up/down arrow markers directly on the chart at the exact point where buy and sell signals are generated.
5. Usage Notes
Optimal Environment: This strategy is designed for trending markets and may generate false signals during sideways or choppy conditions, especially if the squeeze filter is disabled.
Parameter Tuning: Users are encouraged to optimize parameters (like BB length, multiplier, EMA length, and stop-loss percentage) for different instruments and timeframes.
Backtesting: Always conduct thorough backtesting over a significant period of data and different market conditions before deploying any strategy with real capital.
Disclaimer: This strategy is provided for educational and research purposes only. Past performance is not indicative of future results. Trading financial instruments carries a high level of risk and may not be suitable for all investors. 1. 策略概述
BB剥头皮策略是一款基于TradingView平台、使用Pine Script™ v5语言编写的自动化交易策略。该策略综合运用了布林带 (Bollinger Bands®)、快速指数移动平均线 (EMA) 和动量震荡指标 (Awesome Oscillator) 来捕捉市场短期的趋势性机会,旨在通过频繁的小额盈利(剥头皮)实现收益。策略内置了可定制的回测时间范围、交易时间窗口以及基于百分比的止损来管理风险。
2. 核心交易逻辑
策略的信号生成依赖于三个技术指标的共振:
布林带 (BB): 核心指标。当快速EMA上穿或下穿布林带中线(基准线)时,构成主要入场触发条件。
动量震荡指标 (AO): 用作动量过滤器。买入信号需要看涨动量(AO为正且在上升),卖出信号需要看跌动量(AO为负且在下降)。
快速指数移动平均线 (EMA): 一条短周期EMA(默认3),对价格变化反应灵敏,提供与布林带中线的及时交叉信号。
3. 策略功能特点
多空双向信号:
多头入场(买入): 当快速EMA上穿布林带中线、价格位于中线上方,且AO指标确认看涨动量时触发。
空头入场(卖出): 当快速EMA下穿布林带中线、价格位于中线下方,且AO指标确认看跌动量时触发。
高级过滤选项:
布林带过滤: 启用后,多头信号需价格低于布林带上轨,空头信号需价格高于布林带下轨,以提高信号质量。
收窄过滤 (Squeeze Filter): 启用后,仅在布林带“收窄”(低波动期)时才允许交易,此时布林带宽度低于其历史平均宽度的一定阈值(百分比),预示着潜在的趋势突破机会。
灵活的回测设置:
日期范围控制: 用户可以精确设置策略回测的起止年月日,用于检验特定历史时期的表现。
交易时间窗口: 可将交易活动限制在每天的特定时段(24小时制),例如只在北京时间上午或某个特定市场开盘时段进行交易,模拟实盘操作习惯。
严格的风险管理:
百分比止损: 每次入场后,策略会根据用户设定的百分比(例如1%)自动计算并设置止损单,这是控制剥头皮交易风险的关键功能。
4. 图表可视化
策略在图表上提供了清晰的视觉信号:
绘制布林带和快速EMA线。
根据布林带是否收窄,对通道进行不同颜色的填充(蓝色表示收窄,白色表示扩张)。
在生成买入和卖出信号的位置直接显示向上箭头和向下箭头标记,直观清晰。
5. 使用说明与风险提示
适用环境: 本策略在趋势性市场中表现更佳,在横盘震荡市中可能会产生连续假信号,尤其是在关闭收窄过滤功能时。
参数优化: 建议用户根据不同的交易品种和时间框架(如5分钟、15分钟图)对策略参数(如布林带周期、乘数、EMA长度、止损百分比)进行测试和优化。
风险警告: 该策略仅用于教育和研究目的。所有回测结果均代表历史表现,并不保证未来收益。金融市场交易存在高风险,可能导致本金损失,未必适合所有投资者。请在完全了解风险后,再谨慎使用。

RMI trend changeThe "RMI Trend Swing" is an automated trend-following and swing trading strategy built on a composite indicator of RMI (Relative Momentum Index) and MFI (Money Flow Index), supplemented by ADX (Average Directional Index) trend strength filtering and time-based session filtering. The strategy is designed to identify the inception points of medium-term trends and enter positions when momentum is strong, aiming to capture significant swing moves. It provides intuitive visual feedback through a dynamic band on the chart.
Core Logic & Components
Core Indicator Calculation:
RMI-MFI Composite Value: The primary signal generator. It averages a variant of the standard RSI (RMI) and the MFI, combining price change and volume factors to provide a more holistic view of market momentum.
Range-Weighted Moving Average (RWMA): A moving average weighted by each bar's range. Bars with higher volatility (larger ranges) have a greater impact, making the RWMA more responsive to market consensus and significant price movements.
Volatility Band (Band): Dynamically calculated based on the ATR (Average True Range), forming upper and lower channels around the RWMA to act as dynamic support and resistance levels.
Trade Signal Generation:
Long Signal (Buy): Generated when the RMI-MFI composite value crosses above the user-defined "Positive above" threshold (default: 66) from below, concurrently with a rising short-term EMA(5), and only if the ADX indicator confirms strong trend strength (above its threshold, default: 25).
Short Signal (Sell): Generated when the RMI-MFI composite value falls below the user-defined "Negative below" threshold (default: 30), accompanied by a falling short-term EMA(5), and confirmed by a strong ADX reading.
Multi-Layer Filtration:
ADX Trend Filter: Signals are only executed if the ADX value is above the set level, ensuring the strategy only trades in trending markets and avoids whipsaws during choppy, low-trend consolidation periods.
Trading Session Filter: Users can define a specific daily trading window (default: 09:30 - 16:00). Entry orders are only placed during this active session, helping to avoid the low liquidity and atypical volatility often seen in pre-market and post-market hours.
Auto-Close Mechanism: The strategy includes a scheduled close function (default: between 15:10-15:20) to exit all positions automatically before the market close, effectively managing overnight risk for day-trading scenarios.
Visual Output:
The strategy plots a distinct colored band on the chart for at-a-glance market assessment.
Green Band/Candles: Indicates a bullish trend phase. The RWMA line and the band below it are colored green, and all price candles also turn green.
Red Band/Candles: Indicates a bearish trend phase. The RWMA line and the band above it are colored red, and all price candles turn red.
Buy/Sell Labels: Small labels are plotted on the chart at the exact bar where a new entry signal is generated, providing clear markers for trade triggers.
Key Advantages
Multi-Factor Confirmation: Combines momentum, volume-weighted averages, and trend strength for higher-quality signals.
Integrated Risk Management: Employs ADX and time filters to avoid poor trading environments and includes a mandatory daily close.
Intuitive Visualization: The colored bands and candles provide an immediate and clear representation of the prevailing market regime.
Ideal Instruments & Market Conditions
This strategy is best suited for trend-prone instruments (such as equity indices, major cryptocurrencies, and forex majors) on intraday timeframes for swing trading. It performs optimally in markets with clear, sustained directional movement and will typically generate fewer trades during sideways, ranging conditions. 策略概述
“RMI趋势波段”是一个基于RMI(Relative Momentum Index,相对动量指数)与MFI(资金流量指数)复合指标,并辅以ADX(平均方向指数)趋势强度过滤和交易时间过滤的自动化趋势跟踪与波段交易策略。该策略旨在识别中期趋势的起始点,并在趋势强劲时入场,以期捕捉主要波段行情,同时通过可视化带状区域直观展示市场动态。
核心逻辑与组成部分
核心指标计算:
RMI-MFI 复合值: 策略的核心信号源。它计算了标准RSI的变体(RMI)和MFI的平均值,结合了价格变动和交易量因素,能更综合地反映市场的动量。
范围移动平均线 (RWMA): 一种根据K线波动幅度加权的移动平均线。波动大的K线权重更高,能更灵敏地反映市场价格的共识。
波动带 (Band): 基于ATR(平均真实波幅)动态计算得出,围绕RWMA形成上轨和下轨,构成一个动态支撑阻力通道。
交易信号生成:
多头信号 (买入): 当RMI-MFI复合值从下方突破预设的“Positive above”阈值(默认66),同时短期EMA(5)上扬,且ADX指标显示趋势强劲(高于阈值,默认25)时,产生买入信号。
空头信号 (卖出): 当RMI-MFI复合值跌破预设的“Negative below”阈值(默认30),同时短期EMA(5)下跌,且ADX指标显示趋势强劲时,产生卖出信号。
多重过滤条件:
ADX趋势过滤: 只有当ADX值高于设定的水平时,才会接受RMI产生的交易信号,确保只在趋势明确的市场环境中交易,避免在震荡市中频繁假信号。
交易时间过滤: 用户可自定义每日的交易时间段(默认:09:30 - 16:00),策略只在该时间窗口内才会开仓,帮助规避盘前盘后流动性低或波动异常的时间段。
自动平仓: 策略内置定时平仓功能(默认在15:10-15:20之间),每日收盘前自动了结所有头寸,避免隔夜风险。
可视化效果:
策略在图表上绘制了精美的彩色带状区域。
绿色区域/蜡烛图: 表示当前为多头趋势,RWMA线及下方的带状区域会显示为绿色,同时所有K线也会变为绿色。
红色区域/蜡烛图: 表示当前为空头趋势,RWMA线及上方的带状区域会显示为红色,同时所有K线也会变为红色。
在信号触发点,还会在图表相应位置生成买入或卖出的标签标记。
策略优势
多维度确认: 结合动量、成交量加权均线和趋势强度,信号质量较高。
风险控制: 通过ADX和时间过滤器有效过滤不良信号,并强制日内平仓。
直观清晰: 通过颜色和带状区域的变化,市场状态一目了然。
适用品种与场景
该策略主要适用于趋势性较强的标的(如股票指数、主流加密货币、外汇主要货币对等)的日中波段交易。在趋势明朗的行情中表现最佳,在横盘整理期间可能会减少交易频率。

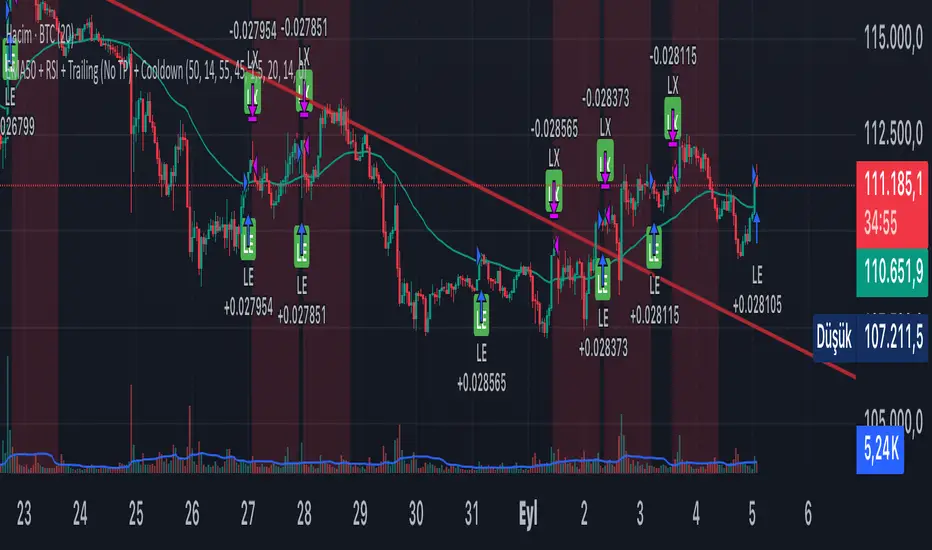
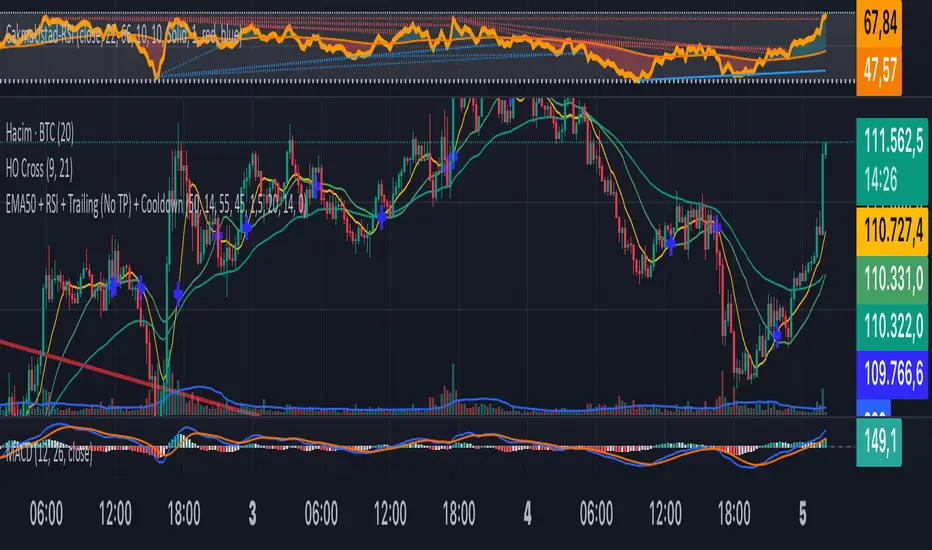
hh ema 2 (No TP)hi, my first strategy. Only btc. it will be idea for btc. and it can use for bot system.


MTF FVG Confluence v6 — JSON Alerts via alert()This strategy combines multi-timeframe confluence with candlestick analysis and fair value gaps (FVGs) to generate structured long/short entries. It aligns Daily and 4H EMA trends with 1H MACD momentum, then confirms with engulfing candles and FVG zones for precision entries. Risk management is built-in, featuring stop-loss, 3R take-profit targets, and optional break-even logic, with dynamic JSON alerts for webhook automation.
Categories:
Candlestick analysis
Chart patterns
Cycles

AlphaFlow — Direcional Pro [Strategy] — Risk % & Dynamic EquityAlphaFlow is a directional strategy designed to capture trend shifts using a dual moving average system, enhanced with RSI and ATR regime filters, and a long-term EMA filter for confirmation.
Key Features
Dynamic Position Sizing: Risk per trade is based on a fixed % of account equity, with optional dynamic equity growth.
Stop-Loss Options: Choose between ATR-based stop or swing-point stop.
Trade Management:
TP1 is placed at a user-defined risk multiple (R).
Once TP1 is hit, an optional ATR trailing stop activates until TP2 is reached or the stop is triggered.
Visual Tools: Fast/slow EMAs, long EMA, ATR channels, and optional divergence markers for context (do not affect entries).
Backtest Ready: Includes configurable commission, capital, and position sizing.
Use Case
This strategy is built for traders who want systematic trend-following entries with structured risk management. Its modular inputs allow adaptation across assets and timeframes.
⚠️ Disclaimer: Past performance does not guarantee future results. Always validate parameters before live use.

Michalke Strategy Concept BThis is the second concept of my strategy. It can generate 10% on the NQ 3 min chart in one year, which is still unimpressive

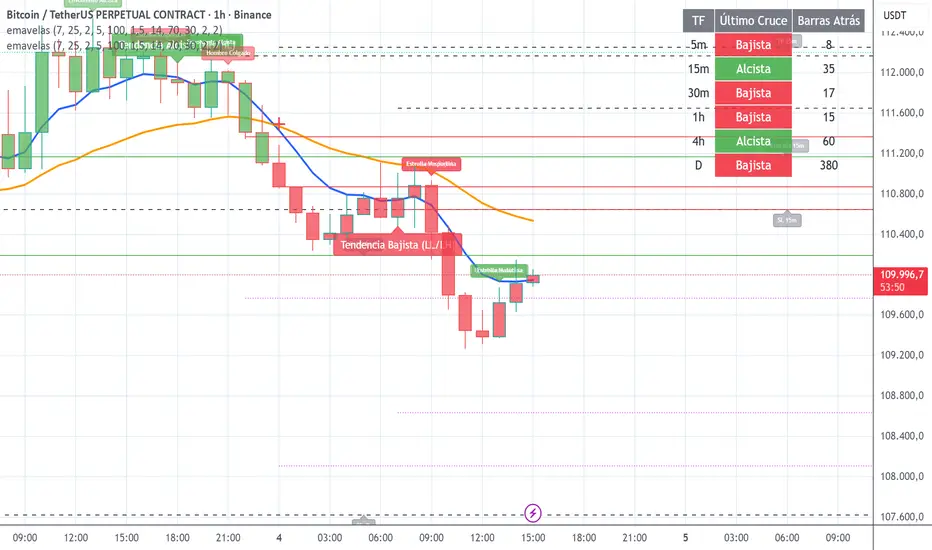
emavelas StrategyThe "emavelas Strategy" is a TradingView Pine Script (v6) for trend-following trading, combining EMA crossovers (7 and 25 periods) with candlestick patterns, market structure (HH/HL, BOS/CHOCH), volume/RSI filters, and multi-timeframe alignment (5m to Daily). It generates confirmed buy/sell signals, visualizes trends with lines/labels/tables, and includes backtesting with risk management (RR 2:1, dynamic SL/TP based on swings). Ideal for stocks, forex, or crypto on lower timeframes. Customizable via inputs; test in Strategy Tester. Note: Trading involves risks; not financial advice.
VXN (NQ100) Implied Move — Bands StrategyVXN (NQ100) Implied Move — Bands Strategy
📌 Overview
This strategy uses the 30-day implied volatility from VXN (CBOE:VXN) to build an “implied move” envelope around a EMA computed in the indicator timeframe. The bands act like elastic zones where price stretches and often reverts. Signals trigger when the close re-enters the zone, and exits are managed via opposite band targets, band retests, and/or optional ATR thresholds. All logic confirms on bar close.
⚙️ Key Inputs
- Indicator Timeframe (tfInput): timeframe used to sample both the symbol EMA and VXN.
- EMA Length (emaLen): center line for the bands.
- Multiplier (mult): scales the implied move.
- Days (daysLook): horizon in days for square-root-of-time scaling.
- Trade Direction: Both / Longs only / Shorts only.
- Band TP / Band SL: enable take-profit or stop at bar close when price hits bands.
- ATR Stop (SL) & ATR Take Profit (TP): optional ATR-based exits.
- Bar Limit (Time Stop): closes a trade after N bars in market.
- Prevent PDT: caps day trades within a rolling window.
🧠 Band Construction (core)
Compute EMA of price in the Indicator Timeframe.
Fetch VXN (close) in the same timeframe.
Implied Move (IM) = EMA * (VXN/100) * sqrt(Days/365) * Multiplier.
Bands:
Upper = EMA + IM
Lower = EMA - IM
🚀 Entry Rules (all on bar close)
Long: first, the close moves below the lower band (arming). Later, when the close crosses above that band, go long.
Short: mirror logic. First, the close moves above the upper band (arming), then the close crosses below that band, go short.
🎯 Exit Logic (first event wins, on bar close)
Band Take-Profit: target at the opposite band.
Band Stop-Loss: if the close returns to the entry band (lower for longs, upper for shorts).
ATR Optional:
ATR SL: distance from entry price via multiplier.
ATR TP: profit target based on ATR.
Time Stop (Bar Limit): forces an exit after a maximum number of bars.
🛡️ Risk Management & Filters
Trade Direction: restrict sides (long-only, short-only, or both).
Prevent PDT: counts day trades per calendar day and limits them in a rolling window.
ATR Stops/TP: useful under higher volatility to control exposure.
🔔 Alerts
Includes alerts for entries and exits (bands and ATR). Set them to Once per bar close to align with the close-based logic.
📎 Important Notes
EMA and VXN are both computed in the Indicator Timeframe.
Signals confirm on bar close only; intrabar confirmation is not used.
VXN is essentially daily. If you pick an intraday Indicator Timeframe, TradingView will replicate the last daily value until the next update; the EMA and IM are still computed consistently in that timeframe.
Not financial advice. Backtest and adjust before live use.
🧩 Tips
- Tune Days and Multiplier to match your trading horizon and sensitivity.
- Combine Band TP/SL with ATR SL/TP for hybrid exit management.
- For intraday trading, consider a Bar Limit to avoid over-holding.

My Backtest Module### 📊 Universal Backtest Module - Pro Structure
**A Fully Customizable Strategy Framework for Advanced Backtesting & Signal Analysis**
This powerful Pine Script strategy is designed as a **universal testing module** for traders and developers who want to evaluate custom trading logic across multiple conditions, timeframes, and risk parameters — all within a single, flexible structure.
> ⚠️ **Note:** This script is intended for **educational and backtesting purposes only**. It does **not** provide financial advice, nor does it guarantee profits. Always test strategies thoroughly before applying them to live markets.
---
### 🔧 Key Features
✅ **Multi-Source Entry Signals**
Combine up to two independent buy/sell signals using flexible logic:
- **OR Logic**: Trigger on any signal (edge-based).
- **AND Logic (Latched)**: Requires both signals at any point (flip-flop style).
- **AND No Latch**: Both signals must be active simultaneously.
✅ **Dynamic Trade Direction Control**
Choose between:
- Long & Short (Both)
- Long Only
- Short Only
With optional **close-on-opposite-signal** and **wait-for-opposite-reentry** logic.
✅ **Precision Timing Filters**
- Date range filtering (start/end dates)
- Intraday session control (supports up to 3 custom sessions)
- Visual session shading for clarity
✅ **Advanced Risk Management**
- Multiple Stop Loss types:
- Fixed Points / Percent
- ATR-based (adjustable multiplier)
- Swing-based (automatically detects pivots)
- External SL source
- Dynamic position sizing:
- Fixed lot
- % of equity risk (with max fallback)
✅ **Smart Take Profit Options**
- Fixed Points, Percent, RR Ratio, ATR, Fibonacci extensions
- Support for **external TP levels** (user-defined sources)
- Optional **multiple partial exits** with customizable size distribution
- Fibonacci TP levels (1.0, 1.618, 2.618, 4.236) based on SL distance
✅ **Flexible Exit Tools**
- Breakeven stop activation after TP1 hit
- Internal swing-based trailing stop
- External trailing stop (custom source)
- Max holding time (auto-close after X candles)
- Custom close conditions via user-defined logic
- Close & reverse functionality
✅ **Visual Clarity & Feedback**
- Clear visual markers for Buy/Sell signals
- Real-time SL, Entry, and TP lines with color-coded risk/reward zones
- On-chart TP level labels showing prices and allocation percentages
- Session background highlighting
- Trade statistics summary label
---
### 🛠️ Ideal For:
- Testing new indicator combinations
- Validating entry/exit logic under various market filters
- Comparing signal fusion methods (OR vs AND)
- Simulating professional-grade risk management rules
- Educational demonstrations in algorithmic trading
---
### ⚠️ Important Notes
- This is a **backtesting tool**, not a live trading bot.
- Past performance is **not indicative of future results**.
- Strategy performance depends entirely on the quality of input signals.
- Always validate results across multiple assets and timeframes.
- Use in conjunction with sound money management principles.
---
### 📌 How to Use
1. Attach the script to your chart.
2. Configure **Buy/Sell Signal Sources** (e.g., RSI crossovers, moving averages, etc.)
3. Set your preferred **trade direction, session, and date filters**
4. Define **stop loss and take profit rules**
5. Adjust position sizing and exit behavior
6. Run the backtest and analyze results in the **Strategy Tester tab**
💡 *Tip: Combine with other indicators by referencing their output values as signal sources.*
---
### ❌ Disclaimer
This script is shared for **informational and educational purposes only**. By using it, you agree that:
- The author is **not responsible** for any financial losses.
- Trading involves significant risk; only risk capital should be used.
- You are solely responsible for your trading decisions.
🚫 **This script does not promote get-rich-quick schemes, guaranteed profits, or unverified performance claims.**
---
🔁 **Version:** 5 (Pine Script v5)
📦 **Category:** Strategy
📈 **Overlay:** Yes
🧪 **Purpose:** Backtesting, Signal Validation, Risk Modeling
---
✅ **Safe for Public Sharing**
✔ Complies with TradingView’s community standards
✔ No misleading performance claims
✔ No automated trading promises
✔ No copyrighted or plagiarized content
---
> 💬 *"Knowledge is power — test wisely, trade responsibly."*
---
Let me know if you'd like a **short version** for the script's header comment or a **public post summary** for the TradingView feed!

Amazin + Crack Super trend + Moving AveragesMoving averages with super trend mix . great way to catch some momentum buys .
