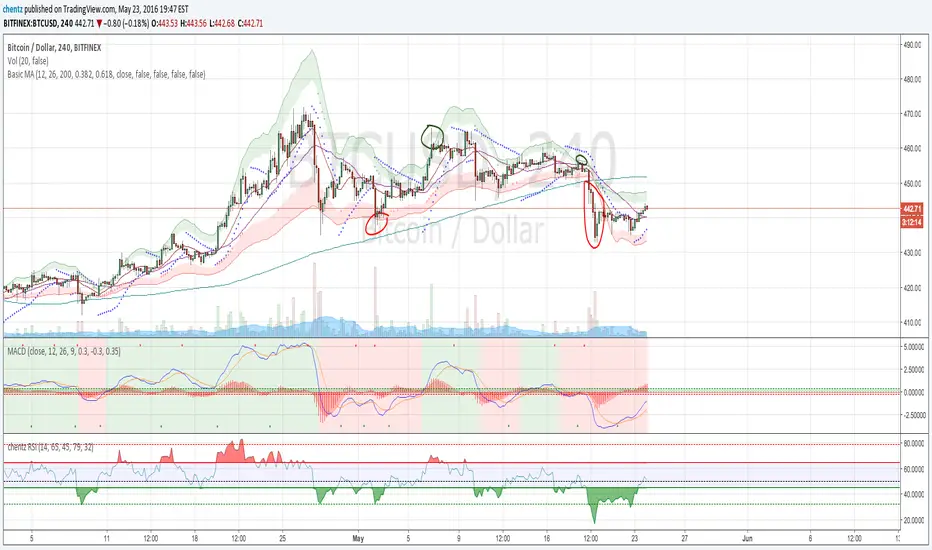
Basic MAAll-in-one basic indicators: - MA Fast (12) - MA Medium (26) - MA Slow (200) - Parabolic SAR www.investopedia.com - Dynamic Fibonnaci channel with 2 channels - www.forexstrategiesresources.comPine Script® indicatorby chentz95
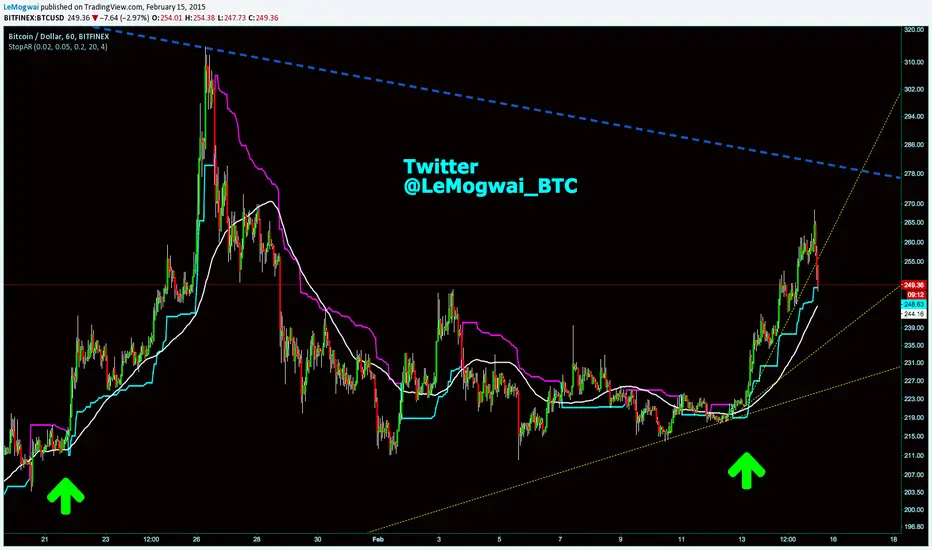
Parabolic StopParbolic Stop is a mix between the indicator Parabolic SAR, Volatility Stop and an SMA. The goal of this indicator is to place your stop loss in an optimized spot. You can also combine the indicator switch from different timeframes to get buy or sell signal.Pine Script® indicatorby LeMogwai77 1.9 K
CM_Parabolic SAREnhanced Parabolic Sar Simply Enhances Default Parabolic SAR by creating Two Color Options, One for UpTrend, Other for DownTrend Ability To Turn On/Off The Up Trending Parabolic SAR, And The Down Trending Parabolic SAR Great Indicator For Trailing Stops.Pine Script® indicatorby ChrisMoody3030 15.6 K