BTC EMA 5-9 Flip Strategy AutobotThis strategy is designed for fast and accurate trend-following trades on Bitcoin.
It uses a crossover between EMA 5 and EMA 9 to detect instant trend reversals and automatically flips between Long and Short positions.
How the strategy works
EMA 5 crossing above EMA 9 → Long
EMA 5 crossing below EMA 9 → Short
Automatically closes the opposite trade during a flip
Executes trades only on candle close
Prevents double entries with internal position-state logic
Fully compatible with automated trading via webhooks (Delta Exchange)
Why this strategy works
EMA 5–9 is extremely responsive for BTC’s volatility
Captures trend reversals early
Works best on 15-minute timeframe
Clean, simple logic without over-filtering reduces missed opportunities
Performs well in both uptrends and downtrends
Automation Ready
This strategy includes alert conditions and webhook-ready JSON for automated execution.
This is a fast-reacting BTC bot designed for intraday and swing crypto trend trading.
Pine utilities

Cognex Fibonacci Breakout StrategyTHE COMPLETE TRADE LOGIC (What We Want):
Step 1: Morning Session (9:30-10:30)
Track session high and low
Step 2: After 10:30 - Wait for Breakout
Bullish: Close above session high
Bearish: Close below session low
Step 3: Track Extreme After Breakout
Keep updating highest_after_breakout or lowest_after_breakout
This continuously updates as price makes new extremes
Step 4: Detect 28% Retracement (THE LOCK)
When price retraces to 28%, set last_extreme_for_retracement to the current extreme
This LOCKS the extreme for fibonacci calculations
fib_100 should use this locked value
Step 5: Place Limit Order EARLY (at 20% retracement)
When price retraces to 20%, place limit order at 28% entry
This is so the order is ready when price hits 28%
Step 6: Cancel & Recalculate if New Extreme
If price makes a NEW extreme AFTER the order is placed
Cancel the old order
Wait for new 20% retracement to place new order
Step 7: One Trade Per Day
Only ONE order placement attempt per day
Even if cancelled, don't try again

ICVRv.2.0 - Real Criollo Value IndexICVR – Real Criollo Value Index
The ICVR (Índice Criollo de Valor Real) is a symbolic synthetic currency built to estimate the real effective value of the Argentine peso.
It combines exchange-rate pressure, inflation drift, and monetary expansion into a single interpretable metric.
⸻
🔍 What does the ICVR measure?
The ICVR provides a daily estimate of the peso’s real purchasing power by blending:
• Dollar exchange rates (official/wholesale, MEP, CCL, blue/crypto)
• Estimated monthly inflation
• Monthly monetary issuance
Users can freely adjust the weighting of each component to model different macro scenarios.
⸻
🧠 How is it conceptually calculated?
Without revealing proprietary code, the index works through:
1. A composite dollar rate, created from multiple ARS/USD markets.
2. A weighted adjustment for inflation drift, applied proportionally over time.
3. A weighted adjustment for monetary issuance, representing dilution of currency supply.
4. A normalization step, which creates a stable synthetic unit so changes can be compared over time.
These elements are combined arithmetically to form a single real-value index.
⸻
📌 Main Features
ICVR Core Calculation
• Composite dollar index (official + wholesale + MEP + blue/crypto + CCL)
• Customizable inflation
• Customizable monetary issuance
• Weighting sliders for all components
Real-Value Conversion Tool
• Enter a historical salary or price in ARS
• Select the date
• Automatically adjust it to today in:
• ICVR equivalent (real value)
• USD equivalent (composite dollar)
Variation Measurements
• Daily change of the ICVR
• % variation of the selected ARS value since its start date
• % variation of the ICVR since that same date
Visual Tools
• Summary table with ICVR, BTC, gold and USD
• Asset values displayed in ICVR terms
• Optional smoothing (SMA / EMA)
• Optional baseline for clearer visual comparison
⸻
🧪 Use Cases
• Evaluate whether a salary kept up with inflation
• Convert a 2020/2021/2022 price into its current real value
• Compare BTC, gold or the dollar against a “real criollo currency”
• Estimate hidden devaluations
• Adjust contracts or services using a synthetic real-value index
⸻
⚙️ How to Use
1. Add the script in daily timeframe (1D) for best results.
2. Adjust inflation and monetary issuance inputs.
3. Modify the weighting to create different macro scenarios.
4. If needed, enter a historical salary/price to convert it into today’s real ICVR value.
Compatible with any symbol. No external data feed required.
⸻
⚠️ Disclaimer
This indicator is a synthetic analytical tool for educational and comparative purposes.
It does not replace official inflation indexes, monetary data, or legal exchange rates.

8-12 wk Consolidation → Upside Breakout [sijoittaja.fi]This Screener looks for stocks that are about to break out after 8-12 weeks of consolidation. The code was developed using GROK, and there are no guarantees that the code will work.

Sessions (NY • London • Asia)This tool highlights the London, New York, and Asia sessions on your chart. You can change the session times to whatever you want, making it easy to see which session the market is in.

Auto Trend & Scalping Pro Atilla SPECIALAUTO TREND & SCALPING PRO — ATILLA SPECIAL EDITION
Auto Trend & Scalping Pro is an advanced, multi-confirmation algorithm designed for fast scalping (1m–5m) and reliable trend-following (15m–4h).
This special edition is custom-optimized for Atilla, combining EMA structure, momentum indicators, and volatility filters to generate clean, high-accuracy trading conditions.
---
🔥 Core Features
• Multi-EMA Trend Engine (13/50/200)
Analyzes the structure of the trend and generates a 0–200 Trend Power Score:
0–50 → Weak
50–100 → Medium
100–170 → Strong
170–200 → Very Strong
• 4-Indicator Confirmation Voting
The system uses:
MACD (momentum shift)
RSI (zone pressure)
STC (smooth trend phase)
ATR (volatility strength)
Each indicator votes Bull / Bear.
Total votes produce a 0–100% confirmation power.
• Sideways Market Filter
Auto-detects consolidation using:
EMA distance %
ATR volatility %
RSI 45–55 neutral zone
When sideways → All signals are blocked to avoid fake entries.
• Auto “LONG READY / SHORT READY” States
Signals activate ONLY when:
Trend is strong
Indicators confirm the direction
Market is not sideways
This eliminates noise and prevents false entries.
---
🟩 Real-Time Dashboard (Top-Right Panel)
Displays:
Market Mode (LONG READY / SHORT READY / WAIT / SIDEWAYS STOP)
EMA Power
Confirmation Strength (%)
MACD / RSI / STC / VOL status
Trend strength & filter state
All updates in real time on every candle.
---
⚡️ Scalping Optimized
Perfect for:
1 minute
3 minute
5 minute Ultra fast trend reading & correction detection.
Also stable on:
15m
30m
1H–4H (trend-following mode)
Works on all crypto pairs including BTC, ETH, BNB, SOL, AVAX, ADA, and more.
---
📌 Extra Notes
No repaint
Safe entry logic
Filters fake breakouts
Professional-grade clarity

UltimateFlow by Kate V0.2Ultimate Flow Script: Tracks market structure breaks, buy/sell entries (CE/SE), and trends with a Zero Lag SMA. Highlights Bullish & Bearish Order Blocks (OB, BB, MM) with dynamic boxes and tiny labels. Zigzag swings visualize market structure for smart entries. Play with the various settings to suit your trading style. Alerts available for MSB changes and price in OB zones.
Disclaimer: This script is for educational and informational purposes only. It should be used in line with your own trading strategy, risk management, and discretion. Past performance is not indicative of future results.
This script is designed for price action, market structure, and order block analysis on TradingView. It includes:
Buy & Sell Signals (CE/SE) – Highlights potential entries based on market structure breaks and trend changes. Mini triangles or markers indicate possible reversals.
Zero Lag SMA (ZSMA) – Smooths price action for trend confirmation without delay. Helps identify trend direction and support/resistance areas.
Order Blocks (OBs) – Highlights key Bullish (Bu-OB) and Bearish (Be-OB) order blocks on the chart. Boxes dynamically extend as price evolves and include tiny labels (Bu-OB, Be-BB, MM, etc.) for clarity.
Zigzag Market Structure – Draws swing highs and lows to visualize market structure breaks (MSB).
How it works:
OB boxes extend automatically and change when price breaks them.
CE/SE markers help identify high-probability trade entries.
ZSMA confirms trend direction.
Alerts can be set for MSB changes or when price enters an OB zone.

Kalkulator Pozycji — Auto Pip Point kalkulator wyznacza pozycje na podstawie ryzyka podanego w procentach

Hours ScholarshipsThis script displays the real-time local time of the London, New York, and Tokyo trading sessions directly on the chart. It automatically calculates whether each market is currently open or closed and presents all information inside a dynamic table that adjusts to the user’s layout settings.
🔹 Technical Features
Real Local Time Calculation:
Uses timezone-specific timestamps to show accurate local time for each financial center, independent of the user's own timezone.
Session Status Detection:
London, New York, and Tokyo opening hours are calculated using actual market schedules, including Tokyo’s split session.
Dynamic Table Rendering:
The table rebuilds itself automatically on the final bar, adjusting to the user’s size and position preferences. Only the selected sessions are shown.
Smart Alert System:
Each market includes:
a user-defined target time (HH:MM)
an individual offset in minutes
The script computes a final adjusted alert time for each market (target time − offset), with full support for midnight rollover.
High-Timeframe Compatibility:
Local time is safely recalculated using security calls on 60-minute data when needed, ensuring stable behavior even on higher timeframes.
🔹 Why This Script Is Unique
Most session-time indicators only display opening hours or highlight sessions on the chart. This script goes further by combining:
Real-time local clock display for three markets
Per-session customizable alert times
Independent minute offsets for London, New York, and Tokyo
Automatic alert-time calculation with rollover handling
Dynamic UI construction and per-row visibility control
This combination of local time tracking, intelligent alert logic, and dynamic multi-session layout is not available in standard public indicators, which justifies the script as unique in both function and design.

B21V21This Pine Script is designed to provide both previous-day reference levels and real-time market data, making it suitable for live trading applications. It automatically retrieves all key historical levels—such as PDH, PDL, PDC, and PDO—for the currently selected strike as well as the corresponding opponent strike.
The script allows users to compare two instruments or strikes by selecting either a self-opponent view or any required strike for cross-analysis. Important intraday levels are displayed dynamically during live market conditions, enabling traders to make informed and timely decisions.

Sani Momentum Target System [wjdtks255]Sani Momentum Target System Explanation & Trading Method
The Sani Momentum Target System is a momentum-based trading indicator that helps traders identify trend changes and determine precise entry points, stop-loss levels, and multiple profit targets.
Key Features:
Smoothed Price Calculation: Utilizes a glide-like smoothing function to reduce noise in price data.
Moving Averages: Calculates fast and slow EMAs on the smoothed price; the difference creates an oscillator.
Signal Line: A simple moving average smooths the oscillator to generate a signal line.
Trend Signals:
Buy signal when oscillator crosses above the signal line.
Sell signal when oscillator crosses below the signal line.
Entry, Stop Loss, Target Levels:
Entry price is set at current close on signal.
Stop loss is set by multiplying ATR by 2 against trend direction.
Three take profit targets (T1, T2, T3) are set by user-defined multiples of ATR.
Visual Display: Includes colored horizontal lines and labels for entry, stop loss, and targets.
Bars are colored by trend direction, and triangular markers show buy/sell signals.
How To Use This Indicator:
Entry: Place trades in the direction of the signal (long on buy, short on sell).
Stop Loss: Use the ATR-based stop loss line to minimize downside risk.
Profit Taking: Scale out profits or exit trades at target levels T1, T2, and T3.
Trend Confirmation: Confirm with oscillator trend direction before entry to avoid false signals.
Parameter Adjustment: Modify smoothing lengths, ATR period, and target multipliers to fit your trading style and timeframe.
Final Notes:
This indicator streamlines momentum trading by providing clear price targets and risk levels visually.
Always backtest strategies and apply proper risk management.
Suitable across asset classes: stocks, forex, cryptocurrencies.
If you want detailed guidance or customization, feel free to ask!

RhAiA TradingView indicator that plots AI-generated LONG /SHORT signals on BTC/USDT charts, entering trades at signal timestamps with customizable take-profit (TP) and stop-loss (SL) levels, exit priority, and holding windows. Signals are blocked if a prior trade remains active, with color-coded lines and labels for entries, TP/SL hits, and window expirations.

Checklist (D1 / H4 / M15/30 BoS / VP / Fibo / S/R) This is a simple, visual checklist indicator that allows you to quickly assess how many of your strategy conditions are met, without affecting the chart itself. It is ideal for multi-timeframe strategies and point-by-point setup monitoring.

TTS Calculator Forex calculator - Input account size, risk size and stop loss size, to get your lot size.


VPG – MTF PrevClose Dashboard (Horizontal 6TF, Bottom Right, VPG – MTF PrevClose Dashboard is a lightweight, real-time visual indicator that displays the current price position across six key timeframes — Weekly (W), Daily (D), 4H, 1H, 30m, and 15m.
It compares the current market price to the previous candle close and shows whether the price is:
🟢 RALLY → higher than the previous close
🔵 BASE → roughly equal (sideways / consolidation)
🔴 DROP → lower than the previous close
Designed as a clean, horizontal dashboard fixed at the bottom-right corner of your chart, it provides instant multi-timeframe insight without cluttering your workspace.
⚙️ Key Features
🔹 Real-time monitoring of six key timeframes (W, D, 4H, 1H, 30m, 15m)
🔹 Clear and intuitive color scheme: Green = RALLY, Blue = BASE, Red = DROP
🔹 Fixed bottom-right placement for consistent visibility
🔹 Horizontal layout for compact, at-a-glance analysis
🔹 Adjustable tolerance to define how “equal” prices are classified as BASE
🔹 No alerts or labels — clean, fast, and resource-light
📊 Best For
Multi-timeframe traders who need quick directional context
Scalpers, intraday, and swing traders doing top-down analysis
Dashboard lovers who want a minimalist, data-driven overview
Confirming short-term price moves against higher-timeframe trends
💡 How to Use
Add VPG – MTF PrevClose Dashboard to any chart (Forex, Crypto, Stocks, Gold, Indices, etc.).
Adjust the tolerance parameter if you want a wider or stricter “BASE” range.
Watch the table in the bottom-right corner — it updates live with every price move.
🧠 About the Author
Nizar M — Developer of VPG indicators focused on clarity, momentum visualization, and fast market interpretation for real-time decision-making.

Luminous Glide Momentum Indicator [wjdtks255]This indicator, named "Customized SuperSmoother MA Oscillator," applies a smoothing filter to price data using a SuperSmoother technique to reduce noise and enhance signal clarity. It calculates two moving averages on the smoothed data—a fast and a slow—whose difference forms the oscillator line. A signal line is derived by smoothing the oscillator with another moving average. The histogram visualizes the divergence between the oscillator and signal lines, indicating momentum strength and direction.
How it works
SuperSmoother Filter: Reduces price noise to provide smoother and more reliable signals than raw data.
Fast and Slow Moving Averages: The fast MA reacts quicker to price changes, while the slow MA indicates longer trends.
Oscillator: The difference between the fast and slow MAs signals shifts in momentum.
Signal Line: A smoothed version of the oscillator used to generate crossovers.
Histogram: Displays the distance between the oscillator and signal line, with color changes indicating bullish or bearish momentum.
Trading Strategy
Buy Signal: When the oscillator crosses above the signal line, it suggests increasing upward momentum, signaling a potential buy opportunity.
Sell Signal: When the oscillator crosses below the signal line, it suggests increasing downward momentum, signaling a potential sell opportunity.
Histogram Size and Color: Larger green bars indicate stronger bullish momentum; larger red bars indicate stronger bearish momentum.
Usage Tips
Combine this oscillator with other indicators or price action analysis to confirm trading signals.
Adjust smoothing and moving average lengths according to your trading timeframe and the asset volatility.
Use proper risk management to filter out potential false signals common in oscillators.

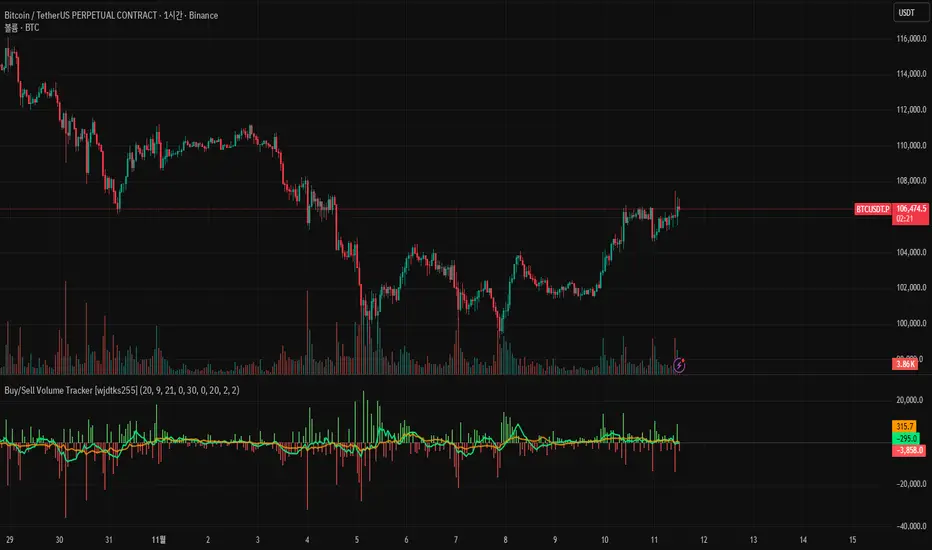
Buy/Sell Volume Tracker [wjdtks255]Indicator Description
Function: Separates buy and sell volume based on candle direction (close ≥ open) and displays the buy−sell difference (hist_val) as a histogram.
Visuals: Buy/sell bars are distinguished by user-selectable colors and opacity; two moving averages (MA1 and MA2) are shown to smooth the flow.
Meaning: A positive histogram indicates buy dominance; a negative histogram indicates sell dominance.
Limitation: The current separation is estimated from candle direction and may differ from execution-side (tick/trade-side) based data.
Trading Rules (Summary)
Conservative trend-following long
Entry: Enter long when hist_val turns above 0 and MA1 crosses MA2 from below.
Stop-loss: Exit if hist_val falls back below 0 or MA1 drops below MA2.
Take-profit: Use a risk:reward of 1:1.5 or set targets based on ATR.
Short-term rebound long
Entry: Enter a short-term long when a large negative histogram region begins to narrow and shows a recovery sign.
Stop-loss: Exit if hist_val drops below the previous low or bearish candles continue.
Take-profit: Prefer quick partial profit-taking.
Short (sell) strategy
Entry: Enter short when hist_val falls below 0 and MA1 crosses MA2 from above.
Stop-loss / Take-profit: Apply the inverse rules of the long strategy.
Filters and risk management
Volume filter: Only accept signals when volume exceeds a fraction of average volume to reduce noise.
Entry strength: Require |hist_val| to exceed a historical average threshold (e.g., avg(|hist_val|, N) × factor) to strengthen signals.
Position sizing: Size positions so that account risk per trade is within limits (e.g., 1–2% of account equity).
Timeframe: Use short timeframes for scalping and 1h+ for swing trading.
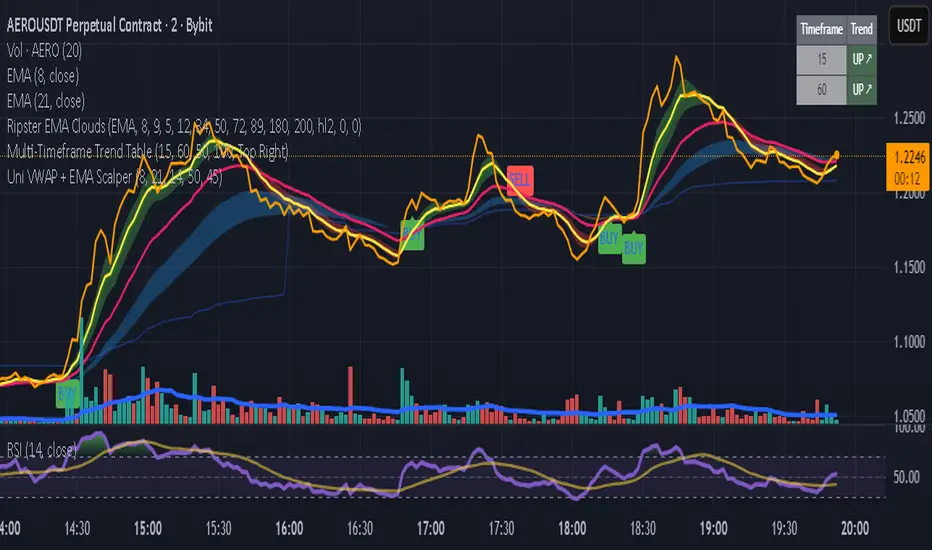
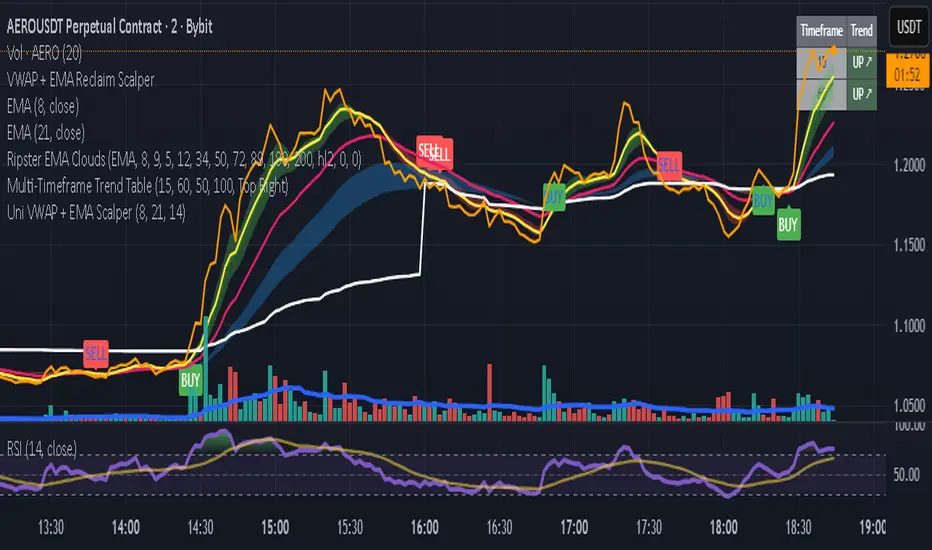
Uni VWAP + EMA ScalperWe learn more through the mistakes we make than the victories we enjoy. This is a work in progress to align visual and audible guidance for scalping and swing trades.
Customized Double Bollinger Bands [wjdtks255]This indicator combines two Bollinger Bands to visualize both short-term and extreme volatility zones on the same chart.
While a standard Bollinger Band shows how far price deviates from its mean,
this customized version displays two standard deviation ranges, allowing traders to distinguish between mild and extreme volatility conditions.
Band 1 (StdDev 0.5) captures short-term fluctuations near the price average,
while Band 2 (StdDev 3.0) highlights overbought or oversold conditions at market extremes.
When the distance between the two bands widens, volatility is increasing;
when it narrows, the market is stabilizing or preparing for a breakout.
ㆍPrice breaking above Band 2 → Potential overbought or strong bullish trend
ㆍPrice falling below Band 2 → Possible oversold or bearish continuation
ㆍBands tightening → Volatility compression, potential reversal zone
This indicator is designed primarily for volatility visualization rather than directional prediction.
For higher accuracy, use it alongside RSI, MACD, or trend-based indicators.
Developed by wjdtks255

Uni VWAP + EMA ScalperFor backtesting by small group. It's intended to synch and provide visual and audible alerts.
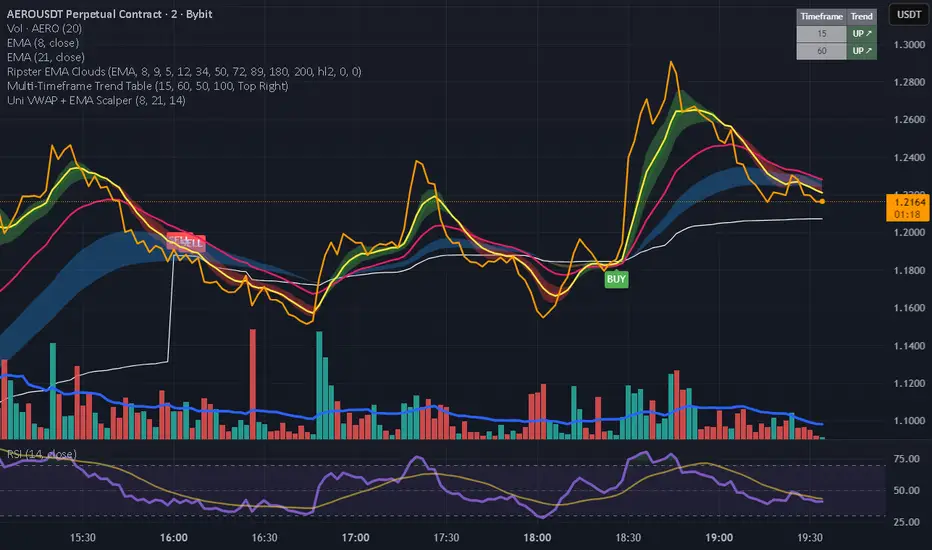
Uni VWAP + EMA ScalperSimple VWAP + EMA crossover test script for personal use and signal experiments.
Prototype tool combining VWAP and EMA crossovers for testing trade timing. Not optimized for live trading.
Daily ATR SL/TP Labels on ChartATR-Based Stop Loss & Take Profit Calculator
This script calculates 20% of the Average True Range (ATR) to determine optimal Stop Loss and Take Profit levels. Designed to assist traders in setting precise risk parameters when placing Buy/Sell orders based on daily market volatility.
Key Features:
Computes 20% of ATR value for proportional risk management
Provides dynamic SL/TP levels aligned to current market conditions
Optimised for Daily timeframe analysis to capture full trading day range
Recommended Usage:
Apply on Daily (1D) timeframe for most accurate results, as this captures the complete intraday price movement and provides reliable volatility measurements for position sizing and risk management decisions.
