Quantum Basic Radar PanelOverview
One of the biggest issues trading any market is in keeping track of trading opportunities as they arise across all the various timeframes without having multiple monitors or charts open and this is where the Radar Panel steps in. Using TradingView’s Table function, we have incorporated a host of our leading indicators on the panel which can be applied to any timeframe and from which you can instantly spot opportunities as they arise whether in terms of trend, reversals, volatility, or volume. In addition, when using a scanner such as this, it also highlights broad sentiment if, for example, you have added currency pairs from the same matrix or a group of stocks from the same sector. And you can of course have multiples open across the various timeframes.
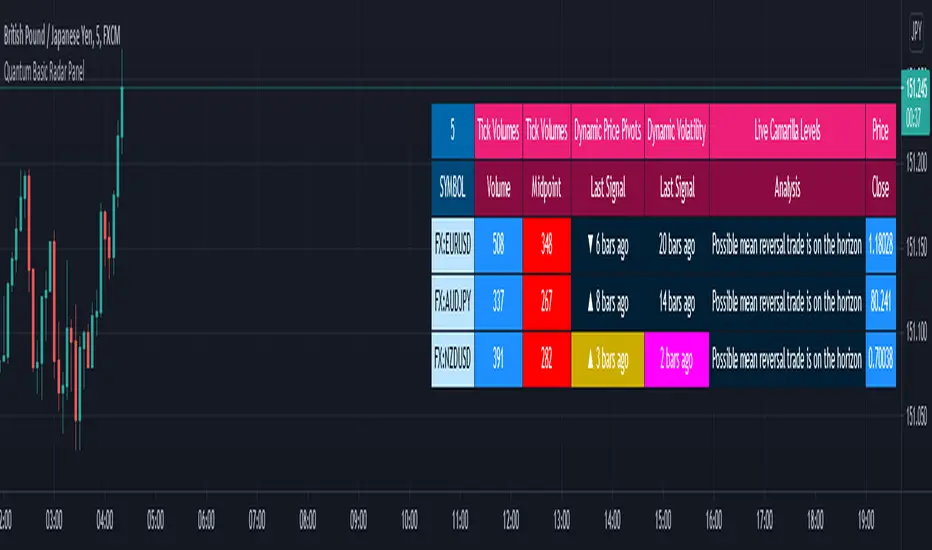
The Quantum Radar Panel is a powerful indicator that keeps track of indicator signals of up to 10 different symbols in real time. For each symbol, it can display the current signals of 4 Quantum Trading indicators namely:
Quantum Tick Volumes
Quantum Dynamic Price Pivots
Quantum Dynamic Volatility
Quantum Live Camarilla Levels
It can also display the current Open, High, Low, and Close prices of each symbol. Each indicator has 1 or more columns allotted to them to display information about their respective signals. Below we will discuss what each indicator does and how it displays its signals in the Radar Panel.
Tick Volumes
Volume is a powerful leading indicator, yet few traders ever take advantage of its awesome power. Why? Because identifying volume trends using the standard indicator can be confusing, and judging volume height even more so!
The Quantum Tick Volumes indicator takes a simple tool and makes it come to life! First, it paints the volume bar to match the candle. This makes it quick and easy to identify buying and selling volume with the associated price action.
Second, the Quantum Tick Volume indicator displays a dynamic mid-point, instantly telling you whether volumes are high, average or low in the session. No more guesswork! Volume analysis made simple – making it easy to spot profitable trading opportunities – fast!
In the Radar Panel, the Tick Volumes indicator displays 2 columns -Volume and Midpoint.
Columns
Volume – this column displays the current volume of the symbol and changes colors according to the sentiment of the current candle.
Midpoint – this column displays half of the highest volume bar within the current day and it is visible in intraday timeframes only
Dynamic Price Pivots
The Quantum Dynamic Price Pivots indicator could best be described as the Swiss army knife of trading. Power, simplicity and functionality all in one tool. Many traders struggle to identify reversal points based on price action alone. Why? Because you need to have a complete understanding of candlesticks, candles and candle patterns.
The dynamic pivot appears once a three-candle price pattern is created. This is one of the first signs of a possible change in sentiment, based on the price action alone. A pivot high in an uptrend, and pivot low in a down trend. So, whether you are trading long or short, the Quantum Dynamic Price Pivots indicator will instantly give you a visual signal to – pay attention! Powerful, yet so simple, and two indicators in one!
In the Radar Panel, the Dynamic Price Pivots indicator displays the last signal (isolated high or isolated low) and the number of bars since it was last seen.
Column
Last Signal – this column displays the last pivot arrow that appeared in the chart in the form of an upward (isolated low) or downward (isolated high) arrow and the number of bars since it was detected. The cell turns yellow when the arrow is seen in the last 3 bars or less.
Dynamic Volatility
Volatility can be both good and bad. Great for making money fast. Not so good when you’re on the losing side! But how do you know when a market is volatile. Is the price action you are seeing normal for that currency pair? And more importantly, what is normal?
The Quantum Dynamic Volatility indicator is designed with one objective in mind. To show you, dynamically volatile price action. You then decide, based on the price action, whether to wait, or take advantage. One of the hardest things to learn in trading, is when to stay out. The Quantum Dynamic Volatility indicator makes this child’s play – keep you safe. It could almost be called your safety belt!
In the Radar Panel, the Dynamic Volatility indicator displays the number of bars since a volatile candle was last seen.
Column
Last Signal – this column displays the number of bars since a volatile candle was detected. The cell turns magenta when the signal is seen in the last 3 bars or less.
Live Camarilla Levels
What is the Camarilla protocol, how does it work and what will it do for me?
Put simply it is a chameleon of an indicator and will appeal whether you are a more discretionary type of trader, making and taking decisions yourself, or if you prefer a more systematic or mechanical approach often associated with an EA for example. With the Camarilla levels indicator both approaches can be embraced and accommodated.
The Camarilla protocol has its roots in the open outcry trading pits, where traders considered floor pivots an essential tool. Based on these original ideas and incorporating the Camarilla equation we have developed a unique indicator which delivers clear and precise price-based support and resistance levels, which act as targets for profits, triggers for potential reversals, signals for possible breakouts, and finally stop loss placement. So, if you’re a swing or reversal trader, it’s the perfect indicator. Equally if you prefer breakout trading, again it’s the perfect indicator. And all with predetermined and clear levels for any price objectives and profit targets, with stop loss placement covered also.
In other words, a complete indicator, and one which is delivered with potential trading setups built in to help you see when key levels are being approached or breached. And to help you further when using the indicator, we have also included some simple messages to guide you as the various levels are approached and tested.
In the Radar Panel, the Live Camarilla Levels indicator displays the 12 Camarilla levels in descending order, R6 to R1 and S1 to S6, as well as the Analysis based on where the current price is situated among the 12 levels.
Columns
Analysis – this column displays messages that can guide you as the various levels are approached and tested.
R6 – R1, S1 – S6 (12 columns) – these columns display the 12 Camarilla levels calculated for the current timeframe and each one changes colors depending on the current price
OHLC Prices
Apart from the 4 Quantum indicators, the Radar Panel also displays the current OHLC prices of each symbol.
Open
High
Low
Close
Their color changes depending on the current price action.
With the portability of the TradingView platform, having the Radar Panel in your set of tools truly puts all the power of 4 Quantum indicators right at your fingertips. Get yours now.
Pivot
Quantum Radar PanelOverview
One of the biggest issues trading any market is in keeping track of trading opportunities as they arise across all the various timeframes without having multiple monitors or charts open and this is where the Radar Panel steps in. Using TradingView’s Table function, we have incorporated a host of our leading indicators on the panel which can be applied to any timeframe and from which you can instantly spot opportunities as they arise whether in terms of trend, reversals, volatility, or volume. In addition, when using a scanner such as this, it also highlights broad sentiment if, for example, you have added currency pairs from the same matrix or a group of stocks from the same sector. And you can of course have multiples open across the various timeframes.
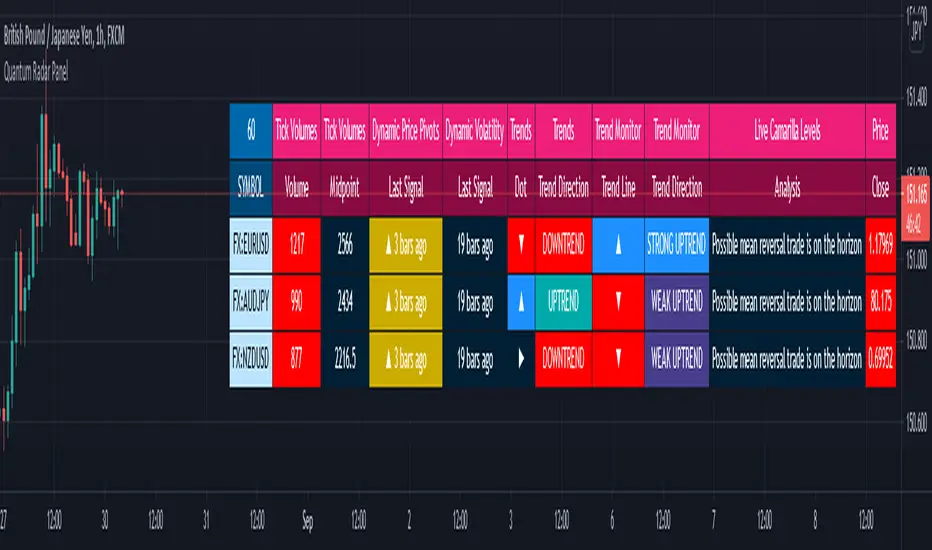
The Quantum Radar Panel is a powerful indicator that keeps track of indicator signals of up to 10 different symbols in real time. For each symbol, it can display the current signals of 6 Quantum Trading indicators namely:
Quantum Tick Volumes
Quantum Dynamic Price Pivots
Quantum Dynamic Volatility
Quantum Trends
Quantum Trend Monitor
Quantum Live Camarilla Levels
It can also display the current Open, High, Low, and Close prices of each symbol. Each indicator has 1 or more columns allotted to them to display information about their respective signals. Below we will discuss what each indicator does and how it displays its signals in the Radar Panel.
Tick Volumes
Volume is a powerful leading indicator, yet few traders ever take advantage of its awesome power. Why? Because identifying volume trends using the standard indicator can be confusing, and judging volume height even more so!
The Quantum Tick Volumes indicator takes a simple tool and makes it come to life! First, it paints the volume bar to match the candle. This makes it quick and easy to identify buying and selling volume with the associated price action.
Second, the Quantum Tick Volume indicator displays a dynamic mid-point, instantly telling you whether volumes are high, average or low in the session. No more guesswork! Volume analysis made simple – making it easy to spot profitable trading opportunities – fast!
In the Radar Panel, the Tick Volumes indicator displays 2 columns -Volume and Midpoint.
Columns
Volume– this column displays the current volume of the symbol and changes colors according to the sentiment of the current candle.
Midpoint – this column displays half of the highest volume bar within the current day and it is visible in intraday timeframes only
Dynamic Price Pivots
The Quantum Dynamic Price Pivots indicator could best be described as the Swiss army knife of trading. Power, simplicity and functionality all in one tool. Many traders struggle to identify reversal points based on price action alone. Why? Because you need to have a complete understanding of candlesticks, candles and candle patterns.
The dynamic pivot appears once a three-candle price pattern is created. This is one of the first signs of a possible change in sentiment, based on the price action alone. A pivot high in an uptrend, and pivot low in a down trend. So, whether you are trading long or short, the Quantum Dynamic Price Pivots indicator will instantly give you a visual signal to – pay attention! Powerful, yet so simple, and two indicators in one!
In the Radar Panel, the Dynamic Price Pivots indicator displays the last signal (isolated high or isolated low) and the number of bars since it was last seen.
Column
Last Signal – this column displays the last pivot arrow that appeared in the chart in the form of an upward (isolated low) or downward (isolated high) arrow and the number of bars since it was detected. The cell turns yellow when the arrow is seen in the last 3 bars or less.
Dynamic Volatility
Volatility can be both good and bad. Great for making money fast. Not so good when you’re on the losing side! But how do you know when a market is volatile. Is the price action you are seeing normal for that currency pair? And more importantly, what is normal?
The Quantum Dynamic Volatility indicator is designed with one objective in mind. To show you, dynamically volatile price action. You then decide, based on the price action, whether to wait, or take advantage. One of the hardest things to learn in trading, is when to stay out. The Quantum Dynamic Volatility indicator makes this child’s play – keep you safe. It could almost be called your safety belt!
In the Radar Panel, the Dynamic Volatility indicator displays the number of bars since a volatile candle was last seen.
Column
Last Signal – this column displays the number of bars since a volatile candle was detected. The cell turns magenta when the signal is seen in the last 3 bars or less.
Trends
All traders know that price is a leading indicator. Yet few traders ever discover how to correctly interpret the start of a new trend, or indeed the end of an old one. To add further complexity, markets spend over 70% of their time in congestion, moving sideways in a narrow range. The traders worst enemy.
What’s the answer? Step forward – the Quantum Trends indicator. With this simple and elegant indicator, dynamic trends are painted for you instantly and dynamically, in real time. In trading any market, you need to be quick on your feet, and the Quantum Trends indicator delivers in spades! But even better, not only will it signal your possible entry and exit, but it also signals a market in congestion – equally important. Knowing when to stay out, is just as important as knowing when to get in.
In the Radar Panel, the Trends indicator displays where the last trend dot is heading and the sentiment of the dot or the trend direction.
Columns
Dot – this column displays whether the current trend dot is going upwards, downwards, or sideways
Trend Direction – this column displays the sentiment of the current trend dot and its color
Trend Monitor
One of the hardest things to do in trading, is to stay in, and take the maximum profit from any position. You know how it goes. You get in and all is going well. Then the market reverses. You get frightened, and close out. What happens next?
Yes, you guessed it – the market reverses again and starts to move fast. Now it’s too late. You have missed out on some great profits, and are left wishing you had stayed in.
That’s why we developed the Quantum Trend Monitor. It does just that. It monitors the strength of the trend. It will help you stay in, when your emotion is telling you to get out. The Trend Monitor will give you the confidence, not just to stay in, but to take the maximum profit from each and every trade.
In the Radar Panel, the Trend Monitor indicator displays where the trend line (one of Trend Monitor’s 2 modes) is heading at and the current sentiment or trend direction.
Columns
Trend Line – in the indicator proper, the trend line shows the progression or steepness of the trend’s momentum, and this information is simplified as the direction of the line, whether it is going upwards, downwards, or sideways.
Trend Direction – this column displays the current sentiment and its color
Live Camarilla Levels
What is the Camarilla protocol, how does it work and what will it do for me?
Put simply it is a chameleon of an indicator and will appeal whether you are a more discretionary type of trader, making and taking decisions yourself, or if you prefer a more systematic or mechanical approach often associated with an EA for example. With the Camarilla levels indicator both approaches can be embraced and accommodated.
The Camarilla protocol has its roots in the open outcry trading pits, where traders considered floor pivots an essential tool. Based on these original ideas and incorporating the Camarilla equation we have developed a unique indicator which delivers clear and precise price-based support and resistance levels, which act as targets for profits, triggers for potential reversals, signals for possible breakouts, and finally stop loss placement. So, if you’re a swing or reversal trader, it’s the perfect indicator. Equally if you prefer breakout trading, again it’s the perfect indicator. And all with predetermined and clear levels for any price objectives and profit targets, with stop loss placement covered also.
In other words, a complete indicator, and one which is delivered with potential trading setups built in to help you see when key levels are being approached or breached. And to help you further when using the indicator, we have also included some simple messages to guide you as the various levels are approached and tested.
In the Radar Panel, the Live Camarilla Levels indicator displays the 12 Camarilla levels in descending order, R6 to R1 and S1 to S6, as well as the Analysis based on where the current price is situated among the 12 levels.
Columns
Analysis – this column displays messages that can guide you as the various levels are approached and tested.
R6 – R1, S1 – S6 (12 columns) – these columns display the 12 Camarilla levels calculated for the current timeframe and each one changes colors depending on the current price
OHLC Prices
Apart from the 6 Quantum indicators, the Radar Panel also displays the current OHLC prices of each symbol.
Open
High
Low
Close
Their color changes depending on the current price action.
With the portability of the TradingView platform, having the Radar Panel in your set of tools truly puts all the power of 6 Quantum indicators right at your fingertips. Get yours now.
Dynamic Pivot Box for Month and YearThe basic idea of the ‘Dynamic Pivot Box’ is to show only the Pivots that are closer to the Price. This is, the nearest pivots acting as support and resistance; thus hiding all other pivots which are further away from the price and also hiding the pivots from previous periods… Pivots will be hidden until price breaks out from the current box and moves to the next one. Hopefully, with this change you can focus more on the actual price action/ price patterns on the chart rather than on several/ noisy lines on the screen.
**Please note that the recommended use for this indicator is on the daily or higher timeframes if you want to see Year pivots... Monthly pivots can be still seen on the hourly chart, but I am afraid that lower timeframes will not plot the indicator properly.**
The Pivots are taken from Frank Ochoa’s book ‘Secrets of a Pivot Boss’, so if you are not familiar with them, I would recommend you to first take a look at the theory behind them.
The Pivots in this indicator are divided in two groups: ‘Standard pivot’ and ‘Camarilla’ pivots.; and then this latter is group is divided in two also: the ‘Main Camarilla’ and ‘Regular Camarilla pivot’. You can select which groups of pivots are taken into account for the ‘Dynamic Pivot Box’.
If you decide to select all Three Groups: ‘Standard Pivot’, ‘Main Camarilla’ and ‘Regular Camarilla pivot’ you will see ALWAYS 4 pivots surrounding the price. My recommendation is to select only ‘Standard Pivot’ and ‘Main Camarilla’ so that you see only between 2-3 pivots on the screen. This recommended view is actually the default settings.
In addition, if you want to further reduce noise from the chart, you can unselect the ‘Lines’ option within the SETTINGS/ STYLE menu.
What you see on the chart/sample is actually this indicator plotted twice:
1. Year Pivots which have the default settings and are shown as white ines
2. Month Pivots have also the default settings BUT I also selected the option ‘Previous Pivots’ to show the pivots from previous period , and also I unselected the ‘Lines’ options as mentioned above to reduce noise.
You are more than welcome to enhance the current version, my only ask is to please share the enhanced version back with the community. I wish I could make amends or modify the current version myself but I actually just came up with the idea and I paid a coder in Fiverr to develop it.

Pivot Points High Low MTF [Anan]█ OVERVIEW
Pivot Points High Low with Multi Time Frames support and bull/bear signal depends on pivot average
█ FEATURES
- Fully control of pivot (Source / Length Left / Length Right)
- Show HH, LL, LH, HL price on candles
- Show Avg Pivot High Low.
- Show Bull/Bear Labels.
- Control of signal accuracy (default: 0.5%)
- Show Pivot High Low Levels as a Fractal Chaos Channel.
- Multi-timeframe Table with support of Pivot High Low and pivot Average.
- BreakOut and BreakDown Labels in the table.
- Full control of displaying any row or any column.
- Full control of Table position and Size and Colors.

Pivot High/Low Analysis & Forecast [LuxAlgo]Returns pivot points high/low alongside the percentage change between one pivot and the previous one (Δ%) and the distance between the same type of pivots in bars (Δt). The trailing mean for each of these metrics is returned on a dashboard on the chart. The indicator also returns an estimate of the future time position of the pivot points.
This indicator by its very nature is not real-time and is meant for descriptive analysis alongside other components of the script. This is normal behavior for scripts detecting pivots as a part of a system and it is important you are aware the pivot labels are not designed to be traded in real-time themselves
🔶 USAGE
The indicator can provide information helping the user to infer the position of future pivot points. This information is directly used in the indicator to provide such forecasting. Note that each metric is calculated relative to the same type of pivot points.
It is also common for analysts to use pivot points for the construction of various figures, getting the percentage change and distance for each pivot point can allow them to eventually filter out points of non-interest.
🔹 Forecast
We use the trailing mean of the distance between respective pivots to estimate the time position of future pivot points, this can be useful to estimate the location of future tops/bottoms. The time position of the forecasted pivot is given by a vertical dashed line on the chart.
We can see a successful application of this method below:
Above we see the forecasted pivots for BTCUSD15. The forecast of interest being the pivot high. We highlight the forecast position with a blue dotted line for reference.
After some time we obtain a new pivot high with a new forecast. However, we can see that the time location of this new pivot high matches perfectly with the prior forecast.
The position in time for the forecast is given by:
x1_ph + E
x1_pl + E
where x1_ph denotes the position in time of the most recent pivot high. x1_pl denotes the position in time of the most recent pivot low and E the average distance between respective pivot points.
🔶 SETTINGS
Length: Window size for the detection of pivot points.
Show Forecasted Pivots: Display forecast of future pivot points.
🔹 Dashboard
Dashboard Location: Location of the dashboard on the chart
Dashboard Size: Size of the dashboard on the chart
Text/Frame Color: Determines the color of the frame grid as well as the text color

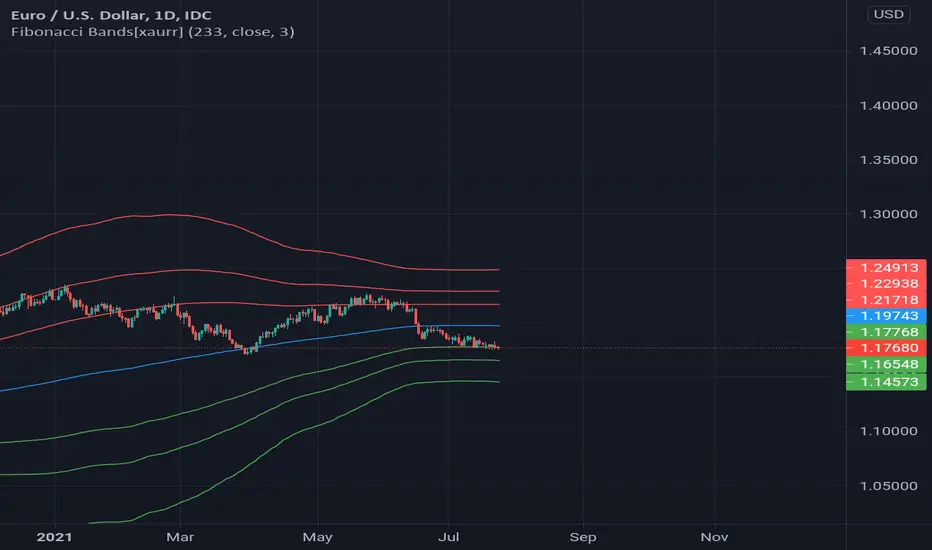
Fibonacci Bands[xaurr]This script draws Fibonacci bands according to std deviation using moving avarage with 233 periods, its the well know fibonacci number for following trend.
RSI+ChannelbandsThis Indicator displays a normal RSI with overbought/-sold lines which is calculated with donchian channels, pivot channel, bollinger bands and three horizontal lines.
You can averaged the channels, bands and h-lines in any combination or you can use just one of them for calculating the overbought/-sold lines.
The midline is colored in default settings in yellow for upptrending and blue for downtrending.

Pivot Weighted Moving AveragePivot points often act as magnets for price action. The Pivot Weighted Moving Average takes those important levels and integrates them as a weighting function into a moving average. Users can choose the level of weighting they would like to use; the higher the weighting level, the more influence the pivot points will have on the moving average. The Pivot Weighted Moving Average is a great tool for determining trend direction and for signaling dynamic support and resistance levels.

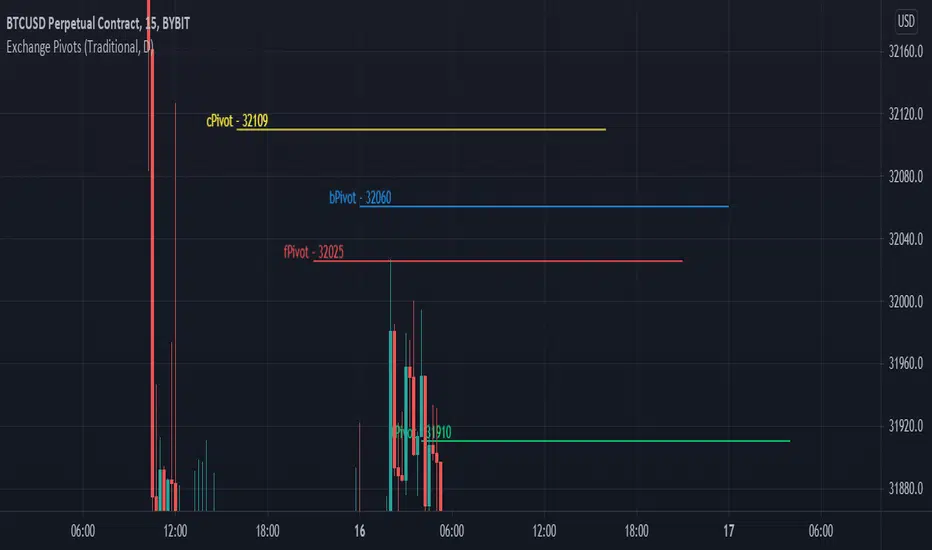
Exchange PivotsPivot points from 4 different Markets:
DailyPivot: BYBIT:BTCUSD
AsiaPivot: OKCOIN:BTCUSD
ForexPivot: FOREXCOM:BTCUSD
TradestationPivot: TRADESTATION:BTCUSD
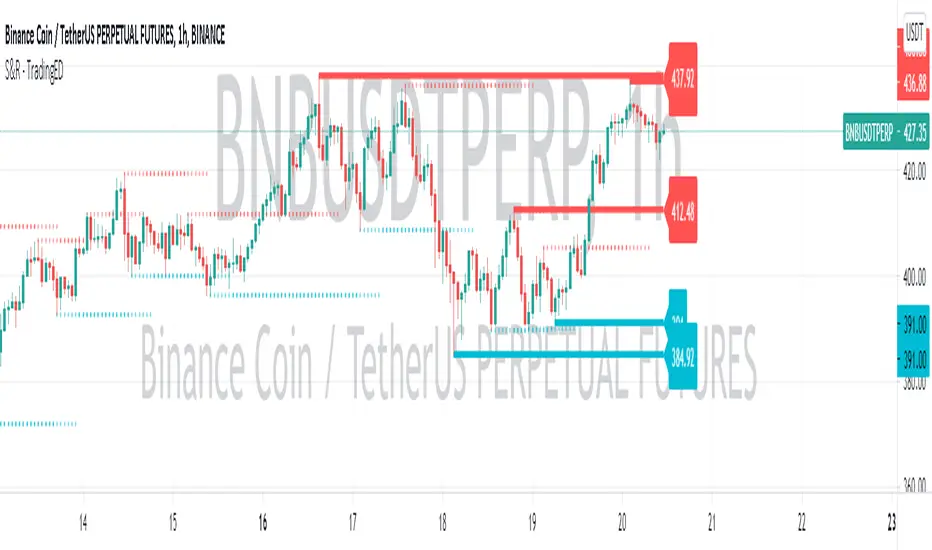
Support & Resistance - TradingEDThe use of this indicator is restricted to private use, and it can be used only by invitation. Different functionalities have been added, such as alerts and signals that seek to make trading much easier to interpret by any type of trading operator of any experience level, from beginner to intermediate and advanced.
This indicator will help you identify support and resistance levels over a previously determined range, whether from a count by candles , by minutes , hours or days . These support and resistance levels are calculated thanks to the highest and lowest points that will be painted along the chart, from the levels that you have previously selected .
You will even have a way to identify the most recent levels , thanks to the fact that they will be painted in a darker tone , as well as some price labels to quickly identify each of the levels on the chart . Identifying these levels sometimes seems like a pretty difficult task, but with this indicator you will discover that it will be much easier than you think to be able to master these levels.
As part of the analysis of chart patterns, traders use these price levels on charts that tend to act as barriers, preventing the price of an asset from being pushed in a certain direction. Support and resistance levels serve to identify the points where the price can favor certain probabilities for a stagnation or reversal of a prevailing trend.
Main functions of this indicator:
1) The MEASURE can be based on a CANDLES count if you are trading OHLC Charts from 1D onwards , or if your trading is intraday, you can also select counts by MINUTES , HOURS or DAYS , depending on your trading style.
2) LENGTH , by default it will be loaded as in the STRATEGY , but considering the previous point, you can modify it according to your convenience.
3) You have the option to hide or show the EXTENDED LEVELS the way to identify the most recent levels.
4) You have the option to hide or show a LABEL at the right of the chart, with respect to the price levels.
Main functions to customize the style of this indicator:
a) You can select the COLOR for Support and for Resistance, with the colors that best suit you.
b) In the case of the LABELS that appear at the right, the text, type of label and default color is not modifiable.
Pivot Boss - CPRThe Central Pivot Range (CPR) is used to identify key price points to set up trades. CPR is beneficial for intraday trading. This indicator can plot:
1. Daily Pivots and Daily Support/Resistance
2. Tomorrow Pivots and Support/Resistance
3. Weekly Pivots and Weekly Support/Resistance
4. Monthly Pivots and Monthly Support/Resistance
5. Previous Day High/Low
6. Previous Week and Month High/Low
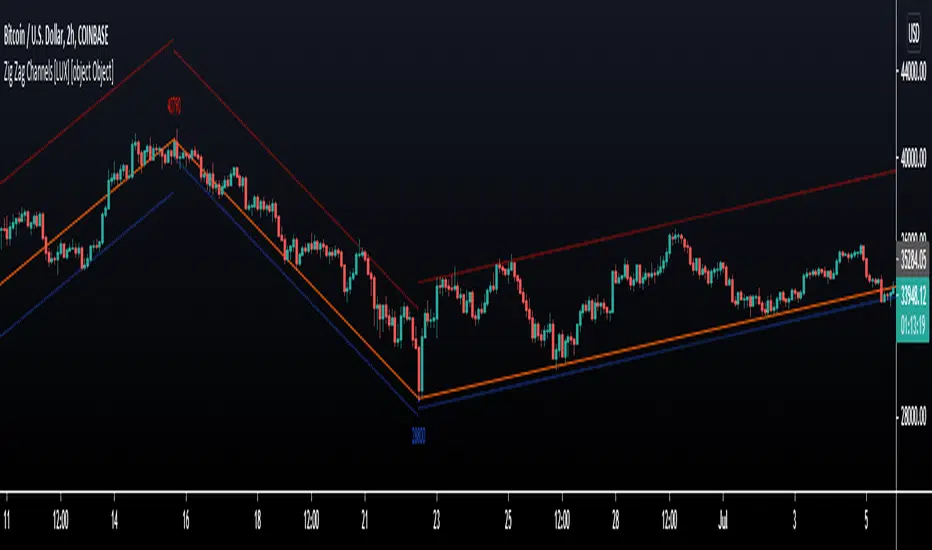
Zig Zag Channels [LuxAlgo]The Zig Zag indicator is a useful indicator when it comes to visualizing past underlying trends in the price and can make the process of using drawing tools easier. The indicator consists of a series of lines connecting points where the price deviates more than a specific percentage from a maximum/minimum point ultimately connecting local peaks and troughs.
This indicator by its very nature backpaints by default, meaning that the displayed components are offset in the past.
🔶 USAGE
The Zig Zag indicator is commonly used to returns points of references for the usage of specific drawing tools, such as Fibonacci retracements, fans, squares...etc.
The proposed indicator estimates peaks and troughs by using rolling maximums/minimums with a window size determining their significance. This window size approach allows us to have an indicator that works with a certain regularity no matter the scale of the price, something the percentage-based approach struggles with. Additionally, one upper and lower extremity are displayed, highlighting the price point that deviates the most from the Zig Zag lines.
A common usage also includes the easy determination of Elliot wave patterns in the price.
The Zig Zag indicator above highlights a downtrending motive wave.
🔹 Extremities
The novel approach taken by this Zig Zag indicator is the addition of two extremities derived from the distance between the price and the Zig Zag line, thus returning channels. It is uncommon seeing extremities in Zig Zag indicators since the line connecting peaks and troughs has rarely any other utility than seeing trend variations with more clarity and is not meant to provide an accurate estimate of underlying local trends in the price.
This channel can be useful to study the potential relationship between underlying trends and the Zig Zag line. A low width between the Zig Zag and the upper extremity indicates price variations mostly located below the Zig Zag while equal width indicates more linear trends.
When the indicator is extended to the last line, the extremities provide potential support and resistances, thus making this indicator able to forecast price variations.
🔶 SETTINGS
Length: Determines the significance of the detected peaks and troughs.
Extend To Last Bar: Extend the most recent line to the most recent closing price value.
Show Extremities: Displays the extremities.
Show Labels: Display labels highlighting the high/low prices located at peaks and troughs.
🔹 Style
Upper Extremity Color: Color of the upper extremity displayed by the indicator.
Zig Zag Color: Color of the ZigZag lines.
Lower Extremity Color: Color of the lower extremity displayed by the indicator.
Intraday Trading ZonesThis script can help in intraday trading. It can plot
1. Previous day high, low and close.
2. Intraday Fibonacci levels
3. Big Round Numbers
3. CPR (Central Pivot Range)
4. VWAP

GANN Square Of 9 PivotsGANN Square Of 9 Pivots
How to use for Intraday ?
Method 01 (From 9:05 am to 9:15 am or pre-open market)
Take the Weighted Average Price or Volume Weighted Average Price (VWAP) or Time Weighted Average Price (TWAP) of any stock or index.
You can use TWAP for Index as volume is not available.
Method 02 (From 9:05 am to 9:15 am or pre-open market)
Take the Last Traded Price (LTP) of index or stock
Method 03 (After 9:30 am or after 1st 15 min)
Only take Last Traded Price (LTP) of stock or index
Ideal Time
15min to 1hr after market opens
Indicator Features
Lines
Gray Dashed Line: Calculation Price
Teal Solid Line: Long Above
Red Solid Line: Short Below
3 Teal Dotted Lines: Bullish Targets 1, 2 & 3
3 Red Dotted Lines: Bearish Targets 1, 2 & 3
Labels
1st Numbers: Price
2nd Numbers in (): % change from LTP to that Level
For Index
As VWAP is not available for Index, TWAP (Time Weighted Average Price) values can be used for Index.
Custom Price Inputs
Price of your choice can be given manually by selecting:
Source > Custom
Enter Price > (type the price)
Timeframe
Higher timeframes like Weekly, Monthly can be changed using Timeframe Option
For More Reading
Reading: traderji.com/community/threads/intraday-trading-using-gann-calculator.39185/#post-419677
Calculator: stockmaniacs.net/freebies/free-tools/gann-square-of-9-calculator/

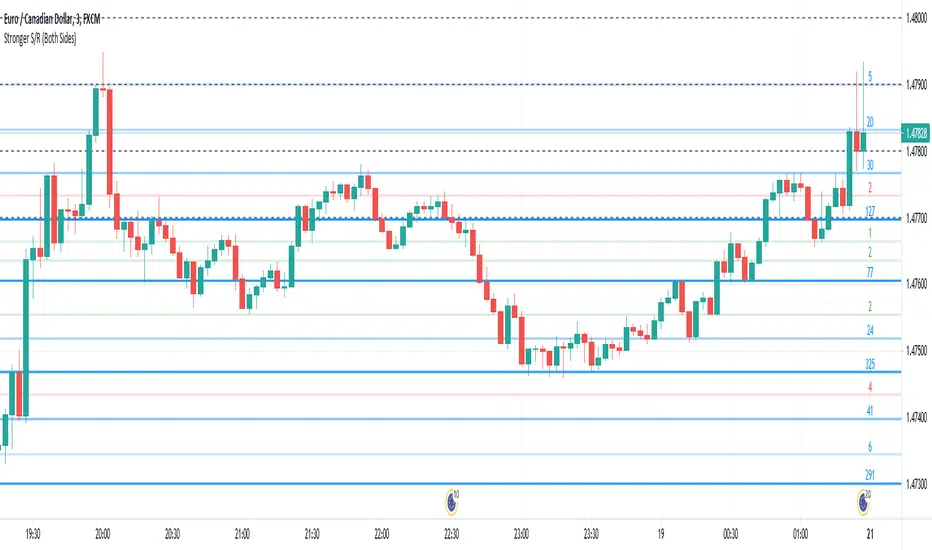
Stronger Classical Support/Resistance + Round LevelsI wrote some Support/Resistance scripts before this. In this new script, I implemented the logic of the code from the scratch, so it's very different from my previous S/R indicators and I think it's more advanced, accurate and efficient.
As the result it could do the followings for now:
- Draw more strong classical resistance/support levels by checking previous direction changes of the chart as far as Pine technically allows
- Colorize the levels based on the counted points of retracement/pullback (The darker the color is, the stronger the level is.)
- Show the number of reactions to each level
- Change the color of each level based on its main role as support, resistance or both
- Draw close round levels to current price for Forex pairs
I suggest all users of my previous S/R indicators to try this one.
Feel free to send me any issue or opinion!
Developing Pivot Range [Swastik]This is the developing cpr indicator made by Swastik.
It shows how the cpr is developing as the day is progressing.
The colour of the range is red when tc is below bc and green when tc is above bc .
While calculating the value of cpr , the high is the high from starting of the session and low is the low from starting of the session till that specific candle.
This also shows that the trend is developing.
If the colour is red and the range starts widening, it means downtrend has started to develop and
when the colour is green and range starts widening, it means uptrend is developing.

Zig Lines with Percent & ValueOverview, Features, and Usage:
The Zig Lines with Percent & Value is an indicator that highlights the highest and lowest points of the market from pivot points and zigzag lines based on the ZigZag Period setting. By a default value of 13 for the ZigZag Period this works well on Bitcoin or other alt coins on the 1 hour or higher timeframe charts.
What makes this indicator unique is that it draws a green line to signify an uptrend or a red line to signify a down trend. It will also show the percent difference between the previous point/line, for example: If you see a -negative percentage point with a red line drawn to it, then you are looking at a low pivot point and then as the green line is drawn to a +positive percentage value the percentage you see is the difference between the two points. This is great to see a trend reversal as you can look at previous pivot points and notice about how far the price moves before it changes direction (trend reversal).
There is an invisible EMA line that is used to assist with coloring the negative vs positive values. The value above or below the percentage is the lowest or highest price at that pivot point . The display of the price at the pivot point depends on your ZigZag Period setting and the timeframe of your chart.
Added Bollinger Bands as it fits perfectly with the visuals of the Zig Lines & Pivots.
Usage of Bollinger Bands:
~As the price or candle gets close to the top or bottom of the Bollinger band it can give you a better confirmation that the pivot location is at it's final place, and the trend is more likely to switch directions.
It’s important to know this indicator should not be used for alerts of any type it does repaint as the green or red line is drawing based on live chart data and it can change depending on the direction of the market. This is a great visual tool for trend analysis or to be used with other indicators as a confirmation for a possible good entry or exit position.
Credits ( and consent to use ):
Credits go to user LonesomeTheBlue for creation of this 'Double Zig Zag with HHLL' script.
The addition of the Value above/below the Percentages is from user Noldo and that script is found here:
The Bollinger Bands setup was suggested by user countseven12 and his script that uses the same BB setup is found here:
References:
1. Chen, James. (2021 March 15). Zig Zag Indicator . Received from http: www.investopedia.com
2. Mitchell, Cory. (2021 April 30). Pivot Points . Received from http: www.investopedia.com

Logging in Pine ScriptI'm building quite a lot of pretty complicated indicators/strategies in Pine Script. Quite often they don't work from the 1 try so I have to debug them heavily.
In Pine Script there are no fancy debuggers so you have to be creative. You can plot values on your screens, check them in the data window, etc.
If you want to display some textual information, you can plot some info as labels on the screen.
It's not the most convenient way, so with the appearance of tables in Pine Script, I decided to implement a custom logger that will allow me to track some useful information about my indicator over time.
Tables work much better for this kind of thing than labels. They're attached to your screen, you can nicely scale them and you can style them much better.
The idea behind it is very simple. I used few arrays to store the message, bar number, timestamp, and type of the message (you can color messages depend on the type for example).
There is a function log_msg that just append new messages to these arrays.
In the end, for the last bar, I create the table and display the last X messages in it.
In parameters, you can show/hide the entire journal, change the number of messages displayed and choose an offset. With offset, you can basically scroll through the history of messages.
Currently, I implemented 3 types of messages, and I color messages according to these types:
Message - gray
Warning - yellow
Error - red
Of course, it's a pretty simple example, you can create a much fancier way of styling your logs.
What do you think about it? Is it useful for you? What do you use to debug code in Pine Script?
Disclaimer
Please remember that past performance may not be indicative of future results.
Due to various factors, including changing market conditions, the strategy may no longer perform as good as in historical backtesting.
This post and the script don’t provide any financial advice.

Pivot Detective Indicator v1.0Overview of Features
The Pivot Detective is an indicator that simply highlights the waves of the market by identifying the pivot highs and pivot lows by using shapes and zigzag lines.
What makes this indicator unique is that you do not have to specify the number of bars to the left or right side of the pivots (aka pivot strength), nor do you need to specify percent deviation for filtering the zigzag (1)lines. Thus, the indicator will monitor price action and keep track of pivot high and low prices and implements a common trend analysis algorithm to determine when the trend has reversed to confirm the pivot price and begin tracking the next pivot price. The tolerance of the trend reversal can be configured to be strict or loose depending on your preference.
Be aware that this indicator does not determine key levels of price like support (S1, S2, etc.) and resistance (R1, R2, etc.) levels that are found in the traditional Pivot Points indicators (2).
Usage Information
The indicator can be applied to any chart at any time frame. It is very customizable where you can add or change various chart elements to help you enhance your interpretation of the price action trend reversals at the pivots. You can specify the pivot shapes, colors, and visibility as well as zigzag line thickness, color, and visibility. You can adorn the pivot shapes with any combination of price, rate of change percentage, and pivot trend using HH/LH/LL/HL text as well as control the coloring schemes for the in-progress pivot. The size of the text can also be customized.
Be aware that this indicator makes use of lines and labels which are limited to 500 lines and 500 labels, so if traverse far into the history, they will not appear because they have reached these limits and were removed by the chart's rendering engine.
Lastly, you can define "any alert() function call" messages on the "New Pivot High Point" and "New Point Low Point" events. These alerts provide custom placeholders that can be used in the messages, which are: {{exchange}}, {{ticker}}, {{currency}}, {{new_pivot_point_price}}, and {{new_pivot_point_roc}}
References
1. Chen, James. (2021 March 15). Zig Zag Indicator. Received from http: www.investopedia.com
2. Mitchell, Cory. (2021 April 30). Pivot Points. Received from http: www.investopedia.com

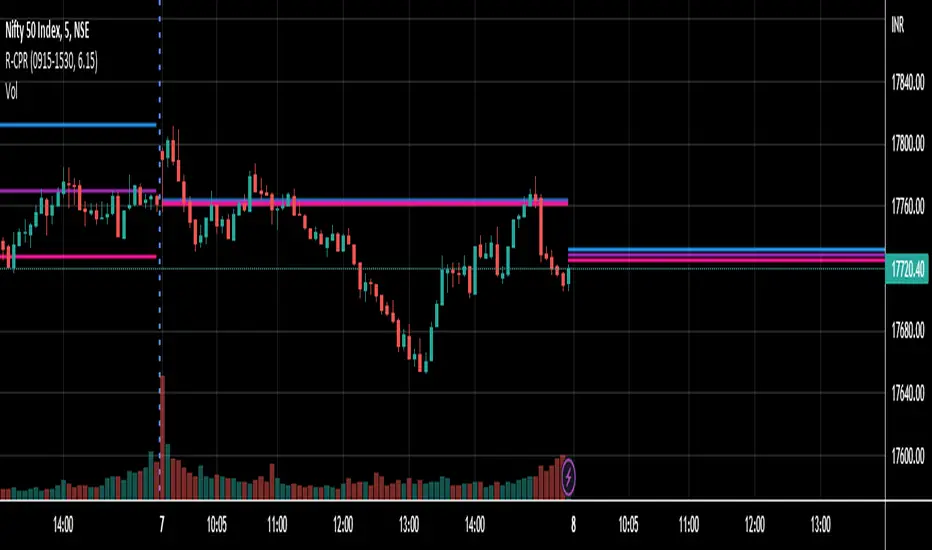
R-CPRThis is a simple CPR script that plots the following data,
Central Pivot,
Pivot,
Bottom Central Pivot.
Thanks.
TestedFX SR RADAR v3 (Support & Resistance Radar)TestedFX SR Radar is unlike any other Support and Resistance indicator I have seen to date. It doesn't just show you recent important pivots. Everyone with eyes can see those levels lol. You need an edge on the market. You need to know the levels AHEAD OF TIME. Trading is about having MORE and BETTER information than everyone else. Notice how the levels start BEFORE price touches those levels!!
How does TestedFX SR Radar do this?? Glad you asked.
Just like real radar, it searches within 5 ATR of the current price for strong pivots thousands of bars previous major pivots. But that is just the start. Then when a level is respected with a wick rejection a upvote is cast. When the level is busted a downvote is cast. The shading levels are based on the levels POWER as scored by the market voting on it. (Notice the purple dots at then end of the wicks that hit the level) Using this novel technique high probability pivot points are calculated IN ADVANCE so you know the important levels ahead of time.
Darker levels and multiple lines grouped together show strong S/R levels.
You can use this in combination with your favorite strategy. However, it was built to go with one of our private indicators. Typically good practice on TV is to include all functionality in one indicator. We tried to do that with this indicator but we couldn't because it uses too much CPU power. As it is if you change the SR Radar settings you will get "Script takes too long to execute" type errors. If that happens try hiding and showing the indicator again. If that doesn't work then reset your settings back to standard settings. The upside is that we are releasing this free to our tradingview friends.
I love this community and it is great to be able to give back. I really hope this helps you make better trading decisions. If so please let me know your experiences (good and bad) in the comments.
Sincerly,
Doug Collins
TestedFX

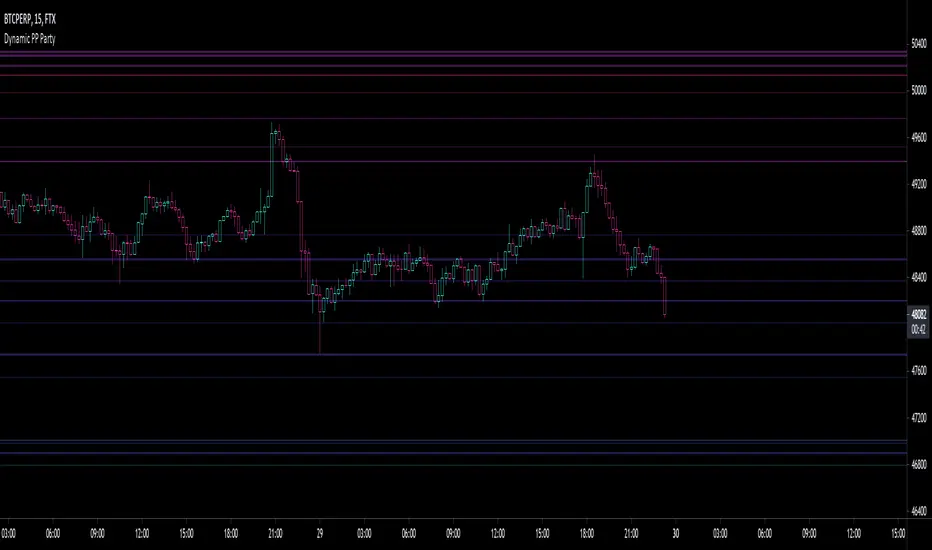
Fibonacci PP Party LTMulti-timeframe fibonacci pivot point analysis with 38.2%, 61.8% and 100% retracement levels.
Select and agglomerate different fib timeframes on your single timeframe chart fren .
The following scopes made available and stackable to your heart's desire (toggle on or off timeframes within settings):
1 Month
3 Week
2 Week
1 Week
5 Day
4 Day
3 Day
2 Day
1 Day
Go ahead, hit up that 1m & keep major support and resistance levels in plain view.
Rid your self of narrow scope , ya dope.
Warning: slow performance due to enormous heaps of timeframes hitting the dome.
Let me know where the errors are.
Make Money
Ya dummy
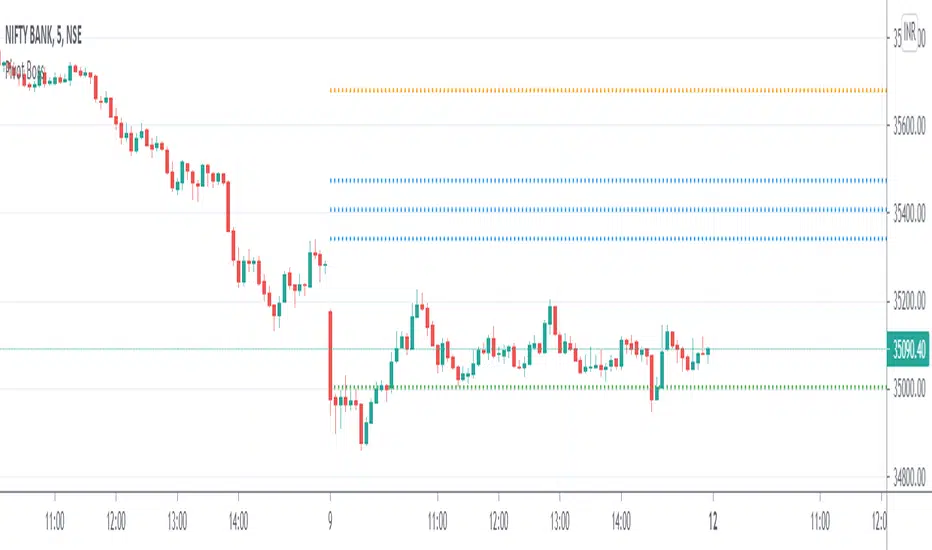
Second TimeFrame [TT]This Script Allows You to look for second Timeframe for the same Ticker or another ticker. Useful for those who cannot afford any pro versions of TV.
Anyway this doesn't let you use any indicators on it.. So you will be left with only 2 more indicators to use on the chart.
For Example : I have plotted NSE:Niftybank on upper pane and NSE:Nifty on lower pane
