PEG RSI [Auto EPS Growth]The PEG RSI is a hybrid indicator that combines fundamental valuation with technical momentum. It applies the Relative Strength Index (RSI) directly to the Price/Earnings-to-Growth (PEG) Ratio.
Unlike traditional PEG indicators that require manual input for growth rates, this script automatically calculates the Compound Annual Growth Rate (CAGR) of Earnings Per Share (EPS) based on historical data.
Key Features
- Auto-Calculated Growth: Uses historical TTM Earnings Per Share (EPS) to calculate the CAGR over a user-defined period (Default: 4 years).
- Dynamic Valuation: Converts the static PEG ratio into an oscillator (RSI) to identify relative valuation extremes.
- Trend & Momentum: Visualizes the momentum of the PEG ratio relative to its own history.
Educational Case Study
This indicator is designed for educational purposes and research. Instead of relying on fixed overbought or oversold levels, users are encouraged to study the correlation between the PEG RSI and price action independently.
- Observe how the price reacts when the PEG RSI reaches upper or lower extremes.
- Different stocks may respect different RSI zones based on their growth stability.
- Use this tool to analyze how market valuation momentum shifts over time.
Settings:
- Years for CAGR Growth: Timeframe to calculate EPS growth (Default: 4 years).
- RSI Length: Lookback period for the RSI calculation (Default: 14).
Note: This indicator works best on stocks with a consistent history of earnings. It requires financial data to function (will not work on assets without EPS like Crypto or Forex).
Price/Earnings Ratio (P/E Ratio)

D.Y Volume Swing Strategy📌 Summary of the Daniel.Yer Volume Strategy
This strategy is based on identifying the "opening volume peak" at the start of each trading day, using a user-defined sampling window.
After the sampling period ends, the strategy looks for breakouts above the daily high or below the daily low, provided they occur with a strong high-volume candle that meets the user-set threshold.
When a breakout appears in one direction, the strategy waits for an opposite-direction confirmation candle (Reversal Confirmation) and then enters a smart counter-breakout trade.
Each trade includes dynamic Stop-Loss and Take-Profit levels calculated from recent price structure, with the option to multiply stop distance according to user preference.
The strategy also gives full control over entering long only, short only, or both, as well as choosing whether trades occur exclusively from the high/low or without restrictions.
The strategy can be tested on any timeframe and evaluated across four trading directions:
✔ Buy from High
✔ Sell from High
✔ Buy from Low
✔ Sell from Low

PE Fair ValueIn short, it’s an automated fair value estimator based on the price-to-earnings model, with full manual control if TradingView’s fundamental data is missing.
Summary:
1. Lets the user choose the EPS source – either automatically from TradingView fundamentals (EPS TTM) or a manual value.
2. Attempts to fetch the stock’s P/E ratio (TTM) automatically; if unavailable, it uses a manual fallback P/E.
3. Calculates:
Actual P/E = current price ÷ EPS
Fair Value = EPS × chosen (auto/manual) P/E
Percentage difference between market price and fair value
4. Plots the fair-value line on the chart for visual comparison.
5. Displays a table in the top-right corner showing:
EPS used
Target P/E
Actual P/E
Fair value
Current price
Difference vs fair value (colored green or red)
6. Creates alerts when the stock is trading above or below the calculated fair value.
7. Also plots the current closing price for reference.

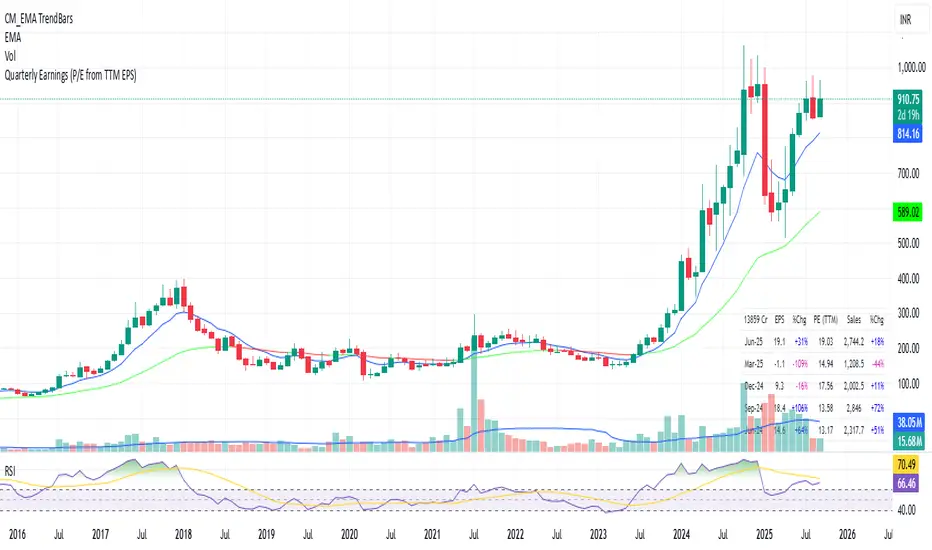
Quarterly EarningsThis Pine script shows quarterly EPS, Sales, and P/E (TTM-based) in a styled table.
PE Rating by The Noiseless TraderPE Rating by The Noiseless Trader
This script analyzes a symbol’s Price-to-Earnings (P/E) ratio, using Diluted EPS (TTM) fundamentals directly from TradingView.
The script calculates the Price-to-Earnings ratio (P/E) using Diluted EPS (TTM) fundamentals. It then identifies:
PE High → the highest valuation point over a 3-year historical range.
PE Low → the lowest valuation point over a 3-year historical range.
PE Median → the midpoint between the two extremes, offering a fair-value benchmark.
PE (Int) → an additional intermediate low to track more recent undervaluation points. This is calculated based on lowest valuation point over a 1-year historical range
These levels are plotted directly on the chart as horizontal references, with markers showing the exact bars/dates when the extremes occurred. Candles corresponding to those days are also highlighted for context.
Bars corresponding to these extremes are highlighted (red = PE High, green = PE Low).
How it helps
Provides a historical valuation framework that complements technical analysis. We look for long opportunity or base formation near the PE Low and be cautious when stocks tends to trade near High PE.
We do not short the stock at High PE infact be cautious with long trades.
Helps identify whether current price action is happening near overvalued or undervalued zones.
Adds a long-term perspective to support swing trading and investing decisions. If a stock is coming from Low PE to Median PE and along with that if we get entry based on Classical strategies like Darvas Box, or HH-HL based on Dow Theory.
Offers a simple visual map of how far the market has moved from “cheap” to “expensive.”
This tool is best suited for long-term investors and swing traders who want to merge fundamentals with technical setups.
This indicator is designed as an educational tool to illustrate how valuation metrics (like earnings multiples) can be viewed alongside price action, helping traders connect fundamental context with technical execution in real market conditions.

Forward P/E CalculatorI could not find a forward P/E indicator that gave me proper results. So here is mine.

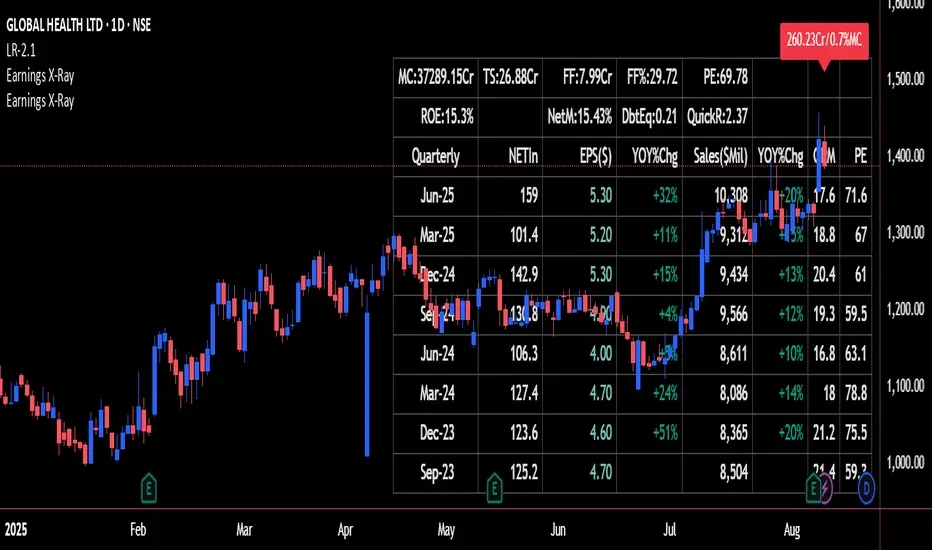
Earnings X-Ray and Fundamentals Data:VSMarketTrendThis indicator calculates essential financial metrics for stocks using TradingView's built-in functions and custom algorithms. The values are derived from fundamental data sources available on TradingView.
Key Output Metrics(YOY Basic Quaterly DATA)
MC (Market Cap): Company’s total market value (Price × Total Shares).
TS (Total Shares Outstanding): All shares (float + restricted) in circulation.
Sales: Annual revenue (TTM or latest fiscal year).
NETIn: Net income
P/E (Price-to-Earnings): Valuation ratio (Market Cap / Net Income or Price / EPS).
EPS (Earnings Per Share): Net income per share (Net Income / TS).
OPM (Operating Margin %): Core profitability (Operating Income / Revenue × 100).
Quick Ratio: Short-term liquidity ((Current Assets – Inventory) / Current Liabilities).
BVPS (Book Value Per Share): Equity per share (Shareholders’ Equity / TS).
PS (Price-to-Sales): Revenue-based valuation (Market Cap / Annual Revenue).
FCF (Free Cash Flow Per Share): Post-CapEx cash ((Operating Cash Flow – CapEx) / TS).
Data Sources & Methods
Uses TradingView’s request.financial() for income/balance sheet data (Revenue, EBITDA, etc.).
Fetches real-time metrics via request.security() (e.g., Shares Outstanding).
Normalizes data across timeframes (quarterly/annual).
Disclaimer
Not financial advice. Verify with official filings before trading.
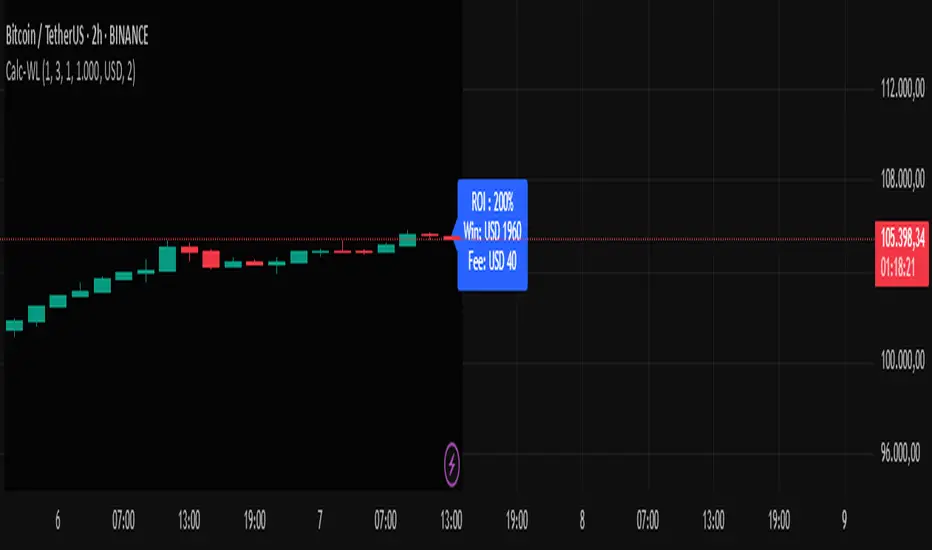
Calc win-LoserHow to Use the Calc win-Loser Indicator
The indicator calculates the profit or loss of the operation, showing how much you gained or lost on the invested amount, without adding the initial capital, displaying only the profit or loss separately.
Use a period (.) to separate decimal numbers, without thousand separators (e.g., 1000 for one thousand, 1000.50 for one thousand and fifty cents).
Price Definition for Calculation
Long Position (buy):
Low Price: entry price (lower)
High Price: exit price (higher)
Example: enter at 1 and exit at 3
Short Position (sell):
High Price: entry price (higher)
Low Price: exit price (lower)
Example: enter at 3 and exit at 1
Main Parameters
Parameter Description Example
Low Price Base price for calculation (Long: entry; Short: exit) 1
High Price Base price for calculation (Long: exit; Short: entry) 3
Leverage Operation multiplier (leverage) 2.0
Universal Amount Total amount invested 1000
Broker Fee (%) Percentage fee charged by broker 0.1
Currency Currency symbol for value display USD
Practical Example
Long: entry at 1, exit at 3, 2x leverage, $1000 investment, 0.1% fee.
Short: entry at 3, exit at 1, 2x leverage, $1000 investment, 0.1% fee.
The indicator will show the expected profit or loss based on the percentage difference adjusted by leverage and subtracting the broker fee.
Notes
Adjust prices according to the type of operation (Long or Short).
Use a period for decimals and do not use thousand separators.
This indicator is a simulation tool and does not execute automatic trades.
Original indicator by Canhoto-Medium — protected to maintain order and respect, prevent copying and plagiarism.
Enhanced Zones with Volume StrengthEnhanced Zones with Volume Strength
Your reliable visual guide to market zones — now with Multi-Timeframe (MTF) power!
What you get:
Clear visual zones on your chart — color-coded boxes that highlight important price areas.
Blue Boxes for neutral zones — easy to spot areas of indecision or balance.
Gray Boxes to show normal volume conditions, giving you context without clutter.
Green Boxes highlighting bullish zones where strength is showing.
Red Boxes marking bearish zones where weakness might be in play.
Multi-Timeframe Support:
Seamlessly visualize these zones from higher timeframes directly on your current chart for a bigger-picture view, helping you make smarter trading decisions.
How to use it:
Adjust the box width (in bars) to fit your trading style and timeframe.
Customize colors and opacity to suit your chart theme.
Toggle neutral blue and gray volume boxes on/off to focus on what matters most to you.
Set the maximum number of boxes to keep your chart clean and performant.
Why you’ll love it:
This indicator cuts through the noise by visually marking zones where volume and price action matter the most — without overwhelming your chart. The MTF feature means you’re always aligned with higher timeframe trends without switching views.
Pro tip:
Use these boxes as dynamic support/resistance areas or to confirm trade setups alongside your favorite indicators.
No complicated formulas here, just crisp, actionable visuals designed for clarity and confidence.

Metatrader CalculatorThe “ Metatrader Calculator ” indicator calculates the position size, risk, and potential gain of a trade, taking into account the account balance, risk percentage, entry price, stop loss price, and risk/reward ratio. It supports the XAUUSD, XAGUSD, and BTCUSD pairs, automatically calculating the position size (in lots) based on these parameters. The calculation is displayed in a table on the chart, showing the lot size, loss in dollars, and potential gain based on the defined risk.

Simple Time-Based Strategy(Price Action Hypothesis)Core Theory: Trend Continuation Pattern Recognition**
1. **Price Action Hypothesis**
The strategy is built on the assumption that consecutive price movements (3-bar patterns) indicate momentum continuation:
- *Long Pattern*: Three consecutive higher closes combined with ascending highs
- *Short Pattern*: Three consecutive lower closes combined with descending lows
This reflects a belief that sustained directional price movement creates self-reinforcing trends that can be captured through simple pattern recognition.
2. **Time-Based Risk Management**
Implements a dynamic exit mechanism:
- *Training Phase*: 5-bar holding period (quick turnover)
- *Testing Phase*: 10-bar holding period (extended exposure)
This dual timeframe approach suggests the hypothesis that market conditions may require different holding durations in different market eras.
3. **Adaptive Market Hypothesis**
The structure incorporates two distinct phases:
- *Training Period (11 years)*: Pattern recognition without stop losses
- *Testing Period*: Pattern recognition with stop losses
This assumes markets may change character over time, requiring different risk parameters in different epochs.
4. **Asymmetric Risk Control**
Implements stop-losses only in the testing phase:
- Fixed 500-pip (point) stop distance
- Activated post-training period
This reflects a belief that historical patterns might need different risk constraints than real-time trading.
5. **Dual-Path Validation**
The split between training/testing phases suggests:
- Pattern validity should first be confirmed without protective stops
- Real-world implementation requires added risk constraints
6. **Market Efficiency Paradox**
The simultaneous use of both long/short entries assumes:
- Markets exhibit persistent inefficiencies
- These inefficiencies manifest differently in bullish/bearish conditions
- A symmetric approach can capture opportunities in both directions
7. **Behavioral Finance Elements**
The 3-bar pattern recognition potentially exploits:
- Herd mentality in trend formation
- Delayed reaction to price momentum
- Cognitive bias in trend confirmation
8. **Quantitative Time Segmentation**
The annual-based period division (training vs testing) implies:
- Market cycles operate on multi-year timeframes
- Strategy robustness requires validation across different market regimes
- Parameter sensitivity needs temporal validation
This strategy combines elements of technical pattern recognition, temporal adaptability, and phased risk management to create a systematic approach to trend exploitation. The theoretical framework suggests markets exhibit persistent but evolving patterns that can be systematically captured through rule-based execution.

[INVX] P/E band (panel)What is it?
The P/E Bollinger Band indicator is a hybrid tool combining fundamental analysis (P/E ratio) with technical analysis (Bollinger Bands).
It uses Bollinger Bands around a company's P/E ratio to identify potentially overvalued or undervalued zones.
The P/E ratio itself measures a stock's price relative to its earnings per share.
The Bollinger Bands, based on standard deviations, create a dynamic upper and lower band around the average P/E ratio.
Why P/E Bollinger Band?
Provides a visual representation of a company's relative valuation compared to its historical P/E range.
Can help identify areas where the P/E ratio might be deviating significantly from its historical norm.
Who should use it
Investors who combine technical and fundamental analysis for a more comprehensive stock evaluation.
Value investors seeking to identify potentially undervalued companies.
How to use
A P/E value that breaches the upper Bollinger Band suggests potential overvaluation, indicating the stock might be due for a price correction.
Conversely, a P/E value that falls below the lower Bollinger Band might signal undervaluation, presenting a potential buying opportunity (considering the company's fundamentals remain sound).

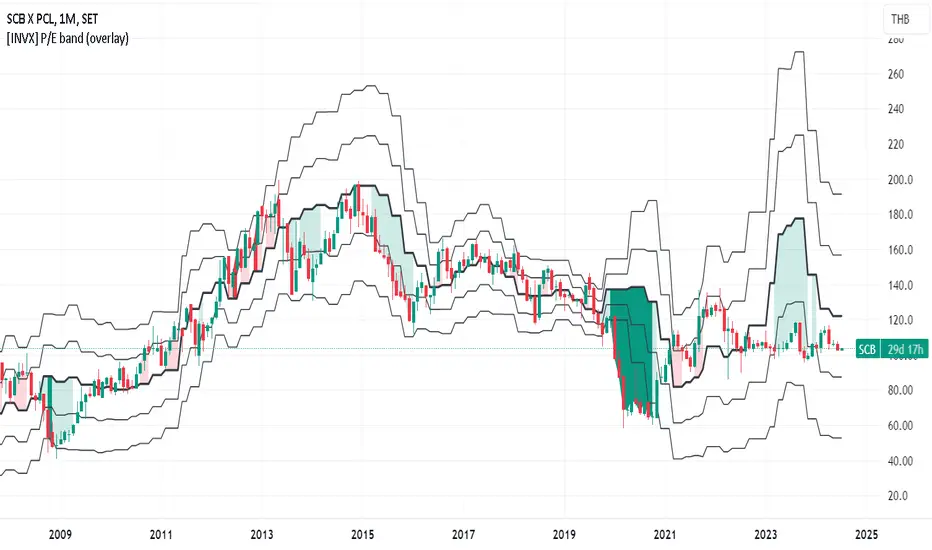
[INVX] P/E band (overlay)What is it?
The P/E Bollinger Band indicator is a hybrid tool combining fundamental analysis (P/E ratio) with technical analysis (Bollinger Bands).
It uses Bollinger Bands around a company's P/E ratio to identify potentially overvalued or undervalued zones.
The P/E ratio itself measures a stock's price relative to its earnings per share.
The Bollinger Bands, based on standard deviations, create a dynamic upper and lower band around the average P/E ratio.
Why P/E Bollinger Band?
Provides a visual representation of a company's relative valuation compared to its historical P/E range.
Can help identify areas where the P/E ratio might be deviating significantly from its historical norm.
Who should use it
Investors who combine technical and fundamental analysis for a more comprehensive stock evaluation.
Value investors seeking to identify potentially undervalued companies.
How to use
A P/E value that breaches the upper Bollinger Band suggests potential overvaluation, indicating the stock might be due for a price correction.
Conversely, a P/E value that falls below the lower Bollinger Band might signal undervaluation, presenting a potential buying opportunity (considering the company's fundamentals remain sound).
The Strat with Continuity [starlord_xrp]This indicator shows entry and exit points for The Strat as well as potential setups. It also has full time frame continuity detection.

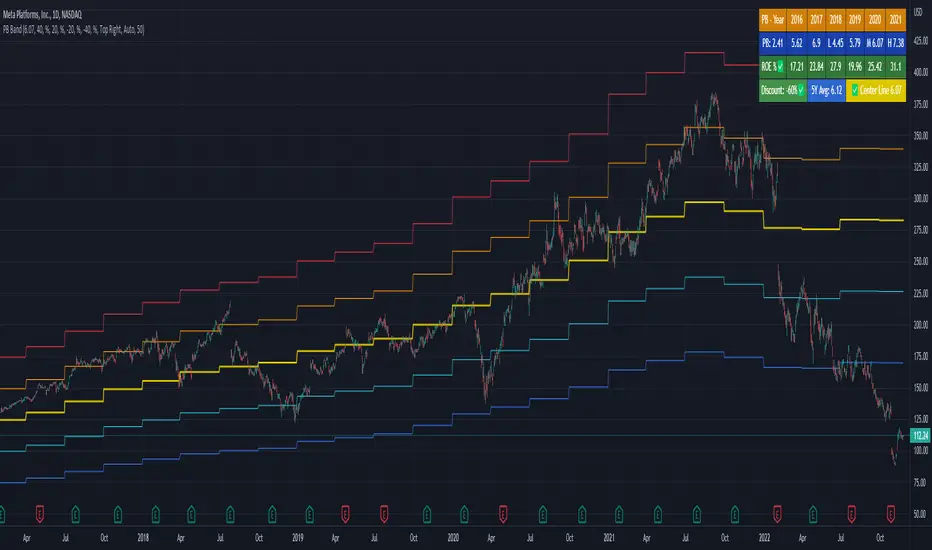
PE Band V2PE Band is a very practical stock selection technique for investors, which can be used to judge whether the company's stock price is currently overvalued or undervalued.
The PE ratio center line of the stock must be set every time the stock is changed because of the program limitation of Tradingview.
Usually we use the 5-year median to judge whether the company's stock price has a discount .
Not all stocks are suitable for using PE Band, especially cyclical stocks.
You can also use ROE to determine whether the company is a cyclical stock.

PB BandPB Band is a very practical stock selection technique for investors, which can be used to judge whether the company's stock price is currently overvalued or undervalued.
The PB ratio center line of the stock must be set every time the stock is changed because of the program limitation of Tradingview.
Usually we use the 5-year median to judge whether the company's stock price has a discount.
Not all stocks are suitable for using PB Band, especially cyclical stocks.
You can also use ROE to determine whether the company is a cyclical stock.
PEG Ratio (Most Accurate)Price Earnings To Growth (PEG) Ratio
PEG ratio is a stock's PE ratio divided by the growth rate of its earnings for a specified time period.
The PEG ratio is used to determine a stock's value while also factoring in the company's expected earnings growth, and it is thought to provide a more complete picture than the more standard P/E ratio.
PEG ratio 1 is fair value.
PEG ratio above > 2 is are generally considered overvalued.
PEG ratio below < 1 is Undervalued.
Negative PEG ratio indicate the company no growing in specified time period.
Example of How to Use the PEG Ratio
The PEG ratio provides useful information to compare competitive companies and see which stock might be the better choice for an investor's needs, as follows.
Google (13-Sep-2022) 👍
PEG ratio = 0.38%
P/E ratio = 19.17%
Meta (13-Sep-2022) 👎
PEG ratio = 0.63%
P/E ratio = 12.55%
Many investors may look at Meta and find it more attractive since it has a lower P/E ratio. But compared to Google, it doesn't have a high enough growth rate to justify its current P/E.
Google is trading at a discount to its growth rate and investors purchasing it are paying less per unit of earnings growth. Based on its lower PEG, Google may be relatively the better buy.

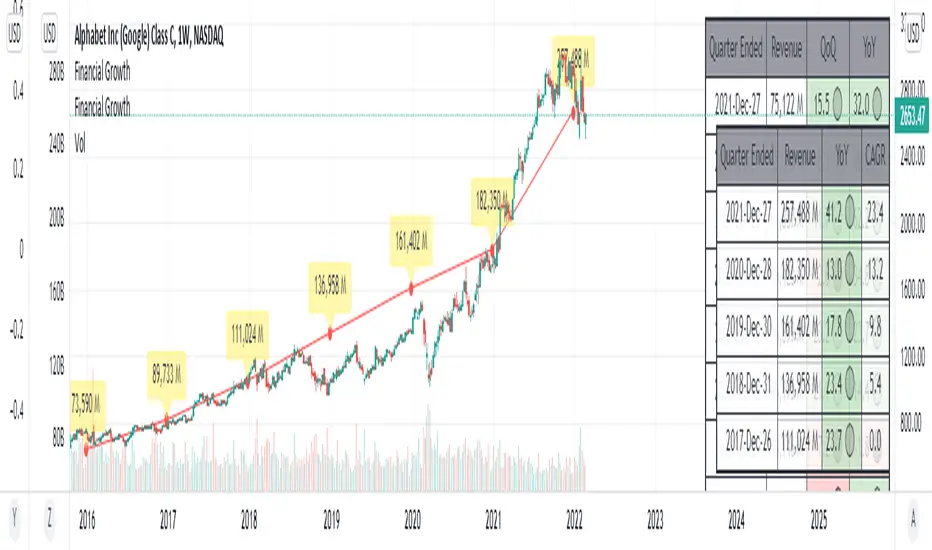
Financial GrowthThis indicator will acquire the financial data provided by Tradview.
the data is compare between Quarter, Annual and TTM in term of percent of growth.
YoY, QoQ and CAGR is also available by this script (The minimum is 4).
in addition, ploting of data, label and table also available (you can check the mark to toggle on / off).
Data : Revenue, Net Income, EBITDA, EPS, DVPS, Free Cash Flow and Forward PE .
How to use it.
just select the financial data, period and size of data to compare.
you can check the box to toggle the plotting line, label and table.
Enjoy.
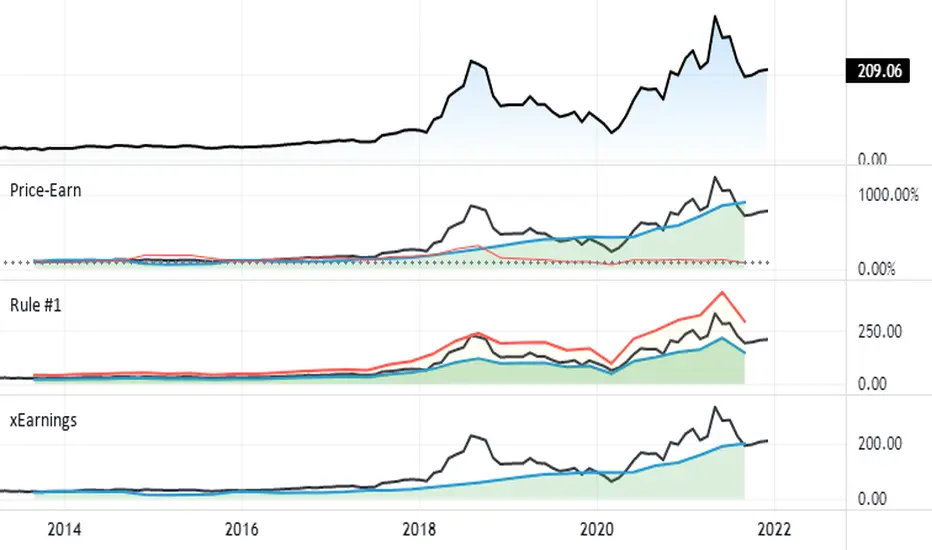
Silen's Financials Fair ValueIt is finally here! 🔥 My 3rd and most important script in my Financial series! 🚀
Ever imagined to see all fundamentals (or many that is) combined into one indicator that is right on your chart, showing you how your favorite stock is trading compared to its fundamentals?
Well, here is your answer! 📡
____________________________________________________________________________________________
This script shows you my own personal interpretation of fair value, based solely on the financial fundamentals of a company compared to market averages.
I don't believe that certain sectors of the market should be priced higher than others. If you look at historical data you'll see that favored sectors always rotate - placing insanely high P/E multiples on some sectors. Once they are "out" and people rotate away from those sectors you're left with nothing but the naked fundamentals that matter. So, you'll see many companies, that have been doing well on paper, see their share price decline by 70-90% for no other reasons than people favoring other sectors.
That's why it's even more important to focus on fair value that is solely fundamentals-based. Know when your stock gets to expensive. 🤯
____________________________________________________________________________________________
To give you some examples:
- Most Megacaps trade at historically high valuations, several times my fair value. Those include AAPL, MSFT, NVDA, AMZN, TSLA, JPM, TSM, V and so on. And no, in the past they partially traded below (my) fair value.
- Most Cybersecurity / Cloud companies are trading at truly massive multiples of my fair value. (NET, DDOG, etc)
- Many Smallcaps & Midcaps are trading several multiples (OESX, CODX, QFIN) below my fair value. And no, in the past they partially traded above (my) fair value.
Ok, so much about the market. You ultimately decide how much you want to orientate on fair value. 👨🏫
____________________________________________________________________________________________
This fair value indicator (purple line):
Takes the P/E rate of the company and compares it to the market (50% weight)
Takes the P/S rate of the company and compares it to the market (50% weight)
Then adds boni and mali f or debt/equity rates and debt and equity itself
Also looks at past growth and calculates future P/E and P/S rates which adds , in some cases, value to the fair value (green line)
Also compares how historical valuations have behaved compared to fair value and simulates a fair value guideline (dark blue line)
____________________________________________________________________________________________
This script is part 3️⃣ of a series of indicators that work well together.
Script 1️⃣ of the series is:
P/E & P/S Rates
Script 2️⃣ of the series is:
Debt & Equity
If you use all 3 scripts together it will look like this, giving you truly deep and simple information about the fundamentals of a company:
Example 1 - AMD
Example 2 - HZO
Example 3 - APPS
I hope this script makes your investing and stock picks a lot easier! 🔆💹🕗
Disclaimer: Fair value is always subjective. There are many different approaches to fair value. This one is only my personal interpretation.
Disclaimer 2: This script works only for the Day-Timeframe.
Disclaimer 3: This script uses 17,5 P/E and 3,0 P/S as market averages. The actual average keeps changing but, historically speaking, these seemed to be good numbers.
Feel free to share your thoughts and feedback! 🙃

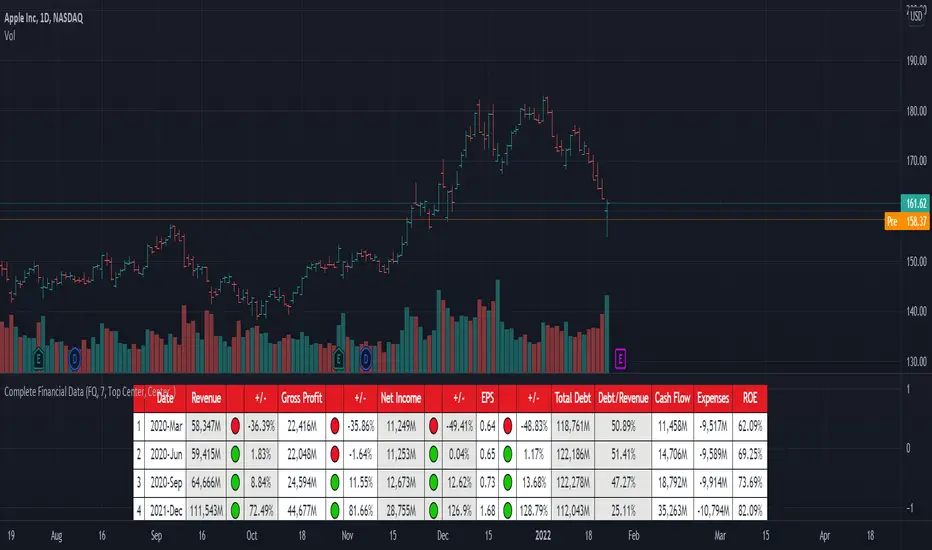
[TG] Complete Financial DataHISTORY & CREDITS
Complete Financial Data is basic, yet very effective tool, that will show the most important information from the company's latest financial statements at a glance.
WHAT IT DOES
The table is designed to show comprehensive financial data about the selected ticker.
Revenue - often referred to as sales or the top line, is the money received from normal business operations.
Gross profit , also called gross income, is calculated by subtracting the cost of goods sold from revenue.
Net income , also called net earnings, is calculated as sales minus cost of goods sold, selling, general and administrative expenses, operating expenses, depreciation, interest, taxes, and other expenses.
Earnings per share (EPS) is calculated as a company's profit divided by the outstanding shares of its common stock. The resulting number serves as an indicator of a company's profitability.
Total debt includes long-term liabilities, such as mortgages and other loans that do not mature for several years, as well as short-term obligations, including loan payments and accounts payable balances.
The debt-to-revenue ratio is a financial measure that compares a company's monthly debt payment to its monthly gross income.
The term cash flow refers to the net amount of cash and cash equivalents being transferred in and out of a company. Cash received represents inflows, while money spent represents outflows.
An expense is the cost of operations that a company incurs to generate revenue. As the popular saying goes, “it costs money to make money.”
Return on equity (ROE) is a measure of financial performance calculated by dividing net income by shareholders' equity.
HOW TO USE IT
Even if you are entirely a technical analyst, it's always a good practice to take a look at the company's fundamentals, in order to understand more about the heath of the business. Look for companies that beat expectations and show positive growth numbers.
FX Profit CalculatorWith this indicator, you will be able to see how much you earn in forex in dollar terms.
It asks you 3 things when adding the indicator.
TP point
SL point
Position Entry point
If you have selected the TP point above, the entry zone below it, and the SL point below it, the indicator will automatically understand that there is a BUY order and will make the calculations accordingly.
The same is true for the opposite.
When you use the indicator in any parity, you will have problems switching to other parities.
So either use it only in one parity, or update your targets from the indicator settings at every parity change.
You will get the same error if:
Your trading entry point should be between your TP and SL points. If you do not set it this way, the indicator will warn that please fix it.
If you are in the trade, tick the settings and show the dollar-based profit of your position according to the instant closing price.
The percentage variable works like this:
When you adjust for one parity, shifts occur in the chart when you switch to the other parity. When switching to non-circulating graphics at the same prices, the user is prompted to re-enter so that the graphic does not deteriorate.
BONUS : You can move these lines up and down with your mouse on the graphic :)

FlōatFloat by AlphanumetriX is an invaluable tool to aid and abet the trader and investor.
Float can...
Assist in managing positions
Assist in identifying new positions
Assist in your accounting practices
Assist with risk management
What is Float?
The value of Float is in its simplicity. After becoming accustomed to it, you will wonder how you ever traded without it.
Float is not a ‘Buy and Sell’ indicator, it can be considered a calculator/risk management tool and position manager.
Float has advanced mathematics built into its code that allows you to set complex parameters that will be clearly displayed over your TradingVeiw charts.
View your P/L in percentage % terms after leverage and in Fiat $ terms after Leverage.
Box
After entering all commands in the settings, you are clearly able to view all pertinent information of your trade in real-time.
Float will apply and recalculate any amendments that you enter instantaneously.
BEFORE entering a trade, use Float to…
Identify where your liquidation point would be, relative to the amount of leverage applied to the trade.
Identify where a potential Stop Loss or Take Profit point could be placed.
Assess the Risk/Reward of the trade.
Run mock trades to gauge your performance prior to live trading.
Calculate the Capital and Quantity of assets post leverage.
Some examples below
