Normalized Relative Vigor IndexThis is the Relative Vigor Index indicator just multiplied by 100 to have non-zero integer part
Relative

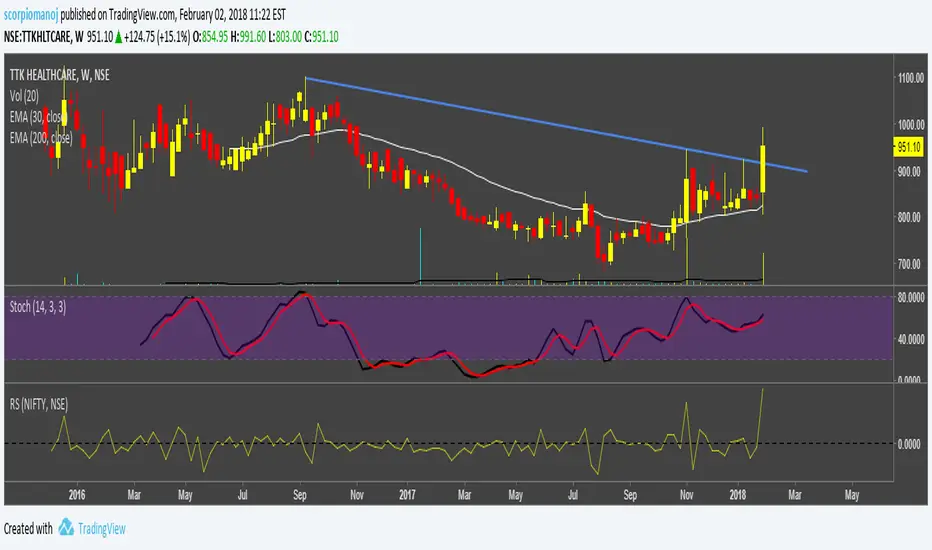
STAN WEINSTEIN RS INDEX WITH NIFTYThis is an indicator for Indian markets.
It shows the relative strength of particular stock to the underlying index.
The concept of this indicator is well described in Stan Weinstein's book.
AJCrows RSIRelative Strength Index with indicator lines at 20, 30, 50, 70 and 80 marks. Use settings to show/hide these lines, and to choose appropriate colors.

Currency Relative Strengths V.2 [GM]Version 2 Updates
Speed has been increased by ~7X
Highest and lowest pairs now highlighted using brighter colors
Re-ordered pairs from highest to lowest 'flight to risk' rating
I created this tool for the purpose of determining strongest and weakest currencies over different periods of time. Each major currency is compared to the field of other majors and its average change is measured over a predetermined period of time. The result is displayed as a percentage. I use it for trend following but it can also be used to fade exhaustion.
Instructions
Add indicator to chart
Select a time frame under settings
Place cursor over period of interest
Click "Data Window" on right hand side bar
View % change avg values for each currency

Relative Strength of 2 securities - Jayy This is an update of the Relative Strength to index as used by Leaf_West.. 4th from the top. my original RS script is 3rd from the top.
In this use of the term " Relative Strength" (RS) what is meant is a ratio of one security to another.
The RS can be inerpreted in a fashion similar to price action on a regual security chart.
If you follow his methods be aware of the different moving averages for the different time periods.
From Leaf_West: "on my weekly and monthly R/S charts, I include a 13 EMA of the R/S (brown dash line) and
an 8 SMA of the 13 EMA (pink solid line). The indicator on the bottom of the weekly/monthly charts is an
8 period momentum indicator of the R/S line. The red horizontal line is drawn at the zero line.
For daily or 130-minute time periods (or shorter), my R/S charts are slightly different
- the moving averages of the R/S line include a 20EMA (brown dash line), a 50 EMA (blue dash line) and
an 8 SMA of the20 EMA (pink solid line). The momentum indicator is also slightly different from the weekly/monthly
charts – here I use a 12 period calculation (vs 8 SMA period for the weekly/monthly charts)."
Leaf's website has gone but I if you are interested in his methods message me.
What is different from my previous RS: The RS now displays RS candles. So if you prefer to watch price action of candles to
a line chart which only plots the ratio of closes then this will be more interesting to you.
I have also thrown in a few options to have fun with.
Jayy

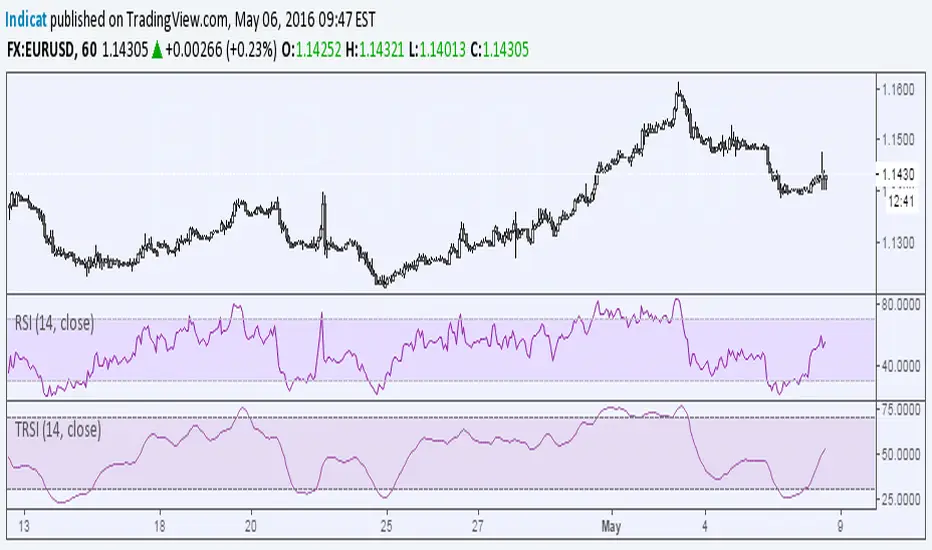
Relative Strength Index on TranquilizersSome weeks ago, I had a patient in my practice who suffered from internal stability disorders.
Certainly not a case of disordered thinking or schizophrenic behaviour, because his general sense of direction wasn’t the problem.
He just couldn’t find the right overall balance, an ailment he struggled with for years.
Straight away I could diagnose that surgery wasn’t an option, so I gave him a medicine he would clearly benefit from.
I never heard from him again…. He must be doing just fine.
Cheers, Indicat...
Momentum of Relative strength to Index Leaf_West styleMomentum of Relative Strength to index as used by Leaf_West. This is to be used with the companion Relative Strength to Index indicator Leaf_West Style. Make sure you use the same index for comparison. If you follow his methods be aware of the different moving averages for the different time periods. From Leaf_West: "on my weekly and monthly R/S charts, I include a 13 EMA of the R/S (brown dash line) and an 8 SMA of the 13 EMA (pink solid line). The indicator on the bottom of the weekly/monthly charts is an 8 period momentum indicator of the R/S line. The red horizontal line is drawn at the zero line.
For daily or 130-minute time periods (or shorter), my R/S charts are slightly different - the moving averages of the R/S line include a 20EMA (brown dash line), a 50 EMA (blue dash line) and an 8 SMA of the20 EMA (pink solid line). The momentum indicator is also slightly different from the weekly/monthly charts – here I use a 12 period calculation (vs 8 SMA period for the weekly/monthly charts)." Leaf's methods do evolve and so watch for any changes to the preferred MAs etc..

Relative strength to Index set up as per Leaf_WestRelative Strength to index as used by Leaf_West. If you follow his methods be aware of the different moving averages for the different time periods. From Leaf_West: "on my weekly and monthly R/S charts, I include a 13 EMA of the R/S (brown dash line) and an 8 SMA of the 13 EMA (pink solid line). The indicator on the bottom of the weekly/monthly charts is an 8 period momentum indicator of the R/S line. The red horizontal line is drawn at the zero line.
For daily or 130-minute time periods (or shorter), my R/S charts are slightly different - the moving averages of the R/S line include a 20EMA (brown dash line), a 50 EMA (blue dash line) and an 8 SMA of the20 EMA (pink solid line). The momentum indicator is also slightly different from the weekly/monthly charts – here I use a 12 period calculation (vs 8 SMA period for the weekly/monthly charts)." Leaf's methods do evolve and so watch for any changes to the preferred MAs etc..

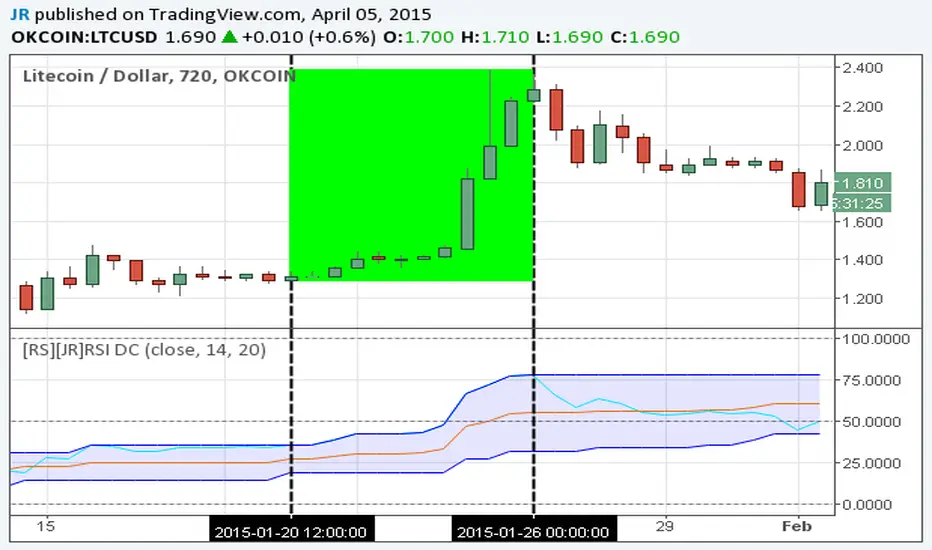
[RS][JR]RSI Donchian ChannelsRSI Donchian Channels
Built by Ricardo and JR
Here is a great indicator to use for strong trends. Donchian Channels react immediately to changes in the highest high and lowest low. For strong trends you want to trade when RSI is set along the upper or lower DC-RSI envelope. When the RSI releases from the DC-RSI envelope, you can take the trade off.
Multi Timeframe RSIThis will show you the RSI of the higher timeframes (up to 1D). Current Timeframe is colored red, higher timeframes are colored from light gray to darker gray (you can change that).
There are several ways to enter a trade:
1. look for rising RSI on higher timeframe (line is stepping up in indicator window), wait for current RSI to decline to oversold (with length 14 its below 30), look for a buy entry (vice versa for a sell setup)
2. look for all RSI timeframes to decline to oversold, this is a good zone to enter a buy (vice versa for a sell setup)
Keep in Mind that a Stochastic Indicator can have it's High/Low befor Price will have it.
Good Luck :)

Relative Momentum Index The Relative Momentum Index (RMI) was developed by Roger Altman. Impressed
with the Relative Strength Index's sensitivity to the number of look-back
periods, yet frustrated with it's inconsistent oscillation between defined
overbought and oversold levels, Mr. Altman added a momentum component to the RSI.
As mentioned, the RMI is a variation of the RSI indicator. Instead of counting
up and down days from close to close as the RSI does, the RMI counts up and down
days from the close relative to the close x-days ago where x is not necessarily
1 as required by the RSI). So as the name of the indicator reflects, "momentum" is
substituted for "strength".

Relative Volatility Index The RVI is a modified form of the relative strength index (RSI).
The original RSI calculation separates one-day net changes into
positive closes and negative closes, then smoothes the data and
normalizes the ratio on a scale of zero to 100 as the basis for the
formula. The RVI uses the same basic formula but substitutes the
10-day standard deviation of the closing prices for either the up
close or the down close. The goal is to create an indicator that
measures the general direction of volatility. The volatility is
being measured by the 10-days standard deviation of the closing prices.
