Donchian Trend Ranges [AlgoAlpha]🚀🔗 Donchian Trend Ranges 🔗🚀
Elevate your trading game with the Donchian Trend Ranges indicator from AlgoAlpha! 🌟📈 This advanced tool helps you visualize market trends and potential reversal points using Donchian channels, volatility measures, and average true range (ATR).
Key Features
⚙️ Customizable Parameters: Adjust the lookback period and range multiplier to fit your trading style.
🎨 Color-Coded Trends: Easily distinguish between uptrends and downtrends with customizable colors.
📊 Dynamic Channels: Visualize multiple dynamic channels based on Donchian ranges and volatility.
☁️ Trend Clouds: See market strength and weakness with upper and lower trend clouds.
🔔 Signal Alerts: Get notified of potential trend shifts and take profit points.
How to Use
🛠 Add the Indicator: Add the indicator to favorites. Customize settings such as the lookback period and range multiplier to match your trading needs.
🔍 Analyze Trends: The indicator calculates the highest and lowest prices over a specified period to create dynamic channels. It then uses standard deviation and ATR to adjust these channels for market volatility, plotting upper and lower ranges. Green bars indicate an up trend and red bars for a down trend.
🔔 Set Alerts: Enable notifications for bullish and bearish trend shifts, as well as weak and strong take profit points, ensuring you never miss an opportunity.
How it Works
The Donchian Trend Ranges indicator calculates the highest and lowest prices over a specified period to create a basis line. It creates a range around the basis based on standard deviations and the clouds' width is determined by a 14 period ATR. The basis line and bar colors changes based on whether the closing price is above or below it, indicating trends. Clouds around these lines represent market reversal zones that can be used as entry levels when used in confluence with momentum indicators, visual signals ("X" and "◆") marking strong and weak take profit points are also printed when the prices revert from the clouds towards the basis. Integrated alerts notify you of significant events like trend shifts and take profit signals, keeping you informed without constant monitoring.
Unleash the power of the Donchian Trend Ranges in your trading strategy! 🌐📈✨
Reversaltrading

Bull Bear Trend IndicatorIntroduction: Origin of the Swing Point Indicator
In the quest for a reliable indicator that accurately predicts trend directions and identifies valid highs and lows, the genesis of the Swing Point Indicator emerged. Faced with the challenge of finding a tool that provided comprehensive market analysis and actionable insights, the need for a novel solution became evident. Combining insights gleaned from market analysis and innovative algorithmic approaches, the Swing Point Indicator was born.
Enhanced Feature: Highs and Lows Labeling in Trend Direction
In addition to its core functionalities, the Swing Point Indicator incorporates an advanced feature that enhances the visualization of trend direction. This feature provides further clarity by selectively labeling highs and lows based on the prevailing trend, reinforcing the identification of higher highs and lower lows in uptrends and downtrends, respectively. Overlapping labels on highs and lows signify a potential trend change, providing traders with valuable insight into market reversals.
Detailed Description:
1. Uptrend Labeling:
- Higher Highs (Green Label with Price): In an uptrend, where higher highs are observed, the indicator labels these points with vibrant green color and includes the corresponding price value. This visually highlights the significance of higher highs as pivotal points in the upward trajectory of prices.
- Higher Lows (Red Marker without Text or Diamond): To complement the identification of higher highs, higher lows are marked with a distinct red marker or diamond, devoid of any accompanying text. While these points are crucial in delineating the ascending trend, their emphasis lies in their role as support levels, providing a foundation for upward price movements.
2. Downtrend Labeling:
- Lower Lows (Red Label with Price): Conversely, in a downtrend characterized by lower lows, the indicator labels these points with conspicuous red color, accompanied by the corresponding price value. Lower lows signify critical levels of downward price momentum, acting as indicators of potential bearish continuation.
- Lower Highs (Green Marker without Text or Diamond): Lower highs, indicative of downward retracements in a downtrend, are marked by distinctive green markers or diamonds without accompanying text. While these points denote temporary pauses or pullbacks in the bearish trend, their emphasis lies in their role as resistance levels, impeding upward price movements.
Functionality and Utility:
- Customizable Lookback Candle Count: Traders have the option to adjust the lookback candle count, which is set by default at 108 candles in the settings. This flexibility allows traders to tailor the indicator to their specific trading preferences and timeframes.
- Equal Highs or Lows Option: When enabled, the Swing Point Indicator can identify equal highs or equal lows, providing traders with additional insight into market dynamics.
- Formation Confirmation: A new higher high along with its higher low or a new lower low along with its lower high is confirmed after two candles have closed following the swing point candle. This ensures the reliability of the identified trend direction.
Conclusion:
The incorporation of selective labeling for highs and lows based on trend direction, alongside the introduction of customizable settings and formation confirmation criteria, enhances the effectiveness of the Swing Point Indicator. This feature-rich tool empowers traders with a nuanced understanding of market dynamics, highlighting critical price levels and trend reversals. By offering enhanced visualization, customizable options, and confirmation criteria, the Swing Point Indicator equips traders with the confidence and precision needed to navigate the markets successfully, contributing to more informed and profitable trading strategies.

WaveTrend Ribbon [AlgoAlpha]🌟🚀 Introducing the WaveTrend Ribbon by AlgoAlpha - Your Next-Level Trading Companion! 🚀🌟
Dive into the world of advanced trading with the WaveTrend Ribbon by AlgoAlpha, a cutting-edge indicator designed to elevate your trading strategy on TradingView. 📈💡 This powerful tool combines the efficiency of the WaveTrend oscillator with innovative Z-score analysis to offer clear, actionable trading signals. 🌊🎯
Key Features:
🔧 Customizable Parameters: Tailor the indicator to your trading needs with adjustable settings including Channel Length, Average Length, Overbought/Oversold Levels, and more.
📊 WaveTrend Oscillator: Utilizes a smoothed version of the average price to identify potential market reversals.
📉 Z-Score Analysis: Enhances signal reliability by measuring the standard deviation of the current price from the mean.
🎨 Dynamic Color Coding: Visual cues shift between up and down colors to indicate market trends, making it easy to read at a glance.
⚠️ Divergence Detection: Automatic identification of bullish and bearish divergences for early signal warnings.
🔔 Custom Alerts: Stay ahead with real-time alerts for key trading events like bullish/bearish divergences and trend reversals.
How to Use WaveTrend Ribbon :
Maximize your trading potential with the WaveTrend Ribbon by following these simple steps:
🔍 Add to Chart: Locate "WaveTrend Ribbon " in TradingView's Indicators & Strategies and apply it to your chart. Dive into the settings to customize the parameters like Channel Length, Average Length, and the Overbought/Oversold levels to match your trading strategy.
- Channel Length affects the sensitivity of the WaveTrend oscillator to price movements. A shorter Channel Length increases responsiveness, useful in volatile markets but may lead to false signals. It's ideal for traders looking for quick reactions to price changes.
- Average Length is used to smooth the oscillator further, influencing how quickly the indicator responds to trend changes. A shorter Average Length allows for a quicker response to the oscillator's movements, suitable for short-term trading strategies.
📊 Analyze the Market: Pay close attention to the color transitions and position of the Z-score in relation to its moving average for insights into market direction. Look out for the overbought and oversold conditions for potential reversal points.
🔔 Set Up Alerts: Utilize the built-in alert system to get notified of key events like trend reversals, bullish and bearish divergences, and more, so you can make timely decisions without having to constantly monitor the charts.
Basic Logic Explained:
The WaveTrend Ribbon is an advanced trading indicator that leverages the WaveTrend oscillator, enhanced by Z-score normalization and moving averages for precise market trend analysis. It calculates the average price deviation over a set period (Channel Length), smoothing it with an Average Length to identify trends. Z-score analysis further refines signals by comparing oscillator deviations against its historical performance, highlighting overbought or oversold conditions. The indicator generates signals for potential reversals and market entries/exits, visualized through dynamic color coding and customizable alerts for traders to act upon efficiently. This multi-layered approach provides a deeper insight into market dynamics, offering a blend of trend following and momentum strategies.
By highlighting overbought and oversold conditions with dynamic color changes and providing reversal signals, this indicator is a must-have tool for traders aiming to capitalize on market trends. 📈🚀
Elevate your trading experience with the WaveTrend Ribbon, your go-to indicator for navigating the markets with confidence and precision. Happy trading! 🌟🚀

Supertrended RSI [AlgoAlpha]🚀📈 Introducing the Supertrended RSI Indicator by AlgoAlpha!
Designed to empower your trading decisions, this innovative Pine Script™ creation marries the precision of the Relative Strength Index (RSI) with the dynamic prowess of the SuperTrend methodology. Whether you’re charting the course of cryptos, riding the waves of stock markets, or navigating the futures landscape, our SuperTrended RSI Indicator is your go-to tool for uncovering unique trend insights and crafting trading strategies. 🌟
Key Features:
🔍 Enhanced RSI Analysis: Combines the traditional RSI with a supertrend calculation for a dynamic look at market trends.
🔄 Multiple Moving Averages: Offers a selection of moving averages including SMA, HMA, EMA, and more for tailored analysis.
🎨 Customizable Visuals: Choose your own color scheme for uptrends and downtrends to match your trading dashboard.
📊 Flexible Input Settings: Tailor the indicator with customizable lengths, factors, and smoothing options.
⚡ Real-Time Alerts: Set alerts for bullish and bearish reversals to stay ahead of market movements.
Quick Guide to Using the Supertrended RSI Indicator
Maximize your trading with the Supertrended RSI by following these streamlined steps! 🚀✨
🛠 Add the Indicator: Search for "Supertrended RSI " in TradingView's Indicators & Strategies. Customize settings like RSI length, MA type, and Supertrend factors to fit your trading style.
🎨 Visual Customization: Adjust uptrend and downtrend colors for clear trend visualization.
📊 Market Analysis: Watch for the Supertrend color change for trend reversals. Use the 70 and 30 lines to spot overbought/oversold conditions.
🔔 Alerts: Enable notifications for reversal conditions to capture trading opportunities without constant chart monitoring.
How It Works:
At the core of this indicator is the combination of the Relative Strength Index (RSI) and the Supertrend framework, it does so by applying the SuperTrend on the RSI. The RSI settings can be adjusted for length and smoothing, with the option to select the data source. The Supertrend calculation takes into account a specified trend factor and the Average True Range (ATR) over a given period to determine trend direction.
Visual elements include plotting the RSI, its moving average, and the Supertrend line, with customizable colors for clarity. Overbought and oversold conditions are highlighted, and trend changes are filled with distinct colors.
🔔 Alerts: Enable alerts for crossover and crossunder events to catch every trading opportunity.
🌈 Whether you're a seasoned trader or just starting, the Supertrended RSI offers a fresh perspective on market trends. 📈
💡 Tip: Experiment with different settings to find the perfect balance for your trading style!
🔗 Explore, customize, and enhance your trading experience with the Supertrended RSI Indicator! Happy trading! 🎉

Reversal and Breakout Signals [AlgoAlpha]🚀🌟 Introducing the Reversal and Breakout Signals by AlgoAlpha 🌟🚀
This innovative tool is crafted to enhance your chart analysis by identifying potential reversal and breakout opportunities directly on your charts. It's designed with both novice and experienced traders in mind, providing intuitive visual cues for better decision-making. Let's dive into the key features and how it operates:
### Key Features:
🔶 Dynamic Period Settings: Customize the sensitivity of the indicator with user-defined periods for both the indicator and volume strength.
📊 Volume Threshold: Set a threshold to define what constitutes strong volume, enabling the identification of significant market movements.
💡 Trend Coloring: Option to color candles during trends, making it easier to visualize bullish and bearish market conditions.
🌈 Customizable Visuals: Choose your preferred colors for bullish, bearish, and breakout signals, personalizing the chart to your liking.
🚨 Advanced Alert System: Configure alerts for reversal and breakout signals, ensuring you never miss a potential trading opportunity.
### How to Use:
To maximize the effectiveness of the Reversal and Breakout Signals tool, follow these steps:
1. 🔧 Set Up Your Preferences:
- Adjust the Indicator Period and Volume Strength Period to match the timeframe of your trading strategy. This fine-tuning allows the indicator to better align with your specific market analysis needs.
- Define the Strong Volume Threshold to distinguish between ordinary and significant volume movements. This helps in identifying breakout or reversal signals with higher confidence.
2. 🎨 Customize Visuals:
- Choose colors for Bullish , Bearish , and Breakout Signals to visually differentiate between different types of market activities. This customization facilitates quicker decision-making while scanning charts.
3. 🔍 Reversal Signals:
- Bullish Reversal : Look for a triangle below the bar indicating a potential upward movement. It's identified when the price dips below the lower level but closes above it, suggesting a rejection of lower prices.
- Bearish Reversal : A triangle above the bar signals a potential downward movement. This occurs when the price spikes above the upper level but closes below, indicating a rejection of higher prices.
4. 📈 Trend and Breakout Signals:
- Diamonds represent breakout signals. A bullish breakout is marked below the bar when the price closes above the upper level, suggesting strong buying pressure. Conversely, a bearish breakout above the bar indicates strong selling pressure as the price closes below the lower level.
- The tool also features a Trend Tracker that highlights the current market trend using the Hull Moving Average (HMA). This can help you stay aligned with the overall market direction for your trades.
By integrating these steps into your trading strategy, the Reversal and Breakout Signals tool can provide actionable insights to help identify potential entry and exit points, enhancing your trading decisions with visual cues and alerts for market reversals and breakouts.
### How It Works:
The core logic revolves around calculating weighted moving averages of high and low prices over a user-defined period, identifying the highest and lowest points within this period to establish potential breakout or breakdown levels while reducing the amount of noise, hence the use of moving averages.
1. Weighted Moving Averages Calculation:
sh = ta.wma(high, len)
sl = ta.wma(low, len)
h = ta.highest(sh, len)
l = ta.lowest(sl, len)
2. Breakout and Reversal Detection:
The script then employs logic to detect bullish and bearish breakouts and reversals based on the closing price's position relative to these levels, combined with volume analysis to confirm the strength of the move.
if not (h < h or h > h )
hstore := h
if not (l < l or l > l )
lstore := l
bullishbreakout := (breakout or ((breakout or breakout or breakout or breakout ) and candledir == 1)) and strongvol and not (bullishbreakout or bullishbreakout or bullishbreakout )
bearishbreakout := (breakdown or ((breakdown or breakdown or breakdown or breakdown ) and candledir == -1)) and strongvol and not (bearishbreakout or bearishbreakout or bearishbreakout )
3. Visual Indicators and Alerts:
Visual cues such as triangle shapes for reversals and diamonds for breakouts, along with colored bars, make it easy to spot these opportunities. Additionally, alerts can be set up for these events, ensuring traders can react promptly to potential trading setups.
plotshape(bullishrej and not (state ==- 1) ? low * 0.9995 : na, " Bullish Reversal ", shape.triangleup, location.belowbar, color.new(green, 0), size = size.tiny, text = "𝓡", textcolor = color.gray)
plotshape(bearishrej and not (state == 1) ? high * 1.0005 : na, " Bearish Reversal ", shape.triangledown, location.abovebar, color.new(red, 0), size = size.tiny, text = "𝓡", textcolor = color.gray)
plotshape(bullishbreakout ? low * 0.999 : na, " Bullish Breakout ", shape.diamond, location.belowbar, color.new(yellow, 0), size = size.tiny, text = "𝓑", textcolor = color.gray)
plotshape(bearishbreakout ? high * 1.001 : na, " Bearish Breakout ", shape.diamond, location.abovebar, color.new(yellow, 0), size = size.tiny, text = "𝓑", textcolor = color.gray)
This script is a versatile tool designed to aid in the identification of key reversal and breakout points, helping traders to make informed decisions based on technical analysis. Its customization options allow for a tailored analysis experience, fitting the unique needs and strategies of each trader.

Volume Exhaustion [AlgoAlpha]Introducing the Volume Exhaustion by AlgoAlpha, is an innovative tool that aims to identify potential exhaustion or peaks in trading volume , which can be a key indicator for reversals or continuations in market trends 🔶.
Key Features:
Signal Plotting : A special feature is the plotting of 'Release' signals, marked by orange diamonds, indicating points where the exhaustion index crosses under its previous value and is above a certain boundary. This could signify critical market points 🚨.
Calculation Length Customization : Users can adjust the calculation and Signal lengths to suit their trading style, allowing for flexibility in analysis over different time periods. ☝️
len = input(50, "Calculation Length")
len2 = input(8, "Signal Length")
Visual Appeal : The script offers customizable colors (col for the indicator and col1 for the background) enhancing the visual clarity and user experience 💡.
col = input.color(color.white, "Indicator Color")
col1 = input.color(color.gray, "Background Color")
Advanced Volume Processing : At its core, the script utilizes a combination of Hull Moving Average (HMA) and Exponential Moving Average (EMA) applied to the volume data. This sophisticated approach helps in smoothing out the volume data and reducing lag.
sv = ta.hma(volume, len)
ssv = ta.hma(sv, len)
Volume Exhaustion Detection : The script calculates the difference between the volume and its smoothed version, normalizing this value to create an exhaustion index (fff). Positive values of this index suggest potential volume exhaustion.
f = sv-ssv
ff = (f) / (ta.ema(ta.highest(f, len) - ta.lowest(f, len), len)) * 100
fff = ff > 0 ? ff : 0
Boundary and Zero Line : The script includes a boundary line (boundary) and a zero line (zero), with the area between them filled for enhanced visual interpretation. This helps in assessing the relative position of the exhaustion index.
Customizable Background : The script colors the background of the chart for better readability and to distinguish the indicator’s area clearly.
Overall, Volume Exhaustion is designed for traders who focus on volume analysis. It provides a unique perspective on volume trends and potential exhaustion points, which can be crucial for making informed trading decisions. This script is a valuable addition for traders looking to enhance their trading experience with advanced volume analysis tools.

Reversal Confirmations [QuantVue]The Reversal Confirmation Indicator is based on price action and looks to provide opportunities when price gets stretched.
The indicator works by finding the highest and lowest points over the user selected lookback period.
If price closes below the low of the highest bar or closes above the high of the lowest bar a possible reversion to the mean may occur and the indicator will plot a triangle and fire an alert.
This indicator works a reversion to the mean or to potentially time entries in trending markets.
Fully customizable settings:
🔹Lookback Period
🔹Colors
🔹Show / hide upper & lower channels
🔹Show / hide the mean
Give this indicator a BOOST and COMMENT your thoughts!
We hope you enjoy.
Cheers!

ATR Trend Reversal Zone indicatorThis indicator helps avoid taking reversal trades too close to the 21 EMA, which may fail since the market often continues its trend after retracing from the 21 EMA level. It does not generate a direct signal for reversal trades but rather indicates points where you can consider potential reversal trades based on your trading methodology
This script defines an indicator that calculates the 21 Exponential Moving Average (EMA) and the Average True Range (ATR) for a given period. It then computes the distance between the most recent closing price and the 21 EMA in terms of ATR units. If this distance is equal to or greater than 3 ATRs, a small green circle is plotted below the corresponding bar on the chart, indicating a potential reversal condition.
Strategy:Reversal-CatcherWhat
This is a plain and vanilla reversal based strategy for intraday (15m) timeframe on Futures prices of the assets.
Now what all it comprises of?
It finds out the dynamic support & resistance from Bollinger Band (20 period, 1.5 std dev).
It finds out the potential divergence of price deviation from 5 period exponential moving average (EMA).
If the previous candle (N-1) shows a divergence it confirms the reversal by checking the present candle (N) to be closed inside the Bollinger Band.
It confirms the momentum by checking RSI shows a crossover/crossunder to oversold (30) / overbought (70) region.
It also confirms whether the trend is up (then only reversal trade to short) or down (then only reversal trade to long). The trend is checked with EMA-21 and EMA-50.
Re-affirmation Condition : It re-affirms the position of two successive candles called as `hhLLong` and `hhLLShort` in the script.
Why
In Indian context, retail participants are pre-dominantly (yes- 80% of Indian daily volume) Options buyers mainly in weekly indices (Nifty, BankNifty, FinNifty, CNXMidcap, Sensex, Bankx .. well everyday is expiry now in India, except -- Thank God -- Saturday & Sunday).
And in Index Options the momentum plays a big role.
If one can catch a good reversal point the potential of high Risk-to-Reward trade (hence earn handsomely) is very likely (please note: there is no holy grail in trading. Nothing works 100%).
So this is the attempt to catch a reversal.
Re-affirmation of Reversal
hhLLong : It's a reversal point after an uptrend. It checks the relative positioning of current candle compared to that of previous candle. [The details are in the script. Check for variable hhLLong in script.
hhLLShort : It's a reversal point after a downtrend. It checks the relative positioning of current candle compared to that of previous candle. [The details are in the script. Check for variable hhLLShort in script.
Unique-ness
What's unique in it? Why we decided to publicly share this:
Already given the context of The Great Indian Options Buyers community. It should be helpful to them, we believe.
It takes Very Less Number of Trades with High Accuracy . Please check the result in NSE:NIFTY1! in 15m timeframe. 71% accuracy with roughly a trade in a month.
There is no point giving brokers' the brokerages taking 10 trades a day and ending not-so-good EoD. Better lets take less trades with better result possibility. .
Mention
There are many people uses this variation of Bolling Band, 5EMA
Many people use RSI, trends and relative positioning of candles.
--> We are grateful to all of them. It's really difficult to mention everyone's name. But all people somehow influence the thought process. Thanks for all of them.
Statutory Disclaimer
There is no silver bullet / holy grail in trading. Nothing works 100% time. One has to be careful about the loss (s)he can bear in case of the trade goes against.
We, as the author of this script, is not responsible for any trading or position decision one is taken based on the outcome of this.
It is our sole discretion to change, add, delete the portion or withdraw the whole script without any prior notice or intimation.
In Indian Context : We are not SEBI registered, will never be SEBI registered.

Baha'i Reversal Points [CC]The Baha'i Reversal Points is a custom creation that combines some of my favorite passions, creating stock indicator scripts and my faith. The Baha'i Faith believes in the oneness of God and all religions, and sees the number 9 as significant because that is the number of major world religions as well as the Baha'i symbol is a nine-pointed star. The number 19 is also seen as significant because in the Baha'i calendar, there are 19 months, and each month is made up of 19 days. Anyway, with all that being explained, I created these reversal points to find the points where the last 19 highs or lows are higher or lower, respectively than the previous high or low nine days ago. As with many indicators, this does have some hits and misses but does a pretty good job of finding reversal points based on these criteria.
There are a few different ways to analyze this data to determine when to buy or sell. I have set the default behavior for when we encounter the first time that the amount of highs or lows is greater than or equal to the length amount using a crossover or crossunder alert. You could also ignore the crossover or crossunder alerts and buy when the count is greater than or equal to the length, which can happen for extended periods depending on the underlying trend. Overall, buy when the buy label appears and sell when the sell label appears.
Let me know if there are any other custom indicators or scripts you would like to see me publish!

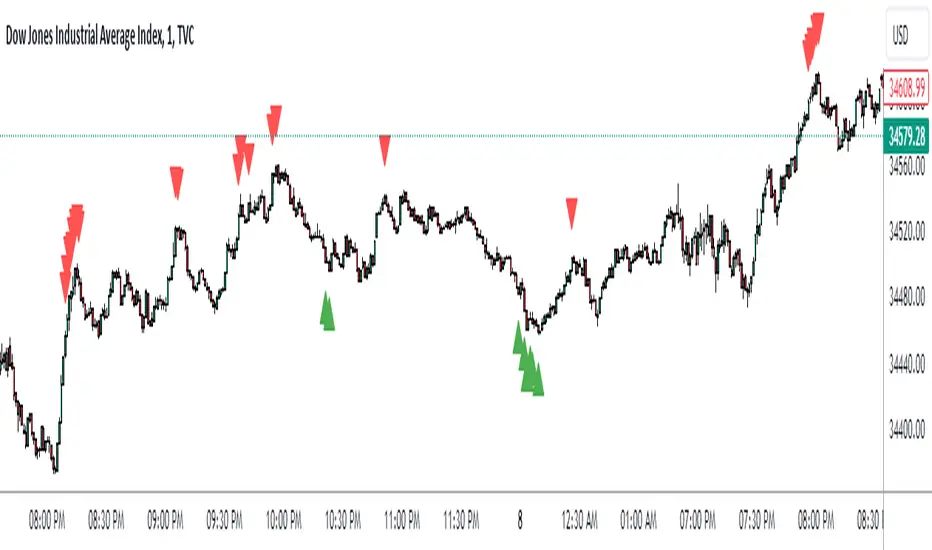
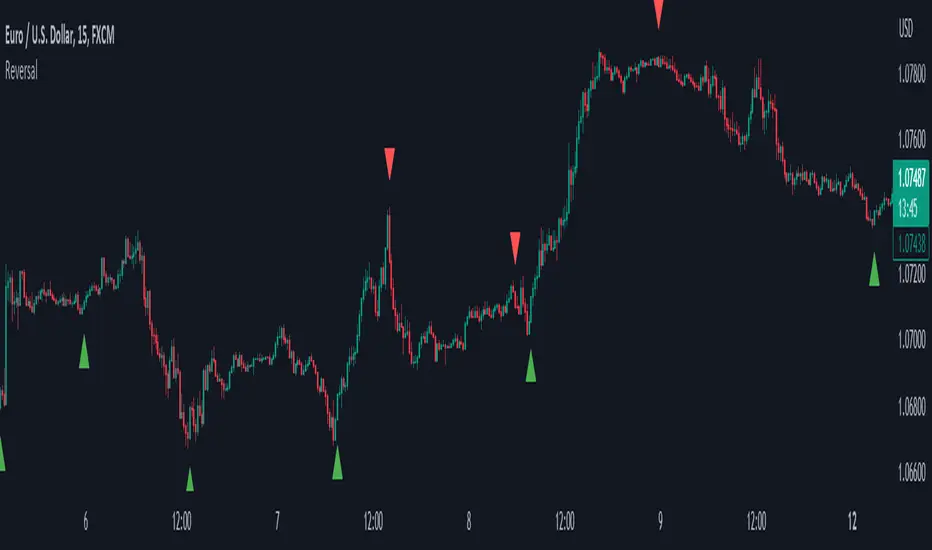
ReversalThe primary objective of this indicator is to discern candles that exhibit characteristics suggestive of potential market reversals through the application of candlestick analysis. Extensive observation across various assets and timeframes has revealed the existence of a recurrent reversal pattern. This pattern typically manifests as a sequence of one to three candles that abruptly diverge from the prevailing price action or trend, offering a distinctive signal indicating a potential reversal.
By leveraging the insights gained from this observation, the indicator aims to assist traders in identifying these noteworthy candle patterns that hold the potential to indicate significant market shifts.
The indicator operates as follows: initially, it identifies the lowest close (in the case of a bullish reversal) or the highest close (in the case of a bearish reversal) within a specified number of previous candles, as determined by user input (referred to as "Candle Lookback").
Next, the indicator examines whether the closing price surpasses the high of the previously identified lowest (bullish reversal) or highest (bearish reversal) closed candle within a designated number of candles, as specified by the user (referred to as "Confirm Within").
Liquidity Channel with B/SIndicator - Liquidity Level
Which calculates the liquidity levels based on the highest high and lowest low of the specified period. It determines the middle line, upper line, and lower line of the liquidity channel. The liquidity level is the average of the upper and lower lines, and the liquidity level distance is half of the difference between the upper and lower lines.
Here, the code determines if the conditions for overbought and oversold signals are met. It compares the current closing price with the previous opening price to determine the color of the bar (red or green). If the conditions are met and the bar color matches the expected direction (red for overbought and green for oversold), the respective signals are triggered.
The code plots buy and sell signals on the chart using shape labels. It displays "Buy" labels below the bars for buy signals and "Sell" labels above the bars for sell signals. Additionally, it colors the bars in gray. The code also sets up alert conditions to send notifications when buy or sell signals occur.
*************** Please note that this is a high-level overview of the code's functionality. The specific details and calculations may vary based on the parameters and settings provided in the code.
*************** Remember, trading involves risks, and it's important to thoroughly test any strategy and consider risk management principles before using it in live trading. It's recommended to consult with a knowledgeable financial advisor or professional trader for guidance and assistance in developing and implementing trading strategies.
***************Happy trading..
I will try to share my most commonly used strategies with you as much as possible. For this, you can follow me as a source of motivation, and if you like the indicators, you can give me a rocket to make me happy, my friends! :))

D-BoT Alpha ReversalsHello traders, today I'm going to share with you a strategy that I use very frequently. I wanted to share this strategy that I use in my manual trades by translating it into code. I'm sharing it with you with completely open source code.
RSI of ROC: The indicator initially calculates RSI (Relative Strength Index) on ROC (Rate of Change). This is a method that tracks the rate of price change (ROC) over a certain period and applies it to the RSI calculation.
Adaptive RSI: The code then calculates the RSI for all periods between the minimum and maximum RSI lengths. It takes the average of these calculations and names it as avg_rsi66. In addition, it checks whether each RSI value exceeds the determined overbought and oversold limits.
Signal Triggers: If both RSI of ROC and avg_rsi66 are above or below the specified overbought or oversold levels and the difference between these two values is less than the specified threshold value (Extremities Sensitivity), a signal is triggered. In addition, the color of the bar is also checked: An overbought (sell) signal is triggered for a red bar and an oversold (buy) signal is triggered for a green bar.
Signal Visualization: Signals are shown on the chart at appropriate places with "Sell" or "Buy" shapes. Also, each of these conditions is defined as an alert condition.
The general purpose of this indicator is to determine the turning points of the market. Overbought and oversold signals are based on the idea that the price may turn from these areas. That is, a "Sell" signal indicates a turning point where the price may start to fall, while a "Buy" signal indicates a turning point where the price may start to rise.
These types of indicators usually have some weak points:
False Signals: Like any kind of technical analysis indicator, this indicator can also give false signals. That is, you may get a "Buy" or "Sell" signal but the price may not move in the expected direction.
Market Conditions: This indicator may perform better under certain market conditions. For example, a trend-following indicator usually works well in trending markets, but can be misleading in range-bound markets. This indicator too can perform better or worse in a particular market situation.
Parameter Selection: The choice of the parameters of the indicator (ROC and RSI lengths, overbought/oversold levels, etc.) can significantly affect the quality of the indicator signals. Parameters should be optimized for various assets and time frames.
In conclusion, it would be better to use this indicator not as a standalone trading system, but in conjunction with other technical analysis tools or fundamental analysis. Also, it is always beneficial to test a new trading strategy on past data or on a demo account before trading with real money."
Stay tuned for more of my original strategies :)
Happy trading...

Reversal Points [CC]This original script was created based on a suggestion from @kerpiciwuasile. My original Reversal Points script was removed because I modeled it after an indicator by Demark, but this script will have no such issues. Reversal points are an exciting concept for me because it is such a useful tool when placing trades. This is my first attempt at a new overall layout for my script and I included a bunch of customization so let me know what you think.
My script works by finding lows that are surrounded by bars that have higher lows and highs that are surrounded by lower highs. I use this logic to find short term lows or highs and I use the same concept to find mid-term lows or highs but a mid-term high is a short term high surrounded by lower short term highs and a mid-term low is a short term low surrounded by higher short term lows. And of course this means that long term highs or lows use the same logic to find highs or lows that are surrounded by mid-term highs or lows. I would recommend to buy at the long term low points or sell at the long term high points.
Keep in mind of course that short term highs and lows are very common and reversal points will get rarer as you look for longer term reversal points. I would recommend to experiment and see which reversal points work best for you and of course, know that there is no magical formula to use for all stocks.
Also there are a few scenarios where you want to enable or disable the inside bar setting. You would want to ignore inside bars if the market is currently very volatile or if you are using this indicator on a crypto chart. This is not an exact science but more of a recommendation, so feel free to experiment with it.
Reversal points are crucial for traders as they signal a potential change in the market trend, providing opportunities for entry or exit.
In summary, this code snippet is a powerful tool for traders to detect and visualize reversal points on a trading chart, providing valuable insights into potential trend changes and facilitating more informed trading decisions.
Let me know if you would like me to publish other scripts or if you want me to do something custom for you!

Triple RSI strategyThis strategy is commonly used both in forex and stock markets for reversal trading. when the rsi line reaches and crosses simultaneously at 3 rsi setups i.e at 7, 14, and 21, a signal is generated.
This strategy works best in 1-hour timeframe. It provides over 60 to 80 percent accuracy in 1-hour timeframe.
In the stock market, this strategy provides an excellent entry point, if one is seeking small profits.
One can expect to make around 10 to 50 pips in the forex market easily. However, I advise seeking support from price action from the lower timeframe in the forex market.
I hope you like it.
Follow for more strategies and scripts like this.

RSI MTF Ob+OsHello Traders,
This indicator use the same concept as my previous indicator "CCI MTF Ob+Os".
It is a simple "Relative Strength Index" ( RSI ) indicator with multi-timeframe (MTF) overbought and oversold level.
It can detect overbought and oversold level up to 5 timeframes, which help traders spot potential reversal point more easily.
There are options to select 1-5 timeframes to detect overbought and oversold.
Aqua Background is "Oversold" , looking for "Long".
Orange Background is "Overbought" , looking for "Short".
Have fun :)

CCI MTF Ob+OsHello Traders,
This is a simple Commodity Channel Index (CCI) indicator with multi-timeframe (MTF) overbought and oversold level.
It can detect overbought and oversold level up to 5 timeframes, which help traders spot potential reversal point more easily.
There are options to select 1-5 timeframes to detect overbought and oversold.
Green Background is "Oversold" , looking for "Long".
Red Background is "Overbought" , looking for "Short".
Have fun :)

Reversal zone finderThis script would find potential reversal price zones according to RSI over bought or sell condition and big reversal candle.
It works better in range markets and lower time frames like 5M and especially in Support/Resistance zones.
Suit for scalping in forex or crypto markets.
* Use it as a trade assistant not a trade signal!

Trend Bounce [racer8]I discovered this mechanical trading system titled "This Algo Strategy Has Only 3 rules and 62% Win Rate".
I coded the trading system on Tradingview...and now I am introducing it to you guys.
I modified the system so that it has both buy & sell signals.
I've tested it repeatedly in different markets on TV including stocks, currency pairs, bitcoin, and commodities...and it works!
A buy signal is generated whenever the current close is below the previous 7-day low and the current close is above the 200 period moving average.
A sell signal is generated whenever the current close is above the previous 7-day high and the current close is below the 200 period moving average.
The system also has a 2-ATR stop loss which I coded.
This system is unique in that it has both trend-following and reversal elements in it.
The system trades short-term reversals while obeying the long-term trend.
Essentially, you are buying the dips of bullish trends! & selling at the peaks of bearish trends!
Enjoy ♡

