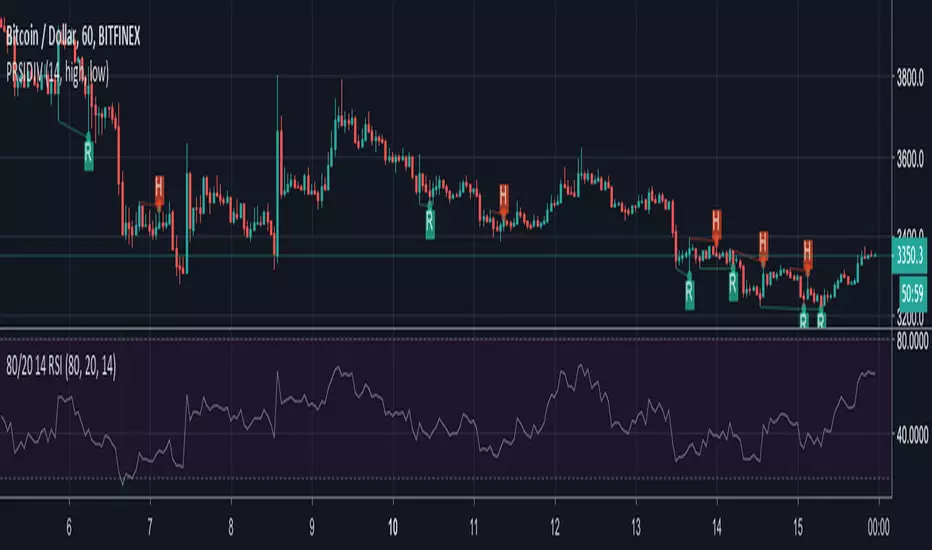
Prices / RSI divergences detectorPrices / RSI divergences detector.
Display both hidden and regular divergences.
I used it with my own RSI indicator. You can find the script here:
Rsi_divergence
RSI Divergence UltimateHere it is Everyone - What was once hidden is now revealed
This is the Ultimate RSI Divergence Indicator
Not only does it plot Regular and Hidden Divergence lines for an RSI smoothed by an EMA and for its Signal Line
The RSI can be set to change color with direction or can be set as single color with or with out OB / OS highlights
Color Changing RSI helps when trading Multiple Time Frames as you can look for confluence in the direction of RSI
Included options for the Signal Line include;
Various calculations EMA, SMA and Linear Regression which provides very accurate signal line crossover signals
Color Changing with direction
Second RSI with different Length
Multi Time Frame RSI
Bollinger Bands applied to the RSI
RSI Stochastic that has been compressed to fit into RSI OB / OS so that it doesnt compress the RSI when in these regions
There are also Background Highlights (thanks to Chris Moody) for when the RSI Stochastic moves into OB / OS and crosses its signal line
There are plenty of Alerts for signals with more complex alerts coming soon
I have also added Hima Reddy's Power Zones for support and resistance so now you can also
Take full advantage of trading; signal line crosses, 50 crosses and Power Zone RSI support and resistance and much more
The divergence script is thanks to @RicardoSantos, I've just adjusted it to suite my indicator
Remember that divergences work best when traded with the trend or very late in a trend when going against the trend

RSI Reader DARK THEMERSI reader is an ADD-ON -184.95% of the indicator Market-Reader (available in TV too)
It will detect:
- bullish and bearish divergence
- bullish and bearish cycle on RSI
-When RSI is ready for an acceleration meaning that a significant bull or bear move can occur soon
It is also a RSI with less noise offering a more accurate analysis of the market without adding lag.
This Add-on -184.95% is Free for all user of the indicator Market-Reader.
This script will be continuously update
Access requires subscription (contact by MP 1.50% )

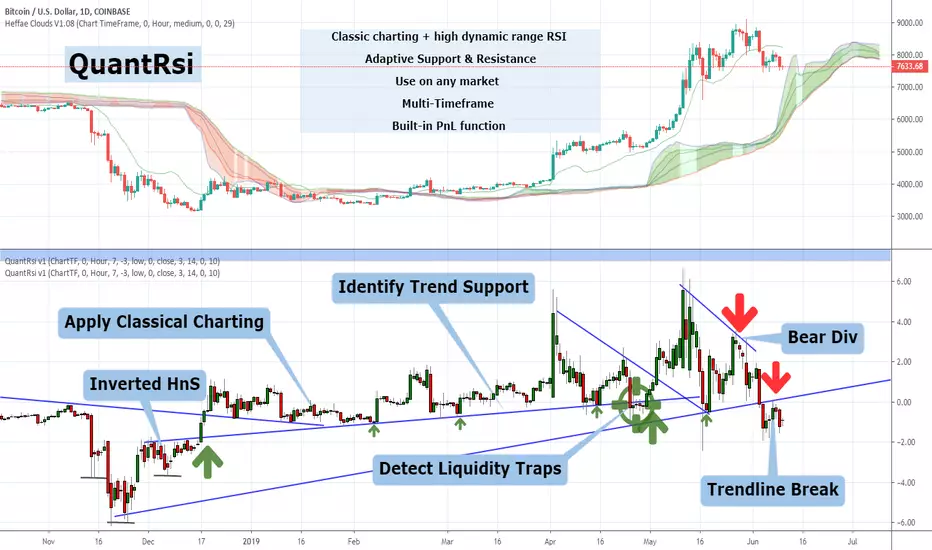
QuantRsi - Quantized Relative Strength Index - SNOW_CITY QuantRsi is a Relative Strength Indicator designed to improve on RSI's divergence confirmation. QuantRsi also functions as an entirely new type of range-bound oscillator, enabling "Hybrid TA" - the study and use of drawing tools on candles painted by the indicator.
QuantRsi paints full OHLC candles by default - displaying the full range of each candle's movement.
This tool sets out to accomplish:
Confirmation of divergence with a 3-anchor trading system
Show key price levels as whole numbers "quantized" from a scale of -10 to + 10; as well as commonly revisited levels within a trend
Anticipate divergence & turning points by charting on the indicator candles - trendlines can be drawn on indicator print - "Hybrid TA"
The result is an indicator able to process nonlinear price movements and draw range-bound candles with peaks and troughs that form repeating collisions with common tangents. QRsi illustrates trends and trend violations in a market with the advantage of behaving like a leading indicator. QRsi possesses a supreme ability to show divergence and confirm reversals/ turning points.
The dynamics of the vertical scale allows the formation of linear trends on the oscillator which classical charting can be applied. The support and resistance values for an asset will follow consistent incidents upon a tangent while the market is trending.
When a trend is violated, the break-up or break-down of price will revisit prior incidents both on frequented horizontal levels ("-1.4" or "+5.0") as well as tangent lines drawn from prior reversal points. Prior, violated trend-lines can be used as anchor points for a new linear trend - establishing a hypothetical market range before price moves into these hidden divergence zones.
Much like RSI, the extremes of a QRsi range (whether that be +/- 7,10 or the trend-established reversal value) are not always indicated turning points. Divergence does not occur at every turning point, but it does occur at most significant turning points.
Unlike RSI, QRsi adds the ability to visualize turning points outside divergence by drawing a trendline from prior turning points to the next anticipated turning point.
QRsi enables an asset to express it's price range within a flexible scale for that trend. The scaling has a higher dynamic range than classic RSI, at the expense of not filling the entire range of the oscillator at all times. An asset's highest and lowest trending values should be established by observation of prior visited values, not by the borders of the oscillator's range.
In the main chart example, trend-lines are drawn on the QuantRsi indicator for ETH/USD - Bitfinex 4H
Here is the same chart with notation:
The dashed trend-lines represent trends that have not been established yet. They turn solid when they have a second anchor(in primary chart).
Trendline violations create anchor points for new trendlines
Turning points with and without divergence depend entirely on asset's prior QRsi values, relative on relative.
In the above chart, Qrsi Value "2" is a common reversal value. In the chart period that is shown, selloff ensues shortly after QRsi reaches 2.
QRsi Values range from -10 to + 10. The boundaries represent the extremes of anticipated market range for that timeframe. Unlike traditional RSI, it is rare that an asset will range from the lowest to the highest boundaries. Instead, common values for that asset are observed by studying historical price data. A lower and upper range is established based on historical trends. When these values are hit, it represents an anchor for divergence. You will find that reversals can occur on the +/- 3, 5, 7 and 10 values frequently, although, this is indication without confirmation.
Depending on the timeframe and asset, the common turning point for an asset may be -2 & +5, with outliers to -5 & +7; or it may be -1.4 & +6.5 for an uptrending asset. The horizontal +/- QRsi values which turning points are likely to occur need to be established by studying the asset and verified by divergence or trend incident.
Confirmation is gained by observing the 3-anchor trading system:
1: Divergence - Locally
2: Trend incident or violation - charted patterns, linear ascending or descending trendlines.
3: Horizontal value incident
In the chart below, common horizontal turning points, divergence, and trendline violation are used as indicators for trading.
Observe how the same horizontal levels are visited as support and resistance depending on the direction of the trend prior to visiting that level.
Note how there are 2 coincidences of Trend / Horizontal / Divergence for most of the indicated trades:
This is the same chart, but with trades shown on the price chart as well as the QRsi chart:
And a simplified view of the same chart with Heffae Clouds enabled:
Notice how once a horizontal level is violated, it is often revisited which confirms it's role-change from S to R or R to S.
Weekly chart showing horizontal support level on lows, and divs for 4 prior All-Time-High's
Example of drawing a trend-line on QRsi and setting up a trade based off of a trend incident:
In the above example, the first two incidents are used as anchor points to reference where the third incident might occur.
In this case, you would have all 3 anchors, and a very successful trade with conformation of a proper entry prior to taking the trade.
Example of using a trend-line to set up trade continuation after divergence prints:
Example of how horizontal levels or ranges can be revisited after much time has passed. This also displays how divergences are used with horizontal levels to establish confidence in a trade:
Example of how QRsi values establish future support / resistance value ranges. Candle-wick sets future lower range:
Example of horizontal levels and divergence:
And, a drawing-free chart of QRsi with Heffae Clouds on BTCUSD Dec 2017 - Nov 2018 - Imagine your own TA on the QRsi.
SETTINGS:
TimeFrame settings:
"ChartTF" follows your chart's selected resolution / TimeFrame
"Non-Chart TimeFrame" is an integer for your custom TimeFrame, the setting below:
"Non-Chart TimeFrame" selects "Minutes, Hours, Days" that corresponds to the above setting for a custom TimeFrame.
Visual Settings:
"Show QuantRSI As Candles" - Toggle this to change from candlesticks to a simplified line. The line's value is determined by "Input for Stochastic" below
"Show Stoch QRSI" - Toggle this to switch to a Stochastic Rsi based off of the QRsi.
"Show Price Per 1.0" - Toggle this to see the range value, in chart denomination (USD,GBP,BTC,JPY) for each 1.0 step in the QRsi range for that timeframe. See this example:
The Quantization range values can be displayed by checking the box in settings "Show value per 1.0"
This will paint a colorless line and display the price value in the indicator's data window. You can calculate the rough price difference to any local value in QRsi by multiplying "value per 1.0" by the expected change in QRsi value.
Configuration Settings:
"Trend Bias" - Experimental setting for different asset classes and market conditions. Changes QRsi bias. Experiment with this on shorter timeframes. Leave on "low" unless you have established that different settings work better for a particular asset.
"Quant Preset" - This is similar to "Path Fitting Preset" on Heffae Clouds. Adjust this to print higher validity patterns on different assets.
The conformation that this setting is adjusted properly for your asset will be evident by backtesting the QRsi. BTC = 0 ETH / FOREX = 1 & 2
Experiment with this, as it adjusts the path-finding algo in order to paint valid patterns. The maths are too complex to integrate a single numerical adjustment, hence the preset.
"Upper/Lower Bounds" - This adjusts scaling and thresholds. Experimental only at this time. Use in conjunction with "Range Multiplier"
"Boundaries" - This adjusts the beginning of the shaded area on the top and bottom of the oscillator. Adjust this to a particular value instead of drawing a trendline on the value of interest. I added this because the shaded areas are easier to see on mobile than a trendline .
"Stochastic Short" - Adjust the length of Stochastic RSI SMA's
"Stochastic Long" - Adjust the length of Stochastic RSI SMA's
"Input for Stochastic" - Select the price source for Stoic & QRsi simplified line.
"Range Multiplier" - This amplifies the QRsi input to occupy a larger or smaller range within the oscillator boundaries. Experimental only at this time. Use in conjunction with "Upper/Lower Bounds". Very fun to play with.
That's all for now! I will do my best to keep this updated with new features / capabilities, as well as continuing to provide use examples and education for my indicators.
If there is a feature you would like, question answered, or a bug, please post in the SNOW_CITY Indicators Chat:
www.tradingview.com
Educational content will be posted here:
aedictiveanalytics.wordpress.com
Please see this pastebin link for access information and links:
pastebin.com
CDC RSI Divergence Strategy for Bitcoin ( by inwCoin )This strategy is based on CDC RSI Divergence indicator ( www.chaloke.com )
Also some code from CTC R-Breaker strategy ( ctc.in.th )
For best result, using 1 H timeframe.
I tried backtest at Bitmex ( XBTUSD ) Bitfinex ( BTCUSD ), OKex ( BTCUSD3M ) and it result is ok.

TREND REVERSAL DETECTOR TR detector: Trade with the trend not against it. This indicator will warn you in advance before the market changes its direction.

WIZARD DETECTOR STOCH/RSI DIVERGENCEStochastic RSI Divergence Detector
Short and Long time frames
Alert System

[IE] Multiple price indicators + SCALPERDetect divergences in price and RSI + pivot points (with alert option). Credits to @Libertus for this, I only reproduced it and after that he pointed me to his work.
Has ChartVamp and EricChoe MAs with prediction.
Displays Support and Resistance areas
Detects momentum changes.
Custom scalper with alert option.

Librehash RSI FilterLo and behold, this is the Zero_n0ncense RSI Filter. This filter is designed to be plugged in as a regular RSI(14), but it provides buy and sell signals as well.
There isn't much more to this indicator than that. If extra documentation is requested by the community, I'll be more than happy to provide such.
Otherwise, this indicator is pretty straightforward in nature.
If you're interested in purchasing, let me know! Thank you guys.

Merge Of RSI & Stochastic RSI [salar88]This Indicator Include Stochastic RSI And Multiple Time Frame RSI
I Wish Its gonna useful for tradingview users

RSI MACD with conditional MA indicator backtestingbacktesting for the RSI MACD with conditional MA indicator:
Relative Strength Index - Divergences - LibertusHello all,
To ease everyone's trading experience I made this script which colors RSI overbought and oversold conditions and as a bonus displays bullish or bearish divergences in last 50 candles (by default, you can change it).
Script is open source, part of code is from Trading View examples. If you have suggestions or you already made some improvements, please report in comment.
Happy trading and good luck!

Oscillator Divergence HistogramIdentify Divergences on 6 oscillators simultaneously.
From the bottom up.
0 to 1 (black): MACD
1 to 2 (green): Elders Force Index
2 to 3 (blue): RSI
3 to 4 (purple): Awesome Oscillator
4 to 5 (red): Commodity channel index
5 to 6 (orange): Stochastic
You can change the identification of the divergence in the settings and use the Oscillator Divergences indicator to visually see them when testing.
This detects the following divergences between price and the oscillator.
Regular Bullish Divergence: Price lower low | Oscillator higher low
Regular Bearish Divergence: Price higher high | Oscillator lower high
Hidden Bullish Divergence: Price higher low | Oscillator lower low
Hidden Bearish Divergence: Price lower high | Oscillator higher high
Early warning alert system. This identifies a developing divergence and can be used to set alerts.
Colors
Bearish: Maroon
Bullish: Green
Hidden Bearish: Light brown
Hidden Bullish: Light green
Developing early warning are lighter shades of the above.

RSI Divergence Smoothed with Signal Line and Power ZonesThis Indicator plots Regular and Hidden Divergences lines for an RSI smoothed by an EMA and for its Signal Line
The RSI can be set to change colour with direction or can be set as single colour
Colour Changing RSI helps when trading Multiple Timeframes as you can look for confluence in the direction of RSI
The divergence script is thanks to @RicardoSantos, I've just adjusted it to suite my indicator
Remember that divergences work best when traded with the trend or very late in a trend when going against the trend
I have also added a Colour Changing Signal Line & Hima Reddy's Power Zones so now you can also
Take full advantage of trading; signal line crosses, 50 crosses and Power Zone RSI support and resistance

Multi Divergence OverlayThis Indicator overlays Divergences lines on the chart for a Smoothed RSI an RSI Signal Line and 2 Stochastics
You can also choose to overlay Divergence lines from 1 Other Indicator on Your Page as the source
The Colors and Labels match my other Divergence Indicators
The divergence script is thanks to @RicardoSantos, I've just adjusted it to suite my indicator
Remember that divergences work best when traded with the trend or very late in a trend when going against the trend

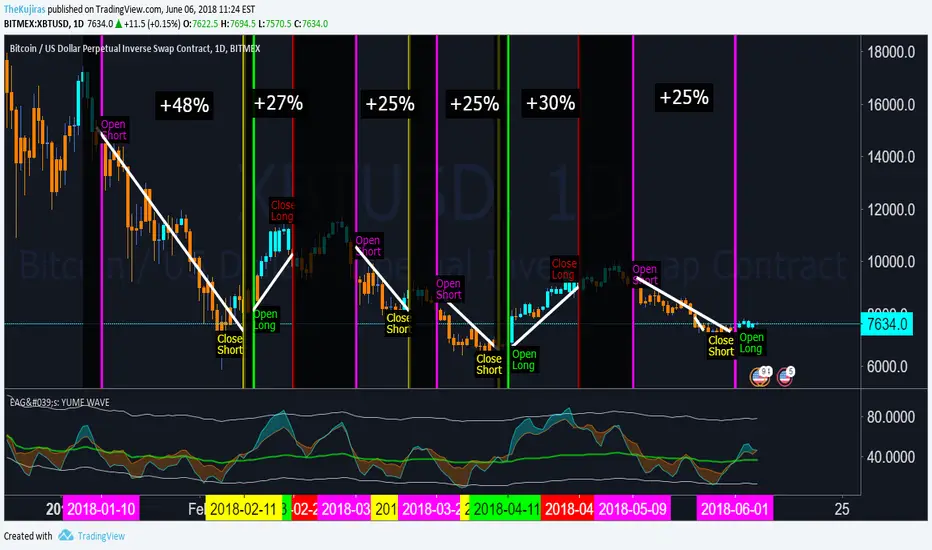
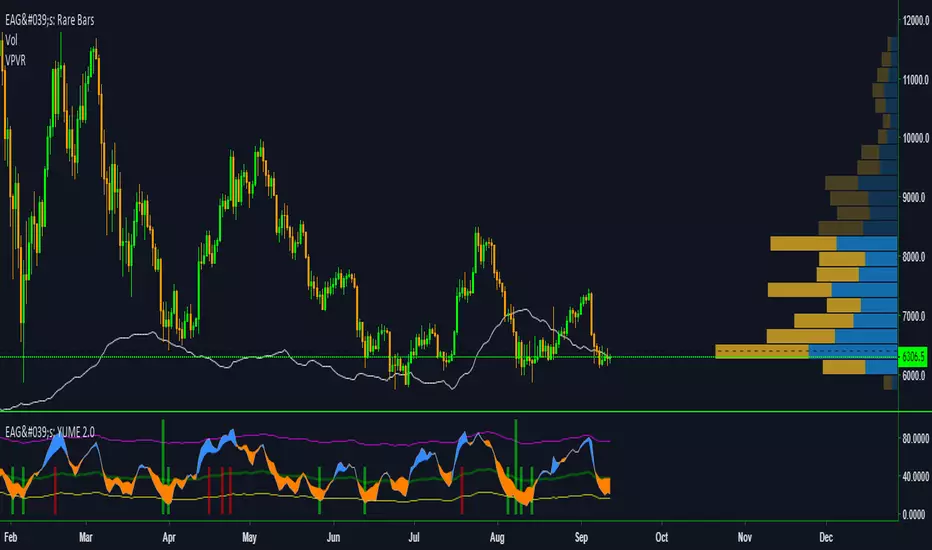
EdgeAnalysisGroup: Yume Wave 2.0This is a upgraded version of the wave with modified parameters for a higher success rate. 3 New Lengths and 75 more lines of code added to the overall algorithm. Also included are 2 sublevel signals based on the Fib MA and pattern trading.
The Wave:
+ The Yume is the Fast length
+ The Akume is the Slow length
+ The Miaku is a median weighted length
+ The Upper Limit is an overbought asset indication
+ The Lower Limit is an oversold asset indication
+ The Wave is the spread between Yume and Miaku
Bullish Indications:
+ The Yume is above the Akume
+ The Yume is above the Miaku
+ The Yume is below the Lower Limit
Bearish Indications:
+ The Yume is below the Akume
+ The Yume is below the Miaku
+ The Yume is above the Upper Limit
Signal Strength Weights:
+ 50 = Yume Wave crossed a Limit Line
+ 100 = Yume Wave crossed a Limit Line + Close to a Fib Moving Average
+ 100 = Edge's Market Bottom/Top Algorithm is marked 'True'
Setting up Signals (Based on a 100 Signal Height):
+ Set the "Bull Signal" to be at 50 or 100
+ Set the "Bear Signal" to be at 50 or 100
+ 50 is Agressive, 100 is Conservative.
+ Bull/Bear are separate so you can play conservative bull with aggressive bear.
TTM Apollo 11 RSIColor coded RSI to give a better indication of when to buy or sell based on the RSI level along with an included EMA signal to help describe the trend.
Cyatophilum Golden X - RSI [INDICATOR] [ALERT SETUP]This indicator is a custom combo of Ema crosses, RSI divergences and Support/resistance, designed to make the most profit possible.
It is a pretty solid indicator for trading BTC in 4H.
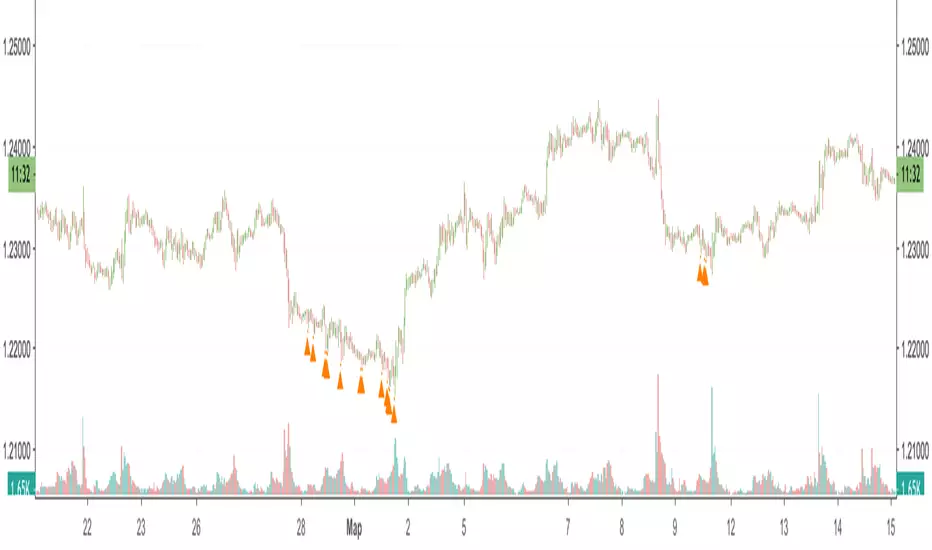
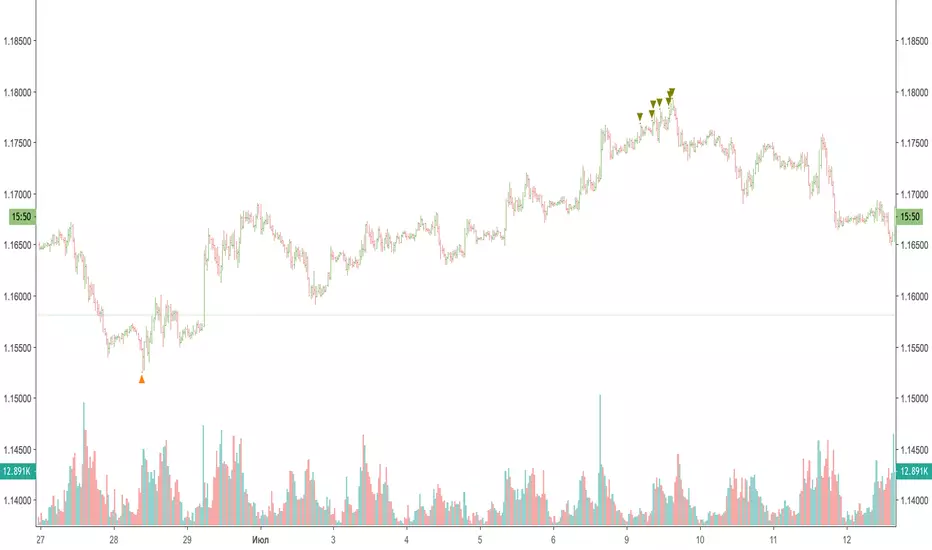
There are two kind of buy signals : Green and Blue triangles, that are two great Buy/Long entries.
There are also two kind of sell signals: Red and Orange triangles, that are two great Sell/Short entries.
The indicator comes with automatic Alerts that trigger on Green and Blue triangles for a Buy Alert, or that trigger on Red and Orange triangles for a Sell Alert.
If you are interested in purchasing the indicator and want to try it, then please leave a comment.
A strategy version should follow on my profile soon.
-----------------------------------------------------------------------------------------
I am also available for PineScript Development and Reverse Engineering.
Join my discord:
discord.gg

RSI/MFI - MTF - Entry signals/Trend colored bars - JD@version=2
This indicator is designed to give early entry signals as well as to follow trend moves, according to different settings.
The indicator shows a histogram of the RSI ro MFI in relation to an ema of the RSI or MFI.
The histogram is then smoothed to give early reversal/entry signals.
The actual RSI/MFI line with oversold/overbought indication can be displayed or omitted, as preferred.
in addition to the RSI/MFI line or as an alternative to it, the background colour can be set to change folowing the RSI/MFI signals.
The timeframe can be chosen. Higher timeframes (eg. 3h) tend to give less false signals.
version 5.
added support for custom Multiple Time Frame selection.
added option for choice of RSI or MFI as base indicator.
added option for price bar coloring according to the indicator. (deselecting "borders" in the "style" tab is recommended)
price bar coloring can be adjusted for different strategies:
1. following the slope of the histogram (for faster entry/exit signals)
2. according to positive or negative histogram (for longer moves)
3. according to pos. or neg. RSI/MFI (for longer term trend holds)
4. uptrend: biased towards faster buy signals and slower sell signals to stay in the uptrend
5. downtrend: biased towards faster sell signals and slower buy signals to stay in the downtrend
A longer timeframe (eg. 3x) is recommended for following trend moves.
try different strategies to see what works better for RSI or MFI.
JD.

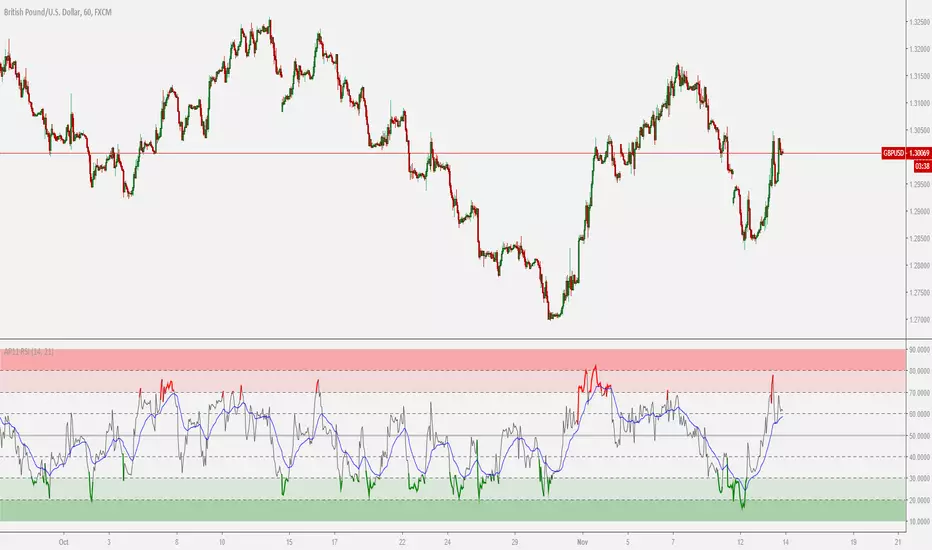
RSI Swing SignalThis indicator is a tool designed to be used with Steven Hart's RSI Exhaustion strategy. For more information google TheTradingChannel or look him up on YouTube :)
The default RSI settings for this strategy are:
RSI Overbought: 80
RSI Oversold: 20
Length: 7
When the RSI gets above 80, the line will turn red and the script will begin looking for a specific type of engulfing candle to go short. The same is true when the RSI gets below 20, but the line will turn green and look for longs. It is best used as a back-testing aid, but it can also be used to send emails or SMS alerts whenever the conditions are met. It can also be used as an alternative colored RSI indicator by removing the signals in the settings menu and changing the RSI parameters to whatever you normally use. This can aid in RSI divergence and overbought/sold strategies.
Entries:
The bright green and bright red lines represent the first type of engulfing candle.
The dark green and red lines represent the second type of engulfing candle.
Some pairs perform best with only one of these entries, while others work fine with both.
This is a counter-trend or consolidation strategy, and is best used in combination with trend-continuation or trend-following strategies. As always, make sure you back-test it before you use it to trade as it works better on some pairs than others.

EdgeAnalysisGroup: Yume WaveDONATIONS APPRECIATED
--------------------------------
ETH: 0x862E6C54397Cf681887136472d5F16cCA22C80Fe
BTC: 16wnhEyNB5zx7ErwNi5KyszNeHhtjH2syx
ABOUT
-----------------
Yume (aqua line) is a modified high moving average of RSI
Akume (orange line) is a modified low moving average of RSI
Miaku line (green line) is a variable median line that determines market outlook
Nami is the wave (aka: cloud) that the Yume Akume lines create.
BAR COLORS are based on market sentiment using volume + price action to determine the overall health of the market and probable direction.
MODERATE RISK STRATEGY
-----------------
Bullish Long indicator:
Yume crossing above Akume over the Miaku Line (aqua wave twist)
Close Long Indicator:
Akume crosses above Yume over the Miaku Line (orange wave twist)
Bearish Short indicator:
Akume crossing above Yume under the Miaku Line (orange wave twist)
Close Short Indicator:
YUME crosses above Akume under the Miaku Line (aqua wave twist)
-----------------
DONATIONS APPRECIATED:
ETH: 0x862E6C54397Cf681887136472d5F16cCA22C80Fe
BTC: 16wnhEyNB5zx7ErwNi5KyszNeHhtjH2syx