BNBUSD 1 Minute Chart / 1 Hour BBand Day Trading 3Commas*** As always, this is provided for educational purposes only and I am not an investment advisor; I'm just a guy who likes to come up with novel ideas and share them with other traders so they can learn. ***
This strategy is a fun one. I took parts of 'Bollinger Awesome Alert R1 by JustUncleL' () and modified it to have enhanced day trading functionality. This version does not show source and that is by design - I want the alerts to be visible to the public and if you want to get set up with a version that integrates with 3commas, drop me a message - there's a lot more that goes into setting up automated 3commas trading but this script was written specifically with 3commas in mind.
It's possible this is one of the more interesting strategy indicators I've made. The setup I used for this is as such and you will need to set it up the same way:
One minute chart for the BNB/USD(T) pair on Binance.us (other exchanges will likely work, other coin pairs or other time frames will likely not)
This script watches the one minute chart and when price golden crosses the lower Bollinger band, a buy order is placed.
There are two sell conditions; one I set up to take profit and one I designed as a kind of stop loss. I went with a flat 7.5% for the take profit as this showed the best results in the backtester. I had planned for it to be closer to 3% but for this strategy to work it needs to be higher. According to the backtest it offers around double the return of buying and holding BNB over the sample timeframe.
The 'stop loss' condition is where the fun lies. I transposed Bollinger bands from a one hour BNBUSD Binance.us chart on top of the 1 minute chart and those are the blue lines you see. The stop loss condition happens when the current price death crosses the bottom one hour Bollinger band. Ironically, often this doesn't result in any losses as you will see in the chart and instead results in a small win. This definitely was not my intention when I created it but it's a lot better than the earlier version where I set up a variable percentage-based stop loss. Even with me optimizing the regular stop loss for this coin pair, my 1 hour bband method nets an extra 2% profit over the same two week time period, even with Binance fees factored in!
Have fun and like I said, hmu via message if you want access to the customizable indicator for 3commas!
Scalping

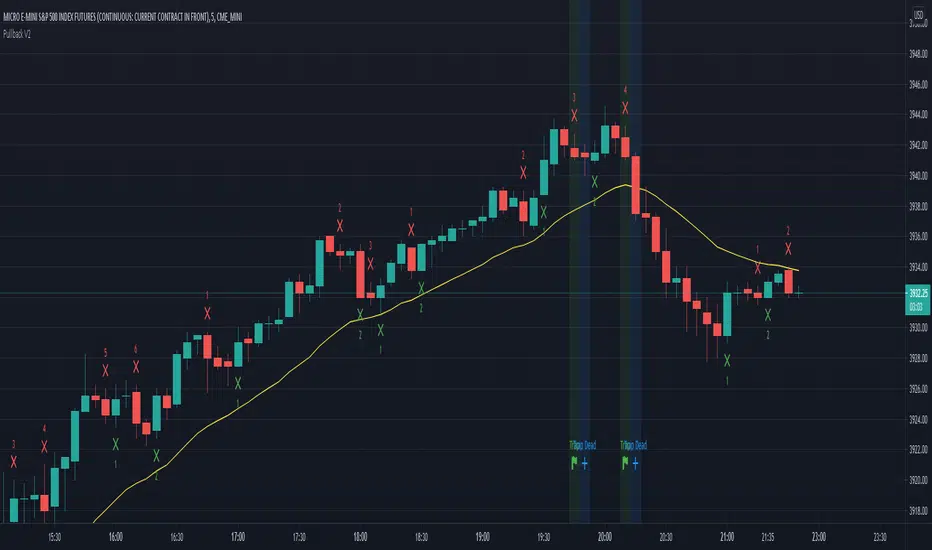
Pullback Traps v. 0.1Trading Strategy for scalping the CME_MINI:ES1! and CME_MINI:MES1! futures on the 5 min. time frame.
The strategy will count legs and look for failed pullbacks and failed second entries where shorters get trapped.
How to use:
When a trap occurs (Marked with green light) place an order one tick above the high of the trap and enter on next candle
If entry doesn't happen on next candle and it has a lower high, move entry to one tick above high of that candle.
Keep doing the above until you enter or until a candle is marked with a blue light and the text Trap Dead.
If you see Trap dead and you haven't entered, quickly cancel your order.
What is green light?
A second or later pullback down away from the uptrend. When the green light is present the shorters haven't made a 1 point profit and short scalpers are trapped.
What is blue light?
1. Shorters made their 1 point profit and trap is dead. Cancel your trade. Or...
2. Shorters hit their stop loss and you're probably in a trade now and about to profit.
Profit and stop loss:
Numbers are done with profit 5 ticks and stop loss 30 ticks.
Should I have a stop loss 6 times greater than profit?
Probably not. The numbers you see here are made with these profit and stop loss figures but I don't advice it in real trading.
The numbers look good on this backtest but in reality a few bad trades would ruin everything.
This was made purely for fun and sim trading - Feel free to do your own testing and show the resulsts.
Momentum Strategy (BTC/USDT; 1h) - MACD (with source code)Good morning traders.
It's been a while from my last publication of a strategy and today I want to share with you this small piece of script that showed quite interesting result across bitcoin and other altcoins.
The macd indicator is an indicator built on the difference between a fast moving average and a slow moving average: this difference is generally plottted with a blue line while the orange line is simply a moving average computed on this difference.
Usually this indicator is used in technical analysis for getting signals of buy and sell respectively when the macd crosses above or under its moving average: it means that the distance of the fast moving average (the most responsive one) from the slower one is getting lower than what it-used-to-be in the period considered: this could anticipate a cross of the two moving averages and you want to anticipate this potential trend reversal by opening a long position
Of course the workflow is specularly the same for opening short positions (or closing long positions)
What this strategy does is simply considering the moving average computed on macd and applying a linear regression on it: in this way, even though the signal can be sligthly delayed, you reduce noise plotting a smooth curve.
Then, it simply checks the maximums and the minimums of this curve detecting whenever the changes of the values start to be negative or positive, so it opens a short position (closes long) on the maximum on this curve and it opens a long position (closes short) on the minimum.
Of course, I set an option for using this strategy in a conventional way working on the crosses between macd and its moving average. Alternatively you can use this workflow if you prefer.
In conclusion, you can use a tons of moving averages: I made a function in pine in order to allw you to use any moving average you want for the two moving averages on which the macd is based or for the moving average computed on the macd
PLEASE, BE AWARE THAT THIS TRADING STRATEGY DOES NOT GUARANTEE ANY KIND OF SUCCESS IN ADVANCE. YOU ARE THE ONE AND ONLY RESPONSIBLE OF YOUR OWN DECISIONS, I DON'T TAKE ANY RESPONSIBILITY ASSOCIATED WITH THEM. IF YOU RUN THIS STRATEGY YOU ACCEPT THE POSSIBILITY OF LOOSING MONEY, ALL OF MY PUBBLICATIONS ARE SUPPOSED TO BE JUST FOR EDUCATIONAL PURPOSES.
IT IS AT YOUR OWN RISK WHETHER TO USE IT OR NOT
But if you make money out of this, please consider to buy me a beer 😜
Happy Trading!

Cyatophilum Strategy BuilderAn indicator to create strategies, backtest and setup alerts.
The user can choose one or multiple TA entry conditions, if more than one the conditions are combined with a logical AND.
The entries will open up a trade, which is then handled by a risk management system including Trailing Stop, Take Profit and up to 100 Safety Orders.
This indicator can be used to backtest 3commas DCA bots who are using TA presets, RSI or ULT.
Its main goal is to create strategies by combining indicators.
Let's dive into the details of what's included:
Entry Condition: MACD
Triggers an entry when macd crosses with the signal line.
Configure the fast, slow length, signal smoothing and timeframe to trigger the condition.
Entry Condition: RSI
Triggers an entry when the RSI is higher or lower than the long/short threshold.
Configure the length, timeframe, long and short threshold to trigger the condition.
Entry Condition: ULT (Ultimate Oscillator)
Triggers an entry when the ULT is higher or lower than the long/short threshold.
Configure the 3 lengths, timeframe, long and short threshold to trigger the condition.
Entry Condition: Bollinger Bands
Triggers an entry when the price is above the upper band for long and below the lower band for short.
Configure the length, standard deviation and timeframe to trigger the condition.
Entry Condition: MFI (Money Flow Index)
Similar to RSI, it triggers an entry when the MFI is higher or lower than the long/short threshold.
Configure the length, timeframe, long and short threshold to trigger the condition.
Entry Condition: CCI (Commodity Channel Index)
Another oscillator that triggers an entry when its value is higher or lower than the long/short threshold.
Configure the length, timeframe, long and short threshold to trigger the condition.
Trend Filters
Use one or two trendlines to filter your trades: go only long/short when the trendline is bullish/bearish.
Choose between the several trendlines: ema, sma, wma, hull ma, kama, alma, rma, swma, vwma, Tilson T3, and the unique Adaptive T3 and Adaptive Hull MA.
If this is not enough, you can use the external trendline feature to plug in any other indicator for your trendline.
The second trendline can be MTF and come from another symbol if needed.
Combining Indicators
Most of the time we will not be using a single indicator at a time, but instead, combine them in order to get stronger entries.
The entry conditions are combined using a AND logical gate, meaning all conditions must be true for the entry to trigger.
Here is an example using a combination of 2 indicators: Bollinger Bands and RSI.
We can see less entries are being triggered on the bottom chart than on the top chart because the bottom chart is combining the 2 indicators while the top chart is only using Bollinger Bands.
You can combine up to all 6 indicators if you want, but keep in mind that combining too many may lead to triggering no entry at all.
Risk Management and Trade system
The indicator will not trigger more than one long or short entry in a row.
To start a new trade, the indicator will wait for either take profit, stop loss or an opposite entry if no SL and TP is set.
Stop Loss and Take Profit
Configure your stop loss and take profit for long and short trades.
You can also make a trailing stoploss and a trailing take profit.
Safety Orders
Just like 3commas bots, you can create a strategy with up to 100 safety orders.
Configure their placement and order size using the price deviation, step scale, take profit type (from base order or total volume), and volume scale settings.
Note: only the 20 first safety order steps or so will be plotted due to graphic limiations. The steps after that still trigger alerts and backtest results.
Creating Alerts
The indicator is using the newest alert system:
1. Write your alert messages in the indicator settings (alert section at the bottom)
2. Click "Create Alert" as usual, but choose "alert() function calls only"
Data Window
Since the indicator is applied on top of the price chart, the oscillator indicators cannot be plotted. You can always add them on another pane but if you want to just see their values, you can use the Data Window to see the value of each oscillator on each bar.
Backtest settings
Used to get the results below:
Initial Capital: 100 000$
Base Order Size: 0.1 contract (BTC)
Safety Order Size: 0.1 contract (BTC)
Commission: 0.1%
Slippage: 100 ticks
pyramiding: 6
The indicator settings are plotted in the main chart panel.

Bollinger Band with RSI
Using combination bollinger band and RSI indicator as guide to predict price volatility and the best entry point. The strategy logic is pretty straightforward where we're interested with close price that touches the lower bollinger band ; there are only two scenarios that will happened after the price reaches the lower band; the price might rebound from the lower bollinger band or drop lower and continue downtrend. To confirm the price movement, we use a second indicator which is the RSI to further investigate the price trend. For example, if the price reaches the lower bollinger band but the RSI value is not in the oversold region, we can conclude that the price will go lower and continue downtrend. If the RSI value is in the oversold region, we can use this price area as our entry point.
Stop loss is necessary to avoid losing too much capital if the RSI value lingers too long in the oversold region.
Best take profit area is when the price rebound above the middle bollinger band area/upper bollinger band or when the RSI reaches overbought region; whichever comes first.
Long entry:
RSI < 30 & close price < lower bollinger band
Exit entry:
RSI > 70
Default stop loss: -25%

ATR + %R Scalping StrategyThe Average True Range is a single line indicator that measures volatility. The indicator was originally developed by J. Welles Wilder to measure the volatility of commodities within the futures market.
ATR does not measure price trends or price direction hence %R and Parabolic SAR indicators were added.
The strategy enhances standard Average True Range and %R composition with trend confirmation and filters which clear out market noises and manipulations from triggers.
The strategy supports traditional and cryptocurrency spot, futures, options and marginal trading exchanges. It works accurately with BTC, USD, USDT, ETH and BNB quote currencies. Best to use with 5 and 15 minutes timeframe charts and Limit orders.
The strategy can be and should be configured for each particular asset. You can change filters and risk management settings to receive the most advanced accurate alerts
Advantages of this script:
Strategy has high profit factor around 30.32
Backtests show high accuracy around 91.18%
High Net Profit percentage
Low Drawdowns
Weak signals are filtered
Dynamic Take profit and Stop loss
Fast deals around 50 minutes per trade
Can be applied to any market and quote currency
Easy to configure user interface
How to use?
1. Apply strategy to the trading pair your are interested in at 5m or 15m timeframe chart
2. Configure the strategy: change filters values and risk management settings until Strategy tester shows good results according to mathematical expectation
3. Set up a TradingView alert to trigger when strategy conditions are met
4. Strategy will send alerts when to enter and when to exit positions

Scalping using RSI 2 indicator with TSLThis strategy implements a simply scalping using the RSI (calculated on two periods), the slopes of two MAs ( EMA or SMA ) having different lengths (by default, I use 50 and 200).
A trailing stop loss (%) is used.
Entry conditions:
.) Fast MA > Slow MA and Price > Slow MA and RSI < Oversold Threshold ------> go Long
.) Fast MA < Slow MA and Price < Slow MA and RSI > Overbought Threshold ------> go Short
Exit conditions:
.) Long entry condition is true and (close >= TP or close <= TSL ) ----> close short position
.) Short entry condition is true and (close <= TP or close >= TSL ) ----> close long position
The strategy performed best on Bitcoin and the most liquid and capitalized Altcoins but works excellent on volatile assets, mainly if they often go trending.
Works best on 3h - 4h time frame.
There's also an optional Volatility filter, which opens the position only if the difference between the two slopes is more than a specific value, which can be set in the study inputs. The purpose is not opening positions if the price goes sideways and the noise is way > than the signal.
Note:
.) the RSI length is 2;
.) the oversold Threshold is 90%;
.) the overbought Threshold is 10%;
.) by default, the trailing stop loss per cent is 1%;
.) by default, the fast MA length is 50;
.) by default, the slow MA length is 200;
.) by default, the MA used is EMA.
Cheers.

scalping against trapped countertrendAbstract
This script attempts to find the end of countertrend.
This script uses oscillators to measure long term and short period trends. When the long term trend keeps positive and clear short term period is over, this script provides a buy signal.
This script does not contain pullback, cut loss and re-enter. You need to add it manually.
Introduction
Many traders want to buy when long term trend is bullish and short term pullback is over.
This is because we can take advantage to the emotion of countertrend traders.
Countertrend traders realizes their profit is finite and therefore want to protect their profit well and limit their loss.
This script is inspired by a searchable trading strategy video.
The video mentioned 4 points.
(1) long term trend. The video did not spend much ink on this point. You can use any method to observe.
(2) clear pullback bar (at least 50% body)
(3) weak bar after clear pullback
(4) entry trigger buy stop
This script attempts to quantize these points to determine trading direction.
This script is originally designed for timeframes lower than examples in the video but you can apply it on any timeframe.
Computing and Adjusting
(1) long term trend
This script uses smoothed stochastic.
(2) clear pullback bar
Since this script is originally designed for timeframes lower than examples in the video, so the condition becomes:
RSI is low enough
(3) weak bar after clear pullback
RSI goes back from low level.
(4) entry trigger buy stop
This script does not include this condition.
You can decide enter when buy stop or pullback.
Parameters
x_src : the value for computing oscillators
x_len_a : how many bars for measuring short term trend
x_len_b : how many bars for measuring long term trend
x_k_b : smooth long term trend, the average value of stochastic values
x_changk = check if clear short term pullback appears recently. 1 means do not use, larger numbers means how long of periods to check.
x_rsi_ct : threshold of short term pullback clear
x_rsi_ft : threshold of short term pullback end
Reading numbers in Strategy Tester
Most possible loss :
(1) to find rational pullback. Generally 1/3 to 2/3 atr.
(2) to find cut loss distance. Generally 1 to 2 atr.
Most possible profit :
to find if trading the opposite direction against this script is profitable.
Conclusion
This script can suggest us trading direction.
Waiting for pullback can reduce risk, compared to buy stop.
This script does not provide good signals in sideways markets.
Reference
A searchable trading strategy video

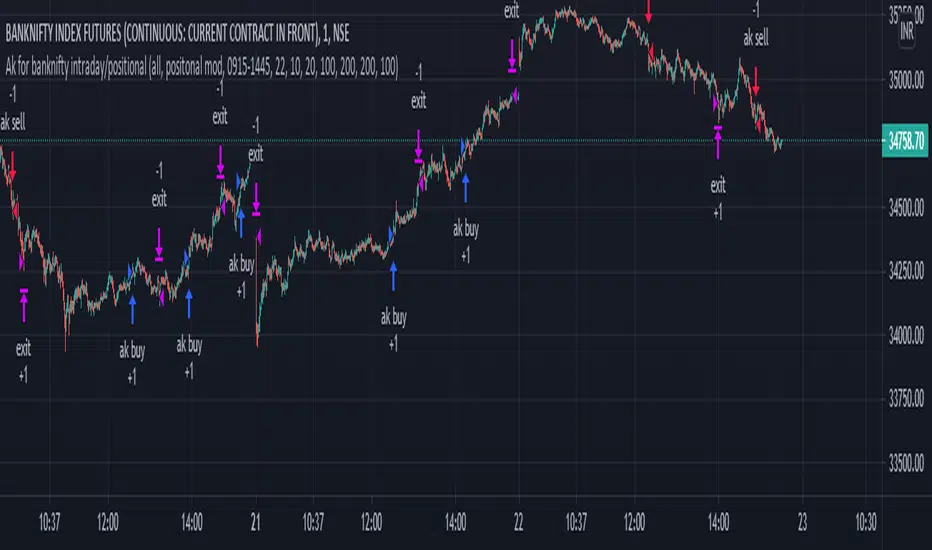
Ak for Banknifty intradayHi friends this is Ak for Banknifty Intraday
It analyse price action when price makes higher high or higher low and it scalps and take profit ..its occur in moment of time so for that algo trading require..it automatically take profit and stoploss and close trade near session end. u can also change time for close trade...it automatically calculate previous candles high and low and when it breaks it generate buy and sell signal...
PROFIT MAKER |Crypto|ETH|BTC|YFIThis is a trend-following strategy that works very well for many Crypto assets in the usd or usdt pair
It can be used for both futures and spot!
Some of the assets in which this strategy is proven are
Asset Exchange TF
BINANCE:ADAUSDT Binance 45m
BINANCE:BTCUSDT Binance 1h
BINANCE:YFIUSDT Binance 30m
BINANCE:DOTUSDT Binance 45m
BINANCE:ETHUSDT Binance 30m
BINANCE:LINKUSDT Binance 45m
BINANCE:DOGEUSDT Binance 1h
And many others..
BINANCE:BTCUSDT
BINANCE:LINKUSDT
What is this strategy based on?
It is a combination of various parameters, including
-RSI: The relative strength index (RSI) is a momentum indicator used in technical analysis that measures
the magnitude of recent price changes to evaluate overbought or oversold conditions in the price of a stock or other asset.
-MACD: Moving average convergence divergence (MACD) is a trend-following momentum indicator that shows
the relationship between two moving averages of a security’s price.
-ADX: ADX is used to quantify trend strength. ADX calculations are based on a moving average of price range expansion over a given period of time.
-DMI: DMI is a moving average of range expansion over a given period (the default is 14 days). The positive directional
movement indicator (+DMI) measures how strongly price moves upward; the negative directional movement indicator (-DMI)
measures how strongly price moves downward. The two lines reflect the respective strength of the bulls versus the bears.
Included:
Different forms of Take profit, included:
Take profit on squeeze candles
Take profit based on Risk-Benefit (RR)
Take profit a pre-determined %.
Different forms of Stop Loss, including
ATR-based stop loss
Trail stop loss (with option to use a trigger)
Stop loss a pre-determined %.
**All trades include 0.1% of fees + slippage
** The statistics displayed are for the year 01-01-2020 and the period from 2021 to the date of publication (14-01-2020)
For access you can send a message or consult in my social networks.
Links in my tradingview signature (below).

Scalping Strategy with SL and TP activation settingsThis strategy can be used on pretty much every timeframe that gives you a satisfying performance and will give you entries with a high probability of a winning trade.
Recommended are lower timeframes, because after all this is a scalping strategy and with that your chart wont be cluttered.
How to use this script?
Currently you can setup your positions SL and TP, because the markets vary in volatility it could improve the performance of the strategy.
You will simply get your signals and can decide to act upon them.
Stop loss: Simply your stop loss order which will trigger when price moves a given % away from your entry.
TP-Activation: When price reaches your % target it will trigger a stop limit order. So if price turns against your position after reaching your target it will close your position in profit and if it runs in your favoured direction it will trigger at a later stage.
Trailing-Offset-%: After reaching your % target it will trigger the TP order with an offset. So if you set your trailing offset to 0.1%, your TP order will be set behind 0.1 %. This can be used to test if the strategy would perform as well
if you leave more room for trades to play out.
Will this script make me profitable?
No strategy is a silver bullet and it depends mostly on you.
Trading is not easy and most people fail, because their risk management skills arent solid or they cant control their emotions.
This script will give you statistically often good entries, so even if you hit a losing streak your SL will protect you from losing more than necessary until you get a winning streak.
Patience and consistency is key to be profitable in the long run.
Does the script repaint?
Although you will get a notification when setting an alarm that the indicator may repaint, no security function is used and the signals will stay on the chart, because the signal is calculated based on the last candle close and will trigger with the next candle.
I am still looking into why that notification pops up.
You are free to try the indicator for a limited time to be sure.
My experience with the strategy
The overall statistical advantage is great. The strategy can be used simply as it is, but becomes better if you already have some experience with trading. Sometimes it will give you a good entry, reaches your target and the price still goes in your preferred direction. So your trading returns and experience could be improved with confluence, but it is totally fine as it is and if used right will help you get going.
Disclaimer: This is no financial advice. This is a tool and I am not responsible for your actions.
If you are interested in the indicator feel free to dm me on TradingView.

Cyatophilum Scalper [BACKTEST]This indicator comes with a backtest and alert version. This is the backtest version. Its purpose is to create low timeframe and scalping strategies, by choosing from a list of built-in entry points which are described in detail below, and by configuring a risk management system to your liking.
Before diving into the entry points, I will explain the strategy and risk management settings.
These 3 settings allow to choose your strategy direction, and main behavior.
- Go Long ↗: activate or deactivate long entry points.
- Go Short ↘: activate or deactivate short entry points.
- Reversal strategy ↗↘↗↘: Activate this option will allow trades to reverse position from an opposite entry point. Keep it deactivated and trades will either wait a TakeProfit(TP) or StopLoss(SL) to be closed. When neither SL nor TP or set, this option is automatically activated.
StopLoss settings:
Both Long and Short SL can be activated and configured.
The base % price is the starting point of the stoploss, in a percentage of current price.
Trailing stop, when activated, works with 2 settings:
- % Price to Trigger: a percentage of current price the price should move in a bar to trigger a trailing movement.
- % Price Movement: the stoploss variation in a percentage of current price that moves on each bar.
TakeProfit settings:
Both Long and Short TP can be activated and configured.
The base % price is the value of the TP, in a percentage of current price.
Trailing Profit Deviation %: Percent deviation for the trailing take profit.
DCA:
DCA stands for Dollar Cost Average. The idea is to open additional orders from the base order so as to improve risk management.
These additional orders are also called Safety Orders. The indicator can handle up to 9 safety orders.
The strategy will exit either from a take profit based on percentage from base order or from a total volume percentage (Configurable in the parameters).
The steps spacing (space between each step) and safety orders volume (order size) can both scale by adding a scale multiplier.
By choosing from the base strategy dropdown menu, the indicator will generate entry points.
1. BUY SELL:
-> Low timeframes spot trading, with simple buy and sell orders.
How it works:
The indicator used is a combination of QQE (Atr based trend following indicator) and RMA 100 trendline.
I think the QQE does a great job in low timeframes because it is not impacted by the noise.
The RMA which is the moving average used in the RSI, will help giving confirmation to the entry points.
How to use:
It is meant to be used as a reversal strategy, but you can add a TP or SL if you want.
When comparing to Buy & Hold, make sure to deactivate the "Short results in the backtest" setting.
2. TREND SCALPING
-> A strategy for low timeframes trading.
How it works:
The strategy creates high volatility entries filtered by a duo convergence of adaptive trendlines (Adaptive HULL MA using the chart's resolution, Adaptive Tilson T3 using 1H resolution) and a higher timeframe (1H) RSI filter (long threshold: 70, short threshold: 40, RSI length: 10).
How to use:
Must be used on charts with a resolution smaller than 1H. Recommended: from 1m to 30m.
Must NOT be used as reversal strategy. Use it with a take profit and stop loss, and DCA if you can.
Sample risk management settings:
3. Support/Resistance BREAKOUTS
-> Trade low timeframes pivot points breakouts.
How it works:
The indicator calculates the 100 previous bars swing high and low. Any break above high or below low will trigger an entry point.
The entry is however filtered by an Adaptive Tilson T3 Trendline, an ADX 30 minimum threshold and a minimum average volume threshold.
How to use:
I recommend to click "Reversal" Strategy and set a Takeprofit target.
Find the best timeframe between 1m and 30m using the backtest version.
Example here with BTCUSDTPERP on 15m:
4. AGGRESSIVE SCALPING
-> Lots of trades in low timeframes.
How it works:
Created using Cyato AI, Higher/Lower Highs and Lows and 2 HULLMA crosses as entries, and 2 Adaptive Tilson T3 as trendfilter, a 25 ADX threshold filter and a volume filter.
How to use:
Recommended Risk Management settings: Takeprofit, Stoploss and DCA (Safety orders).
Find which timeframe work the best from 30 min and below. Should not be used above 30 min since this is the resolution for the MTF Tilson.
How to create Strategy Alerts:
Write your alert messages for EXIT, LONG and SHORT orders in the settings (Backtest section).
Then click add alert, and in the alert message, write the following:
{{strategy.order.alert_message}}
BACKTEST PARAMETERS
- Inital capital: 10 000$
- Base order size: 0.1 contract (0.1 btc)
- Safety order size: 0.1 contract (0.1 btc)
- Commission: 0.1%
- Slippage: 100 ticks
Oldest trade: 2020-08-31
Backtest Period: From 2020-08-31 to 2020-11-12
Configuration used: see the live chart configuration panel at the top.
To gain access to this paid indicator, please use the link below.

Triple EMA Scalper low lag stratHi all,
This strategy is based on the Amazing scalper for majors with risk management by SoftKill21
The change is in lines 11-20 where the sma's are replaced with Triple ema's to
lower the lag.
The original author is SoftKill21. His explanation is repeated below:
Best suited for 1M time frame and majors currency pairs.
Note that I tried it at 3M time frame.
Its made of :
Ema ( exponential moving average ) , long period 25
Ema ( exponential moving average ) Predictive, long period 50,
Ema ( exponential moving average ) Predictive, long period 100
Risk management , risking % of equity per trade using stop loss and take profits levels.
Long Entry:
When the Ema 25 cross up through the 50 Ema and 100 EMA . and we are in london or new york session( very important the session, imagine if we have only american or european currencies, its best to test it)
Short Entry:
When the Ema 25 cross down through the 50 Ema and 100 EMA , and we are in london or new york session( very important the session, imagine if we have only american or european currencies, its best to test it)
Exit:
TargetPrice: 5-10 pips
Stop loss: 9-12 pips

Pagoda of scalping, excessivetradingThis is a system I developed initially for scalping. Please be careful because trading only by this system blindly can cause total losses!
This system uses a risky technique by taking profits very fast.
It is build around moving averages and japanese candlesticks close prices cross the moving averages. The stop loss in this example is the reversal of the moving average crossing the prices.
You can feel free to play with parameters and let me know what other good stuff you did find out!
Peace!

Amazing scalper for majors with risk managementHello,
Today I am glad to bring you an amazing simple and efficient scalper strategy.
Best suited for 1M time frame and majors currency pairs.
Its made of :
Ema (exponential moving average) , long period 25
Ema(exponential moving average) Predictive, long period 50,
Ema(exponential moving average) Predictive, long period 100
Risk management , risking % of equity per trade using stop loss and take profits levels.
Long Entry:
When the Ema 25 cross up through the 50 Ema and 100 EMA. and we are in london or new york session( very important the session, imagine if we have only american or european currencies, its best to test it)
Short Entry:
When the Ema 25 cross down through the 50 Ema and 100 EMA, and we are in london or new york session( very important the session, imagine if we have only american or european currencies, its best to test it)
Exit:
TargetPrice: 5-10 pips
Stop loss: 9-12 pips
Hope you enjoy it :)

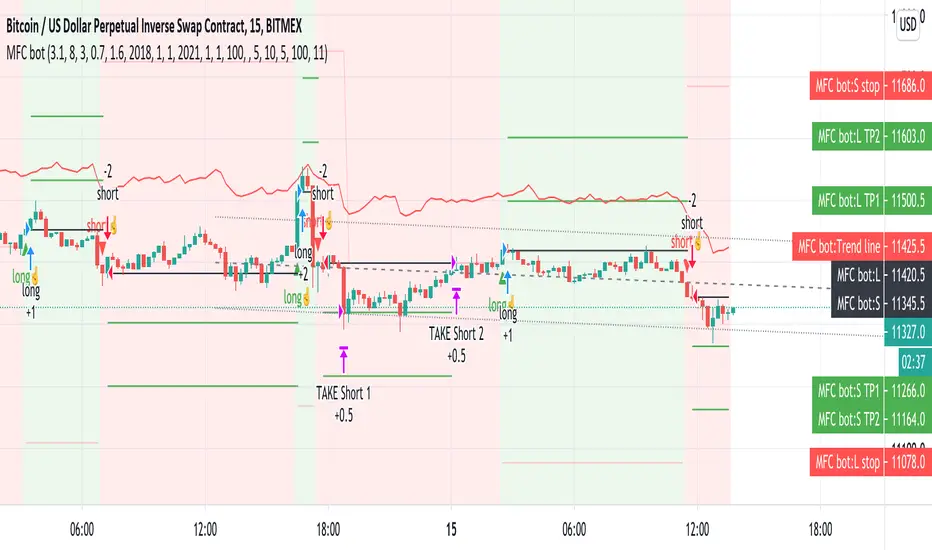
Money Flow Club Bot Strategy 1-15 min ALLENG:
Friends, in this script, there is a function that calls the closing of the candle by Heikin ASHI candles.
You can disable it in the indicator settings.
There is no redrawing of the indicator on regular candlesticks.
The indicator is easy to set up for any trading pairs and any exchanges.
It has an entry point and provides 2 take profit.
It also contains consolidation zones when the price moves for a short time in the range that is visible on the indicator.
In order to try the indicator write in your personal messages.
The strategy does not specify a condition for exiting the position when the first take is taken, the stop is moved to breakeven, so the chart in the strategy turned out to be torn.
RUS:
Друзья, в этом скрипте присутствует функция вызывающая закрытие свечи по свечам Хейкин Аши.
Её можно отключить в настройках индикатора. На обычных свечах перерисовка индикатора отсутствует.
Индикатор легко настроить на любые торговые пары и любые биржи. А нем есть точка входа и предусмотрены 2 тейк профита.
Так же в нем присутствуют зоны консолидации когда цена короткое время движется в диапазоне который виден на индикаторе.
Для того что бы попробовать индикатор напишите в личные сообщения.
В стратегии не прописано условие выхода из позиции когда первый тейк взят, то стоп переносится в безубыток, поэтому график в стратегии получился рваный.
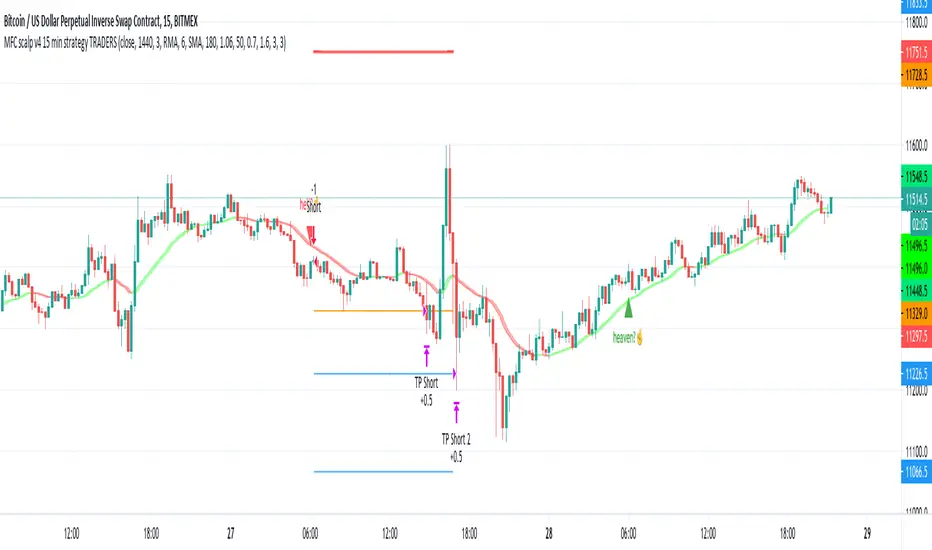
MFC scalp v4 15 min strategy TRADERSthis indicator to trade for a short time in a TF of 15 minutes.
We have created takeprofit zones for you so that you can understand where we can get to and take your profit. these points are mostly very helpful.
There are basic settings that allow you to adjust the indicator individually for each situation; because of this, this indicator can be used for any exchange and any currency pair.
For Scalp trading, we use 4 different strategies available to our clients. If you enter them correctly, you can never see the minus sign.
Use the link below to obtain access to this indicator.
Full strategy AllinOne with risk management MACD RSI PSAR ATR MAHey, I am glad to present you one of the strategies where I put a lot of time in it.
This strategy can be adapted to all type of timecharts like scalping, daytrading or swing.
The context is the next one :
First we have the ATR to calculate our TP/SL points. At the same time we have another rule once we enter(we enter based on % risk from total equity, in this example 1%, at the same time, lowest ammount for this example is 0.1 lots, but can be modified to 0.01), so we can exit both by tp/sl points, or by losing 1% of our equity or winning 1% of our total equity. It's dinamic.
The strategy is made from
Trend direction :
PSAR
First confirmation point :
Crossover between 10EMA and Bollinger bands middle point
Second confirmation
MACD histogram
Third confirmation
RSI overbought/oversold levels
For entries : we check trend with psar, then once ema cross bb middle point, we confirm together with rsi level for overbought/oversold and macd histogram ( > 0 or <0).
We exit, when we have opposite sign, like from buy to sell or sell to buy, or when we reach tp/sl points, or when we reach % basaed equity points.
It can be changed to be fixed lots, or fixed tp/sl , you just have to uncomment the size from entries, and tp/sl lines.
At the same time, it has the possibility if one desires, to trade only concrete forex session like european, asian and so on for intraday trading.
Hope you enjoy it.
Let me know how it goes.

Candle checker for long/short for scalping/day tradingHey.
This strategy is still in working.
For it I check a x amount of candles in the past if they been for example all red/green in row, and based on that I enter. For example candle 7 < candle 6 .... candle 3 < candle 2 .... candle 1 < candle current for long and viceversa for short.
After that,once the trade is initiated, I exit based on 2 possibilities : candle color is different than the color of candle when entry, or based tp/sl.
Let me know what you think of it.
I will try to make the process to calculate automatically and input the number of candles to check like 5-10-15 and so on.

Ehlers Bandpass FilterThis script uses @cheatcountry script to determine Ehlers Bandpass Filter.
Backtest offers 3 capital management tools. One that will always calculate order size as initial capital/close, one that uses the same calculation but adds or substracts profit. The last one allows you to enter manually the size you want to trade.
The time-based stop will close the position after a set number of bars.

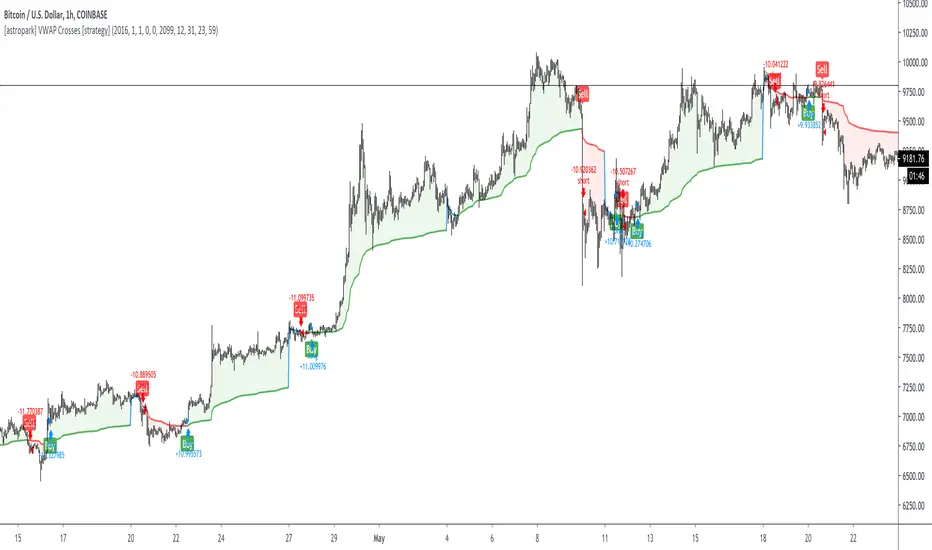
[astropark] VWAP Crosses [strategy]Dear Followers,
today a new Swing and Scalping Strategy based on WVAP , mainly designed for Bitcoin and High-Cap Cryptocurrencies, like Ethereum. It works also on Forex and Stocks.
It works great since 15m and above till 1D. I suggest you to use it on 15m, 30m or 1h timeframes .
VWAP or "Volume Weighted Average Price" is a volume-based indicator similar to a moving average.
This trading indicator is used to identify market resistance and support levels and is represented as a weighted average price for the treaded volumes.
My strategy will help you identify main support-resistance level to be careful of and it will trigger a buy or a sell depending on how price will intereact with vwaps.
green means we are in a bullish trend, in fact it start with a "buy" signal
red means we are in a bearish trend, in fact it start with a "sell" signal
blue means we are in a moment where trend may change, so be careful and always remember that taking profits is awesome and have a stoploss is a must in trading
The user who wants to use this strategy, especially via an automated bot, must always set a stoploss (example 150$ from entry on bitcoin) or use a proper risk management strategy .
This is not the "Holy Grail", so use it with caution. It's highly suggested to use a proper money management .
This script will let you backtest this script and check profitability on your preferred market.
The alarms version of this indicator, which will let you set all notifications you may need in order to be alerted on each triggered signals, can be found by searching for astropark "VWAP Crosses"
This is a premium indicator , so send me a private message in order to get access to this script.
VK trend scalper 30mThis strategy is designed to be used on the 30 minute time frame
In this strategy, I actually implemented my own scalping style into building the strategy. Having to replicate my own trading strategy into an algorithm, I can't make it exactly perfect to how I would trade, but what I can do is try and program the parameters that give it the absolute best chance of making a big move with a small drawdown- which replicates part of my trend trading style. Here I am using VWMA , EMA and trend filtering values to find trend change and best entries.
you can also try it on any cryptocurrency/forex/commodity/stocks
*This script is currently experimental you can try it if you want.

PS3X Strategy TesterPS3X Strategy Tester is a completely new strategy built from the ground up as a successor to previous 1.0 and 2.0 versions of Profit Sniper.
Offering up huge improvements, including multiple position triggers, derived from Bollinger Bands and Chande Momentum as well as our own bespoke stochastic ribbons that provide trend pivots.
So how does it work?
PS3X Strategy Tester allows you to tailor your preference for waiting for either Stochastic Ribbon cross only, Ribbon Cross followed by Chande Confirmation, or Ribbon Cross followed by rising/falling MACD for additional market structure confidence.
Strategy exits can be configured to exit on % change of MACD histogram indicating a direction change, and additionally using our revolutionary "Profit Lockin" to provide a stepped lock in of profits according to your preferred risk strategy. Commision of 0.05% has been added to represent "limit in-market out" trading, but please tailor this again to your preferred trading approach.
If you would like access, please send me a PM.
