HighTimeframeTimingLibrary "HighTimeframeTiming"
@description Library for sampling high timeframe (HTF) historical data at an arbitrary number of HTF bars back, using a single security() call.
The data is fixed and does not alter over the course of the HTF bar. It also behaves consistently on historical and elapsed realtime bars.
‼ LIMITATIONS: This library function depends on there being a consistent number of chart timeframe bars within the HTF bar. This is almost always true in 24/7 markets like crypto.
This might not be true if the chart doesn't produce an update when expected, for example because the asset is thinly traded and there is no volume or price update from the feed at that time.
To mitigate this risk, use this function on liquid assets and at chart timeframes high enough to reliably produce updates at least once per bar period.
The consistent ratio of bars might also break down in markets with irregular sessions and hours. I'm not sure if or how one could mitigate this.
Another limitation is that because we're accessing a multiplied number of chart bars, you will run out of chart bars faster than you would HTF bars. This is only a problem if you use a large historical operator.
If you call a function from this library, you should probably reproduce these limitations in your script description.
However, all of this doesn't mean that this function might not still be the best available solution, depending what your needs are.
If a single chart bar is skipped, for example, the calculation will be off by 1 until the next HTF bar opens. This is certainly inconsistent, but potentially still usable.
@function f_offset_synch(float _HTF_X, int _HTF_H, int _openChartBarsIn, bool _updateEarly)
Returns the number of chart bars that you need to go back in order to get a stable HTF value from a given number of HTF bars ago.
@param float _HTF_X is the timeframe multiplier, i.e. how much bigger the selected timeframe is than the chart timeframe. The script shows a way to calculate this using another of my libraries without using up a security() call.
@param int _HTF_H is the historical operator on the HTF, i.e. how many bars back you want to go on the higher timeframe. If omitted, defaults to zero.
@param int _openChartBarsIn is how many chart bars have been opened within the current HTF bar. An example of calculating this is given below.
@param bool _updateEarly defines whether you want to update the value at the closing calculation of the last chart bar in the HTF bar or at the open of the first one.
@returns an integer that you can use as a historical operator to retrieve the value for the appropriate HTF bar.
🙏 Credits: This library is an attempt at a solution of the problems in using HTF data that were laid out by Pinecoders in "security() revisited" -
Thanks are due to the authors of that work for an understanding of HTF issues. In addition, the current script also includes some of its code.
Specifically, this script reuses the main function recommended in "security() revisited", for the purposes of comparison. And it extends that function to access historical data, again just for comparison.
All the rest of the code, and in particular all of the code in the exported function, is my own.
Special thanks to LucF for pointing out the limitations of my approach.
~~~~~~~~~~~~~~~~|
EXPLANATION
~~~~~~~~~~~~~~~~|
Problems with live HTF data: Many problems with using live HTF data from security() have been clearly explained by Pinecoders in "security() revisited"
In short, its behaviour is inconsistent between historical and elapsed realtime bars, and it changes in realtime, which can cause calculations and alerts to misbehave.
Various unsatisfactory solutions are discussed in "security() revisited", and understanding that script is a prerequisite to understanding this library.
PineCoders give their own solution, which is to fix the data by essentially using the previous HTF bar's data. Importantly, that solution is consistent between historical and realtime bars.
This library is an attempt to provide an alternative to that solution.
Problems with historical HTF data: In addition to the problems with live HTF data, there are different issues when trying to access historical HTF data.
Why use historical HTF data? Maybe you want to do custom calculations that involve previous HTF bars. Or to use HTF data in a function that has mutable variables and so can't be done in a security() call.
Most obviously, using the historical operator (in this description, represented using { } because the square brackets don't render) on variables already retrieved from a security() call, e.g. HTF_Close{1}, is not very useful:
it retrieves the value from the previous *chart* bar, not the previous HTF bar.
Using {1} directly in the security() call instead does get data from the previous HTF bar, but it behaves inconsistently, as we shall see.
This library addresses these concerns as well.
Housekeeping: To follow what's going on with the example and comparisons, turn line labels on: Settings > Scales > Indicator Name Label.
The following explanation assumes "close" as the source, but you can change it if you want.
To quickly see the difference between historical and realtime bars, set the HTF to something like 3 minutes on a 15s chart.
The bars at the top of the screen show the status. Historical bars are grey, elapsed realtime bars are red, and the realtime bar is green. A white vertical line shows the open of a HTF bar.
A: This library function f_offset_synch(): When supplied with an input offset of 0, it plots a stable value of the close of the *previous* HTF bar. This value is thus safe to use for calculations and alerts.
For a historical operator of {1}, it gives the close of the *last-but-one* bar. Sounds simple enough. Let's look at the other options to see its advantages.
B: Live HTF data: Represented on the line label as "security(){0}". Note: this is the source that f_offset_synch() samples.
The raw HTF data is very different on historical and realtime bars:
+ On historical bars, it uses a flat value from the end of the previous HTF bar. It updates at the close of the HTF bar.
+ On realtime bars, it varies between and within each chart bar.
There might be occasions where you want to use live data, in full knowledge of its drawbacks described above. For example, to show simple live conditions that are reversible after a chart bar close.
This library transforms live data to get the fixed data, thus giving you access to both live and fixed data with only one security() call.
C: Historical data using security(){H}: To see how this behaves, set the {H} value in the settings to 1 and show options A, B, and C.
+ On historical bars, this option matches option A, this library function, exactly. It behaves just like security(){0} but one HTF bar behind, as you would expect.
+ On realtime bars, this option takes the value of security(){0} at the end of a HTF bar, but it takes it from the previous *chart* bar, and then persists that.
The easiest way to see this inconsistency is on the first realtime bar (marked red at the top of the screen). This option suddenly jumps, even if it's in the middle of a HTF bar.
Contrast this with option A, which is always constant, until it updates, once per HTF bar.
D: PineCoders' original function: To see how this behaves, show options A, B, and D. Set the {H} value in the settings to 0, then 1.
The PineCoders' original function (D) and extended function (E) do not have the same limitations as this library, described in the Limitations section.
This option has all of the same advantages that this library function, option A, does, with the following differences:
+ It cannot access historical data. The {H} setting makes no difference.
+ It always updates at the open of the first chart bar in a new HTF bar.
By contrast, this library function, option A, is configured by default to update at the close of the last chart bar in a HTF bar.
This little frontrunning is only a few seconds but could be significant in trading. E.g. on a 1D HTF with a 4H chart, an alert that involves a HTF change set to trigger ON CLOSE would trigger 4 hours later using this method -
but use exactly the same value. It depends on the market and timeframe as to whether you could actually trade this. E.g. at the very end of a tradfi day your order won't get executed.
This behaviour mimics how security() itself updates, as is easy to see on the chart. If you don't want it, just set in_updateEarly to false. Then it matches option D exactly.
E: PineCoders' function, extended to get history: To see how this behaves, show options A and E. Set the {H} value in the settings to 0, then 1.
I modified the original function to be able to get historical values. In all other respects it is the same.
Apart from not having the option to update earlier, the only disadvantage of this method vs this library function is that it requires one security() call for each historical operator.
For example, if you wanted live data, and fixed data, and fixed data one bar back, you would need 3 security() calls. My library function requires just one.
This is the essential tradeoff: extra complexity and less robustness in certain circumstances (the PineCoders function is simple and universal by comparison) for more flexibility with fewer security() calls.
Search in scripts for "鹿岛鹿角vs福冈黄蜂"

Template Trailing Strategy (Backtester)💭 Overview
+ Title: Template Trailing Strategy (Backtester)
+ Author: Iason Nikolas (jason5480)
+ License: CC BY-NC-SA 4.0
💢 What is the "Template Trailing Strategy (Backtester)" ❓
The "Template Trailing Strategy (Backtester)" (TTS) is a back-tester orchestration framework. It supercharges the implementation-test-evaluation lifecycle of new trading strategies, by making it possible to plug in your own trading idea.
While TTS offers a vast number of configuration settings, it primarily allows the trader to:
Test and evaluate your own trading logic that is described in terms of entry, exit, and cancellation conditions.
Define the entry and exit order types as well as their target prices when the limit, stop, or stop-limit order types are used.
Utilize a variety of options regarding the placement of the stop-loss and take-profit target(s) prices and support for well-known techniques like moving to breakeven and trailing.
Provide well-known quantity calculation methods to properly handle risk management and easily evaluate trading strategies and compare them.
Alert on each trading event or any related change through a robust and fully customizable messaging system.
All of the above makes TTS a practical toolkit: once you learn it, many repetitive tasks that strategy authors usually re-implement are eliminated. Using TradingView’s built-in backtesting engine makes testing and comparing ideas straightforward.
By utilizing the TTS one can easily swap "trading logic" by testing, evaluating, and comparing each trading idea and/or individual component of a strategy.
Finally, TTS, through its per-event alert management (and debugging) system, provides an automated solution that supports live trading with brokers via webhooks.
NOTE: The "Template Trailing Strategy (Backtester)" does not dictate how you can combine different indicator types. Thus, it should not be confused as a "Trading System", because it gives its user full flexibility on that end (for better or worse).
💢 What is a "Signal Indicator" ❓
"Signal Indicator" (SI) is an indicator that can output a "signal" that follows a specific convention so that the "Template Trailing Strategy (Backtester)" can "understand" and execute the orders accordingly. The SI realizes the core trading logic signaling to the TTS when to enter, exit, or cancel an order. A SI instructs the TTS "when" to enter or exit, and the TTS determines "how" to enter and exit the position once the Signal Indicator generates a signal.
A very simple example of a Signal Indicator might be a 200-day Simple Moving Average Signal. When the price of the security closes above the 200-day SMA, a SI would provide TTS with a "long entry signal". Once TTS receives the "long entry signal", the TTS will open a long position and send an alert or automated trade message via webhook to a broker, based on the Entry settings defined in TTS. If the TTS Entry settings specify a "Market" order type, then the open long position will be executed by TTS immediately. But if the TTS Entry settings specify a "Stop" order type with a 1% Stop Distance, then when the price of the security rises by 1% after the "long entry signal" occurs, the TTS will open a long position and the Long Entry alert or webhook to the broker will be sent.
🤔 How to Guide
💢 How to connect a "signal" from a "Signal Indicator" ❓
The "Template Trailing Strategy (Backtester)" was designed to receive external signals from a "Signal Indicator". In this way, a "new trading idea" can be developed, configured, and evaluated separately from the TTS. Similarly, the SI can be held constant, and the trading mechanics can change in the TTS settings and back-tested to answer questions such as, "Am I better with a different stop loss placement method, what if I used a limit order instead of a stop order to enter, what if I used 25% margin instead of trading spot market?"
To make that possible by connecting an external signal indicator to TTS, you should:
Add both your SI (e.g. "Two MA Signal Indicator" , "Click Signal Indicator" , "Signal Adapter" , "Signal Composer" ) and the TTS script to the same chart.
Open the script's Settings / Inputs dialog for the TTS.
In the 🛠️ STRATEGY group set 𝐃𝐞𝐚𝐥 𝐂𝐨𝐧𝐝𝐢𝐨𝐧𝐬 𝐌𝐨𝐝𝐞 to 🔨External (this makes TTS listen to an external signal source).
Still inside 🛠️ STRATEGY locate the 🔌𝐒𝐢𝐠𝐧𝐚𝐥 🛈 input and choose the plotted output of your SI. The option should look like: "<SI short title>:🔌Signal to TTS" .
Verbose troubleshooting & tips
If the SI does not appear in the 🔌Signal 🛈 selector, confirm both scripts are added to the same chart and the SI exposes a plotted series (title often "🔌Signal to TTS").
When using multiple SIs, pick the SI instance that actually outputs the "🔌Signal to TTS" plotted series.
Validate on the chart: when your SI changes state, the plotted "🔌Signal" series in the TTS (visible in the data window) should change accordingly.
The TTS accepts only signals that follow the tts_convention DealConditions structure. Do not attempt to feed arbitrary scalar series without using conv.getDealConditions / conv.DealConditions.
Make sure your SI composes a DealConditions value following the TTS convention (startLong, endLong, startShort, endShort — optional cancel fields). See the template below.
If the plot is present but TTS does not react, ensure the SI plot is non-repainting (or accept realtime/backtest limitations). Test on historical bars first.
Create alerts on the strategy (see the Alerts section). Use the {{strategy.order.alert_message}} placeholder in the Create Alert dialog to forward TTS messages.
💢 How to create a custom trading logic ❓
The "Template Trailing Strategy (Backtester)" provides two ways to plug in your custom trading logic. Both of them have their advantages and disadvantages.
✍️ Develop your own Customized "Signal Indicator" 💥
The first approach is meant to be used for relatively more complex trading logic. The advantages of this approach are the full control and customization you have over the trading logic and the relatively simple configuration setup by having two scripts only. The downsides are that you have to have some experience with pinescript or you are willing to learn and experiment. You should also know the exact formula for every indicator you will use since you have to write it by yourself. Copy-pasting from existing open-source indicators will get you started quite fast though.
The idea here is either to create a new indicator script from scratch or to copy an existing non-signal indicator and make it a "Signal Indicator". To create a new script, press the "Pine Editor" button below the chart to open the "Pine Editor" and then press the "Open" button to open the drop-down menu with the templates. Select the "New Indicator" option. Add it to your chart to copy an existing indicator and press the source code {} button. Its source code will be shown in the "Pine Editor" with a warning on top stating that this is a read-only script. Press the "create a working copy". Now you can give a descriptive title and a short title to your script, and you can work on (or copy-paste) the (other) indicators of your interest. Once you have the information needed to decide, define a DealConditions object and plot it like this:
import jason5480/tts_convention/ as conv
// Calculate the start, end, cancel start, cancel end conditions
dealConditions = conv.DealConditions.new(
startLongDeal = ,
startShortDeal = ,
endLongDeal = ,
endShortDeal = ,
cnlStartLongDeal = ,
cnlStartShortDeal = ,
cnlEndLongDeal = ,
cnlEndShortDeal = )
// Use this signal in scripts like "Template Trailing Strategy (Backtester)" and "Signal Composer" that can utilize its value
// Emit the current signal value according to the TTS framework convention
plot(series = conv.getSignal(dealConditions), title = '🔌Signal to TTS', color = #808000, editable = false, display = display.data_window + display.status_line, precision = 0)
You should import the latest version of the tts_convention library and write your deal conditions appropriately based on your trading logic and put them in the code section shown above by replacing the "…" part after "=". You can omit the conditions that are not relevant to your logic. For example, if you use only market orders for entering and exiting your positions the cnlStartLongDeal, cnlStartShortDeal, cnlEndLongDeal, and cnlEndShortDeal are irrelevant to your case and can be safely omitted from the DealConditions object. After successfully compiling your new custom SI script add it to the same chart with the TTS by pressing the "Add to chart" button. If all goes well, you will be able to connect your "signal" to the TTS as described in the "How to connect a "signal" from a "Signal Indicator"?" guide.
🧩 Adapt and Combine existing non-signal indicators 💥
The second approach is meant to be used for relatively simple trading logic. The advantages of this approach are the lack of pine script and coding experience needed and the fact that it can be used with closed-source indicators as long as the decision-making part is displayed as a line in the chart. The drawback is that you have to have a subscription that supports the "indicator on indicator" feature so you can connect the output of one indicator as an input to another indicator. Please check if your plan supports that feature here
To plug in your own logic that way you have to add your indicator(s) of preference in the chart and then add the "Signal Adapter" script in the same chart as well. This script is a "Signal Indicator" that can be used as a proxy to define your custom logic in the CONDITIONS group of the "Settings/Inputs" tab after defining your inputs from your preferred indicators in the VARIABLES group. Then a "signal" will be produced, if your logic is simple enough it can be directly connected to the TTS that is also added to the same chart for execution. Check the "How to connect a "signal" from a "Signal Indicator"?" in the "🤔 How to Guide" for more information.
If your logic is slightly more complicated, you can add a second "Signal Adapter" in your chart. Then you should add the "Signal Composer" in the same chart, go to the SIGNALS group of the "Settings/Inputs" tab, and connect the "signals" from the "Signal Adapters". "Signal Composer" is also a SI so its composed "signal" can be connected to the TTS the same way it is described in the "How to connect a "signal" from a "Signal Indicator"?" guide.
At this point, due to the composability of the framework, you can add an arbitrary number (bounded by your subscription of course) of "Signal Adapters" and "Signal Composers" before connecting the final "signal" to the TTS.
💢 How to set up ⏰Alerts ❓
The "Template Trailing Strategy (Backtester)" provides a fully customizable per-event alert mechanism. This means that you may have an entirely different message for entering and exiting into a position, hitting a stop-loss or a take-profit target, changing trailing targets, etc. There are no restrictions, and this gives you great flexibility.
First enable the events you want under the "🔔 ALERT MESSAGES" module. Each enabled event exposes a text area where you can craft the message using placeholders that TTS replaces with actual values when the event occurs.
The placeholder categories (exact names used by the script) are:
Chart & instrument:
{{ticker}}
{{base_currency}}
{{quote_currency}}
Entry / exit / stop / TP prices & offsets:
{{entry_price}}
{{exit_price}}
{{stop_loss_price}}
{{take_profit_price_1}} ... {{take_profit_price_5}}
{{entry+_price}}, {{entry-_price}}, {{exit+_price}}, {{exit-_price}} — Optional offset helpers (computed using "Offset Ticks")
Quantities, percents & derived quantities:
{{entry_base_quantity}} — base units at entry (e.g. BTC)
{{entry_quote_quantity}} — quote amount at entry (e.g. USD)
{{risk_perc}} — % of capital risked for that entry (multiplied by 100 when "Percentage Range " is enabled)
{{remaining_quantity_perc}} — % of the initial position remaining at close/SL
{{remaining_base_quantity}} — remaining base units at close/SL
{{take_profit_quantity_perc_1}} ... {{take_profit_quantity_perc_5}} — % sold/bought at each TP
{{take_profit_base_quantity_1}} ... {{take_profit_base_quantity_5}} — base units closed at each TP
❗ Important: the per-event alert text is injected into the Create Alert dialog using TradingView's strategy placeholder:
{{strategy.order.alert_message}}
During the creation of a strategy alert, make sure the placeholder {{strategy.order.alert_message}} exists in the "Message" box. TradingView will substitute the per-event text you configured and enabled in TTS Settings/Inputs before sending it via webhook/notification.
Tip: For webhook/broker execution, set the proper "Condition" in the Create Alert dialog (for changing-entry/exit/SL notifications use "Order fills and alert() function calls" or "alert() function calls only" as appropriate).
💢 How to execute my orders in a broker ❓
To execute your orders in a broker that supports webhook integration, you should enable the appropriate alerts in the "Template Trailing Strategy (Backtester)" first (see the "How to set up Alerts?" guide above). Then you should go to the "Create Alert/Notifications" tab check the "Webhook URL" and paste the URL provided by your broker. You have to read the documentation of your broker for more information on what messages are expected.
Keep in mind that some brokers have deep integration with TradingView so a per-event alert approach might be overkill.
📑 Definitions
This section tries to give some definitions in terms that appear in the "Settings/Inputs" tab of the "Template Trailing Strategy (Backtester)"
💢 What is Trailing ❓
Trailing is a technique where a price target follows another "barrier" price (usually high or low) by trying to keep a maximum distance from the "barrier" when it moves in only one direction (up or down). When the "barrier" moves in the other direction the price target will not change. There are as many types of trailing as price targets, which means that there are entry trailing, exit trailing, stop-loss trailing, and take-profit trailing techniques.
💢 What is a Moonbag ❓
A Moonbag in a trade is the quantity of the position that is reserved and will not be exited even if all take-profit targets defined in the strategy are hit, the quantity will be exited only if the stop-loss is hit or a close signal is received. This makes the stop-loss trailing technique in a trend-following strategy a good candidate to take advantage of a Moonbag.
💢 What is Distance ❓
Distance is the difference between two prices.
💢 What is Bias ❓
Bias is a psychological phenomenon where you make decisions based on market sentiment. For example, when you want to enter a long position you have a long bias, and when you want to exit from the long position you have a short bias. It is the other way around for the short position.
💢 What is the Bias Distance of a price target ❓
The Bias Distance of a price target is the distance that the target will deviate from its initial price. The direction of this deviation depends on the bias of the market. For example, suppose you are in a long position, and you set a take-profit target to the local highest high. In that case, adding a bias distance of five ticks will place your take-profit target 5 ticks below this local highest high because you have a short bias when exiting a long position. When the bias is long the bias distance will be added resulting in a higher target price and when you have a short bias the bias distance will be subtracted.
⚙️ Settings
In the "Settings/Inputs" tab of the "Template Trailing Strategy (Backtester)", you can find all the customizable settings that are provided by the framework. The variety of those settings is vast; hence we will only scratch the surface here. However, for every setting, there is an information icon 🛈 where you can learn more if you mouse over it. The "Settings/Inputs" tab is divided into ten main groups. Each one of them is responsible for one module of the framework. Every setting is part of a group that is named after the module it represents. So, to spot the module of a setting find the title that appears above it comes with an emoji and uppercase letters. Some settings might have the same name but belong to different modules e.g. "Tgt Dist Mtd" (Target Distance Method). Some settings are indented, which means that they are closely related to the non-indented setting above. Usually, indented settings provide further configuration for one or more options of the non-indented setting above. The groups that correspond to each module of the framework are the following:
🗺️ Quick Module Cross-Reference (use emojis to jump to setting groups)
📆 FILTERS — session, date & weekday filters
🛠️ STRATEGY — internal vs external deal-conditions; pick the signal source
🔧 STRATEGY – INTERNAL — built-in Two MA logic for demonstration purposes
🎢 VOLATILITY — ATR / StDev update modes
🔷 ENTRY — entry order types & trailing
🎯 TAKE PROFIT — multi-step TP and trailing rules
🛑 STOP LOSS — stop placement, move-to-breakeven, trailing
🟪 EXIT — exit order types & cancel logic
💰 QUANTITY/RISK MANAGEMENT — position sizing, moonbag, limits
📊 ANALYTICS — stats, streaks, seasonal tables
🔔 ALERT MESSAGES — per-event alert templates & placeholders
😲 Caveats
💢 Does "Template Trailing Strategy (Backtester)" have repainting behavior? ❓
The answer is that the "Template Trailing Strategy (Backtester)" does not repaint as long as the "Signal Indicator" that is connected also does not repaint. If you developed your own SI make sure that you understand and know how to prevent this behavior. The publication by @PineCoders here will give you a good idea on how to avoid most of the repainting cases.
⚠️ There is an exception though, when the "Enable Trail⚠️💹" checkbox is checked, the Take Profit trailing feature is enabled, and a tick-based approach is used, meaning that after a while, when the TradingView discards all the real-time data, assumptions will be made by the backtesting engine that will cause a form of repainting. To avoid making false assumptions please disable this feature in the early stages and evaluate its usefulness in your strategy later on, after first confirming the success of the logic without this feature. In this case, consider turning on the bar magnifier feature. This way you will get more accurate backtest results when the Take Profit trailing feature is enabled.
💢 Can "Template Trailing Strategy (Backtester)" satisfy all my trading strategies ❓
While this framework can satisfy quite a large number of trading strategies there are cases where it cannot do so. For example, if you have a custom logic for your stop-loss or take-profit placement, or if you want to dollar cost average, then it might be better to start a new strategy script from scratch.
⚠️ It is not recommended to copy the official TTS code and start developing unless you are a Pine wizard! Even in that case, there is a stiff learning curve that might not be worth your time. Last, you must consider that I do not offer support for customized versions of the TTS script and if something goes wrong in the process you are all alone.
💝 Support & Feedback
For feedback, bug reports, or feature requests, contact me via TradingView PM or use the script comments.
Note: The author's personal links and contact are available on the TradingView profile.
🤗 Thanks
Special thanks to the welcoming community members, who regularly gave feedback all those years and helped me to shape the framework as it is today! Thanks everyone who contributed by either filing a "defect report" or asking questions that helped me to understand what improvements were necessary to help traders.
Enjoy!
Jason

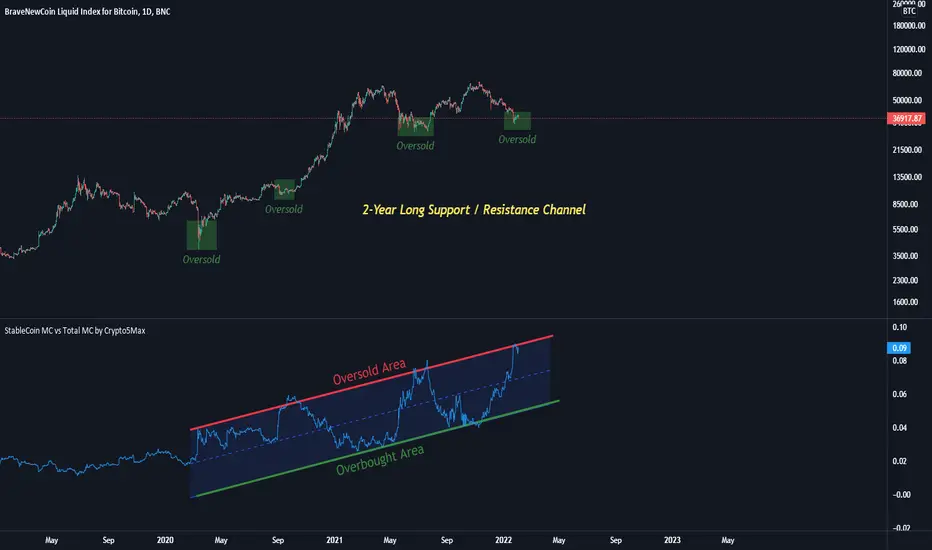
StableCoin MC vs Total MC by Crypto5Max In this indicator you will find the sum of all stable coins (market cap) divided by the total crypto market cap.
I believe there's a positive correlation between stable coins issuance and BTC's(and other coins) price appreciation. Or shortly put, to me the rising levels of stable coins represent increased levels of buying power (and adoption) waiting on the sidelines.
Here, I am taking the total market cap of all stable coins and dividing it by the total crypto market cap to get a ratio. Note, only ~85% of all stable coins are calculated (rest are not on TV), however, it should still be a fairly good representation. Some of the stable coins are already locked in smart contracts for yield farming and what not. I'd also say, there's interesting 2-year long channel that's developing currently. That said, take this indicator with a grain of salt as we still have a limited set of data.
Yours truly
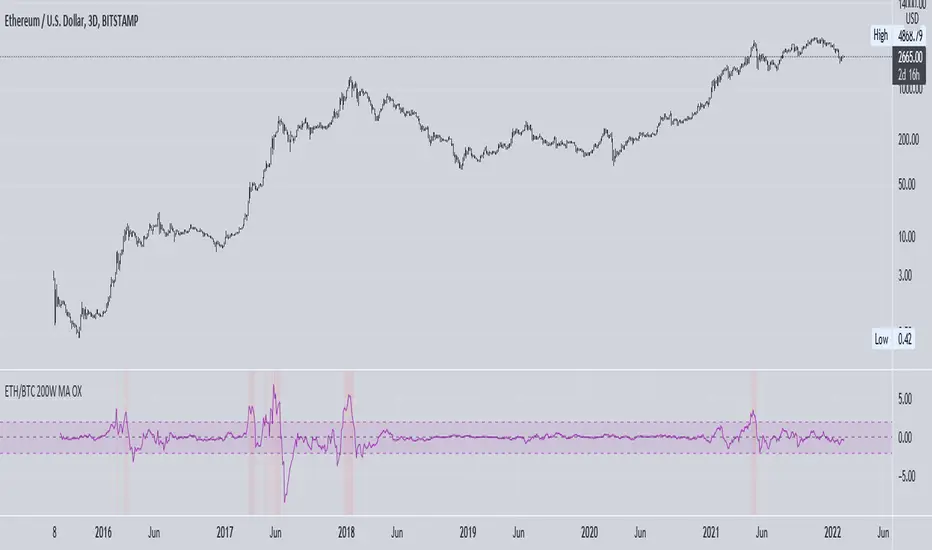
ETH vs BTC 200W SMA OverextensionHistorically, when BTC suffers a correction and ETH continues to rally, this hints at an impending market-wide correction. In Jan 2018, ETH rallies while BTC corrects, signalling the end of the bull cycle. In May 2021, ETH rallies while BTC ranges between $50-$60k, then a major correction occurs. This indicator attempts to monitor this phenomenon in order to help spot potential macro tops in the cryptocurrency market.
The indicator takes the price of the asset and divides it by the 200 week SMA value. This gives an over/undervaluation in percentage terms. When ETH becomes significantly more overvalued relative to BTC, the indicator will warn of a potential top forming (see red shaded areas).
This is for edutainment purposes only. Don't make financial decisions based on this indicator.
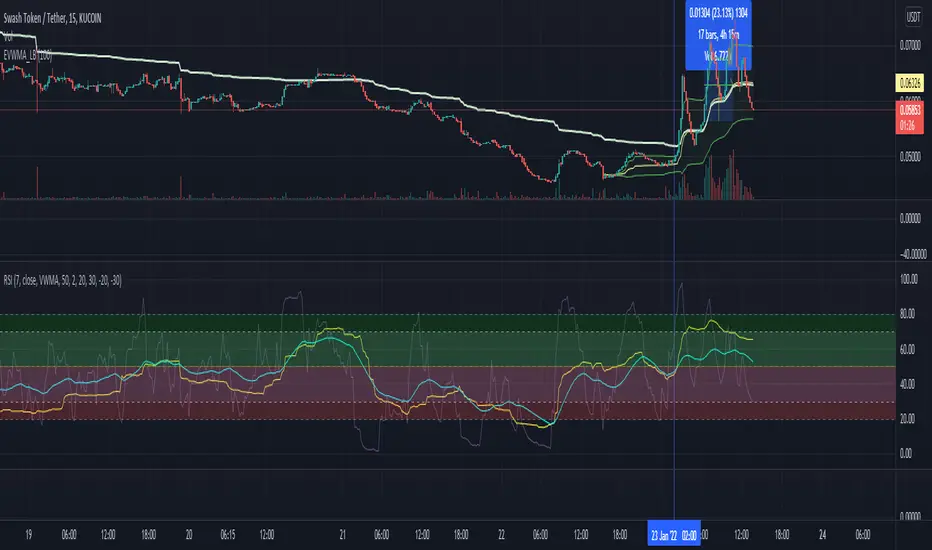
RSI v4 with Bands
Script is extended version of usual RSI script
This script plots VWMA(RSI7) vs EMA(RSI7) under pre-set time frame.
Strategy is to make sure both points remain in the Green zone while entering into BUY position
Use it as indicator not as financial advice.
~ @imbharat
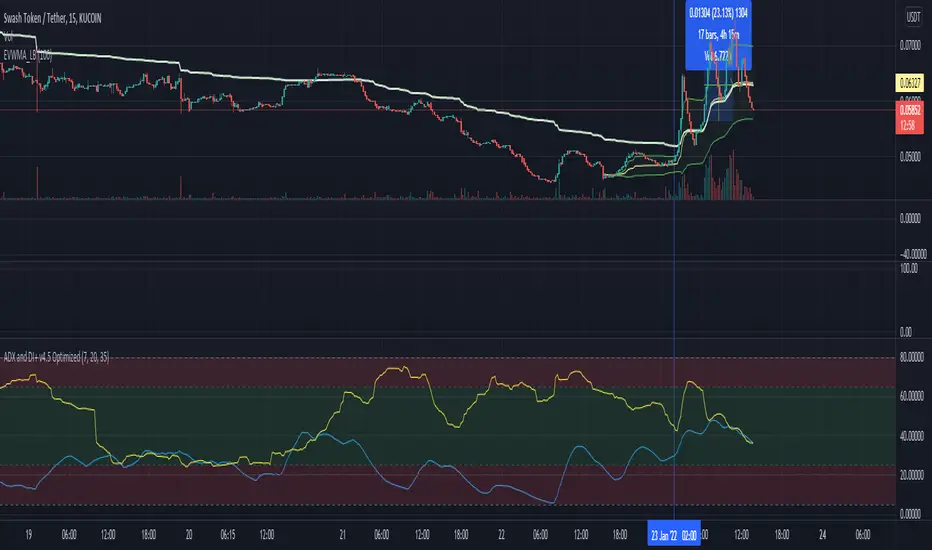
ADX and DI+ v4.5 OptimizedThis script plots VWMA(ADX) vs EMA(DI+) under pre-set time frame.
Feature:
The Main Strategy is to look for potential BUY opportunity (Intraday trading, Session trading, Swing) when EMA(DI+) colored blue, entering upward into Green zone where ADX counterpart (default colored: Yellow) is also present.
Formula plot is also helpful to understand upcoming downtrend signal when both blue and yellow lines try to make diverted bifurcation like pattern on graph.
Disclaimer - This is an indicator script and not final Buy and Sell advice.
* Originally developed by © BeikabuOyaji and further extended & optimized by Bharat @imbharat to serve above features
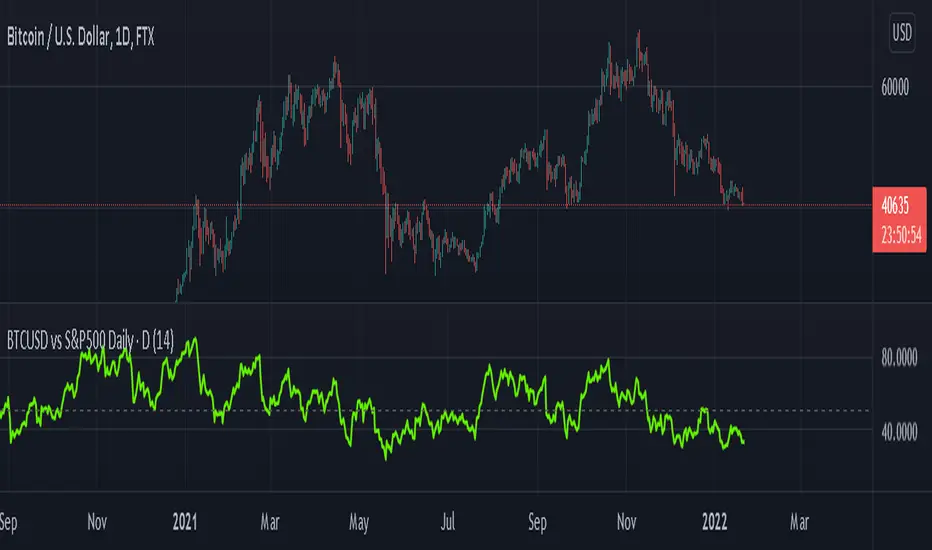
BTCUSD vs S&P500 (Daily)This script plots an RSI of the difference between the BTCUSD (FTX) and S&P 500 (FRED) prices, useful to see how the BTCUSD price correlates to the stock market.
This works in the daily timeframe only (because the S&P 500 can only be sampled on this timeframe). You can try lower timeframes but they will be gapped / interpolated.
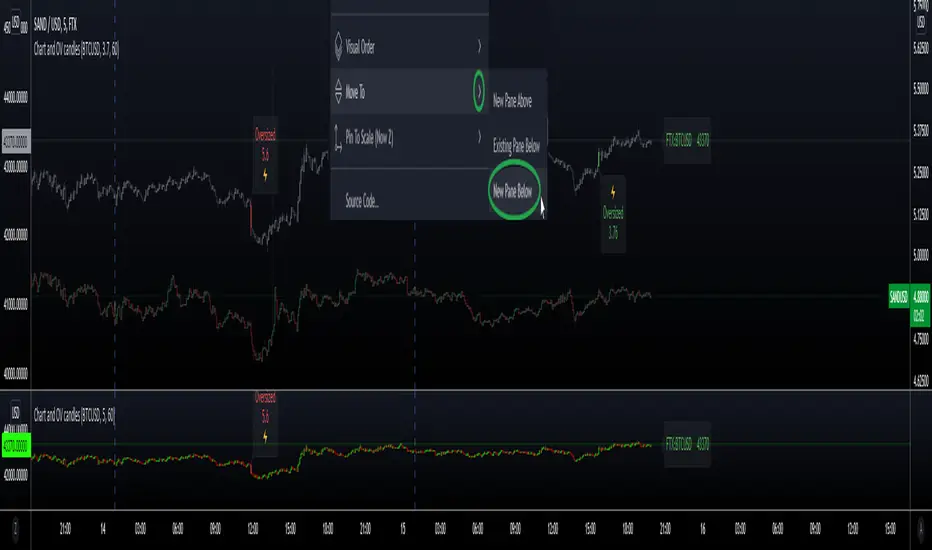
Secondary Chart with OverSized CandlesHi everyone, I'm sharing a simple script I made for a friend. He was looking for a way to add another asset to his chart, and monitor relevant movements \ spot eventual correlation, especially when trading Cryptocurrencies.
We couldn't find a similar script already available so here it is - the code is commented and I hope it's clear enough :)
Notes:
- The parameter scale = scale.left keeps the scales separated and therefore the chart is more organized, otherwise the chart would appear flat if the price difference is too big (e.g. BTC vs XRP)
- It is possible to have the script running in a separate panel (instead of overlay) by moving it to a new pane (when added to the chart) or by removing the parameter overlay = true at the beginning of the code.
- In case you wish to add indicators to this sub-chart (e.g. Bollinger Bands, EMA, etc..) you can do that by adding the relevant code and feed it with the variables OPEN \ HIGH \ LOW \ CLOSE as well as using the same method to retrieve new variables from the target asset with the request.security function.
Hope this comes handy.
Val - Protervus
Spread CRYPTO USDT VS PERPSimple spread script.
Calculate the difference between USDT and USDTPERP for major exchanges.
For use only with USDT charts
Works with all crypto if a future contract exists.
Upcoming updates

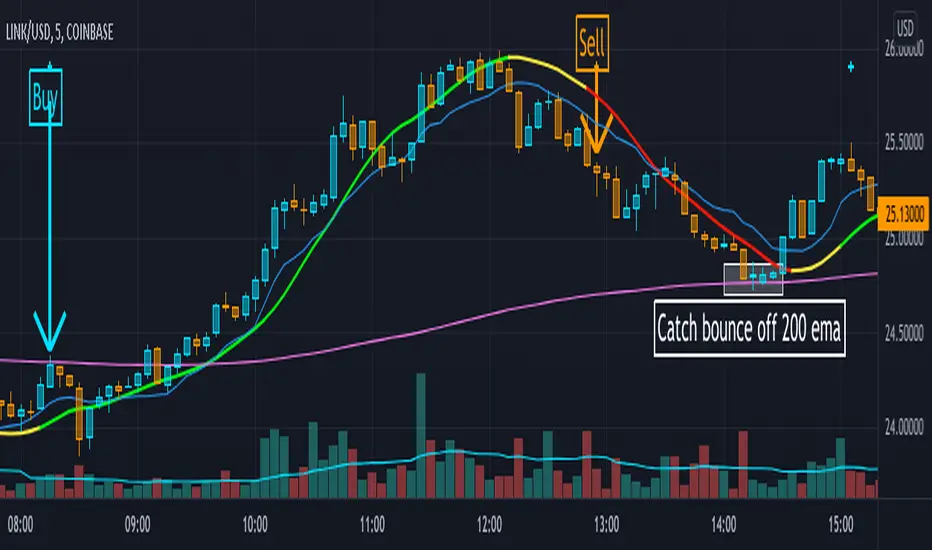
BUY/SELL SIGNALS from LSMA/ALMA/HMAThis indicator uses the Least Squares Moving Average (LSMA) in tandem with the Arnaud Legoux Moving Average (ALMA) and Hull Moving Average (HMA) to generate buy-sell signals, represented by the light blue and orange crosses respectively.
The yellow lines produced by the indicator show periods of market uncertainty and possible reversal, and a modified, user-defined VWAP is given along with a 200 EMA. The point of this indicator was to create a smoother, more visually appealing moving-average, price action-based indicator when compared to the trend-step and simple moving average indicators available. This indicator uses a fast (25 period) LSMA coupled with a slower (50 period) HMA and ALMA in order to make signals both smooth and fast.
This indicator will work on all markets, except the modified VWAP will naturally not function if the volume is unpublished for that market. Use of this indicator will be very strong in trending markets, as the yellow line will spot possible reversals quite early, meaning the trader can be ready early for the buy/sell signal to appear. Use of this indicator in sideways market conditions will be limited, as it is for all moving average-based indicators, but the damage will be minimal as bad trades will be quickly realized by the indicator and the color will switch to yellow, this is possible because of the settings differences between the period lengths of the LSMA vs the ALMA + HMA.
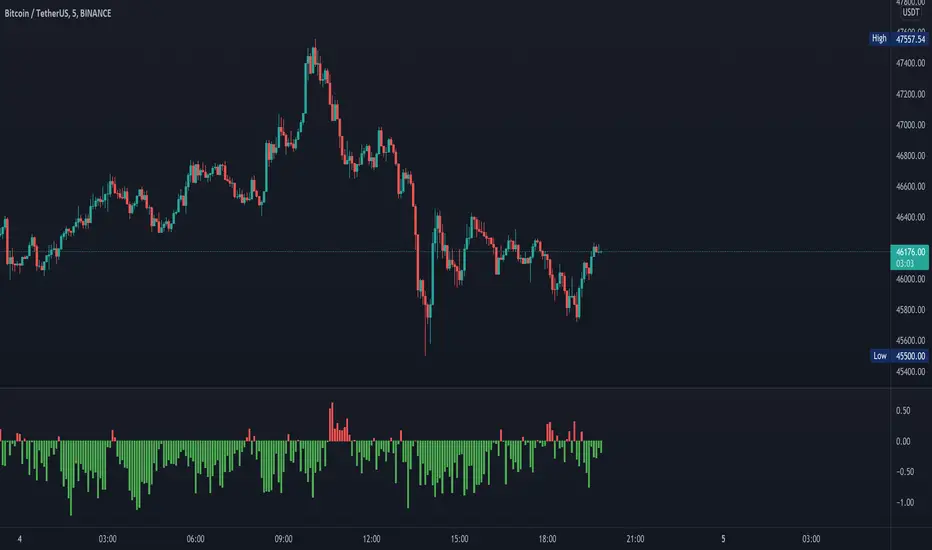
BarRange vs VolumeThis is a volume spread analysis/ breadth type indicator.
Compares average bar size to the average volume. Looks for small bar and high volume.
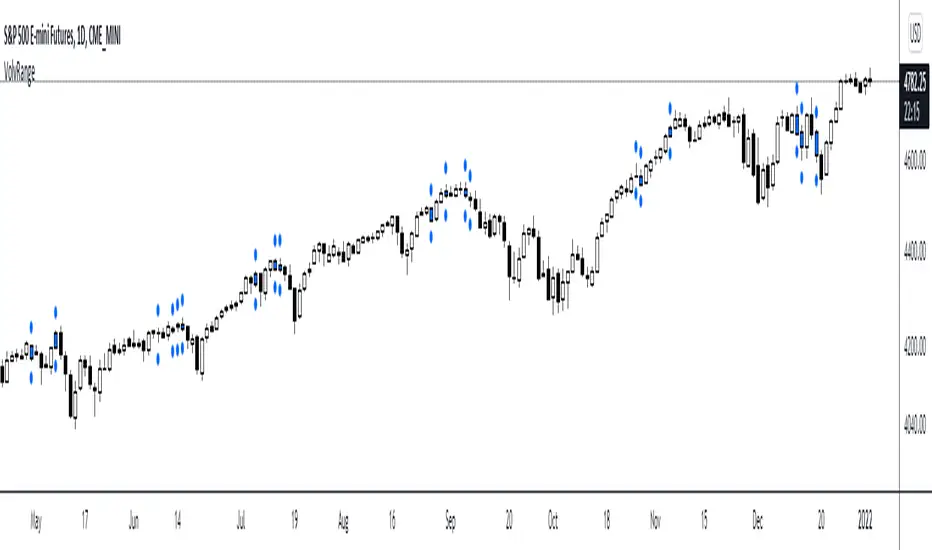
Percentage Levels by TimeframePlots the positive and negative percentage levels from a selection of timeframes and sources for any ticker. You can use this within a pullback trading system. For example, if you historically look at the average pullback of large cap stocks and ETF's, you can use this indicator to plot the levels it could pullback to for an entry to go long. It can be used as potential targets when trading a ticker short. Another use for this is to backtest the set percentage targets using TradingView's bar replay feature to see how ETF's and large cap stocks have reacted at these levels. Note: This is intended to be used at timeframes equal to higher than the chart's as it may cause re-painting issues.
Currently percentage levels are statically set to 1, 3, 5, 10, 15, 20, 25, and 30% levels above and below the chosen source (open, high, low, close). You can also display the data based on timeframes from Daily (1D) all the way up to Yearly (12M)
*Not financial advice but in my opinion the current percentage levels set (see above) are best used for ETF's and Large Cap Stocks.
Jan 2
Release Notes: Added the ability to select the historical bars to look back when plotting levels
Jan 2
Release Notes: To get a better display or proper resolution on your charts, change the view settings to "Scale Price Chart Only"
Jan 2
Release Notes: To add % labels for this indicator on the price axis, change your chart settings to include "Indicator Name Label" & "Indicator Last Value". You can find this under the Label section after hitting the gear icon in the bottom right of your chart.
Jan 2
Release Notes: Added: Custom Line Plot Extension Settings. Ideally both values should be equal to display optimal extended lines. To return to a base setting: '1' = Historical Lookback & '0' = Offset Lines. Also note this is dependent on the timeframe you are viewing on the chart.
Jan 2
Release Notes: Removed indicator from example chart that was not needed.
Jan 2
Release Notes: Updated some comments in the Pine Script
Jan 2
Release Notes: Update: Added commentary and instructions in the indicator settings to address recommended line plot settings for Stocks/ETF's vs Futures
Jan 2
Release Notes: Changed title from "Calculation Method" to "Calculation Source"
Jan 4 2021
Normal use of security() dictates that it only be used at timeframes equal to or higher than the chart's as it may cause re-painting

200DMA last DOM - ajhImplements and backtests a simple 200 day moving average trend following rules based on last day of month to limits trades to 12 per year.
From the book : 5 BEST Moving Average Strategies (That beat buy and hold) by Steve Burns and Holly Burns
Click on the cog to set the input date range eg; 2000-01-01 to 2016-12-31
The book back tested SP500 returns from 2000-2016 317% using this method vs 125% buy and hold only with less drawdown.
Simple 200 day moving average test and trading on last day of month.
(you may find it trades on next available day close to end of month as not all dates can be traded weekends etc..)
Rules are ;
1. if last day of month and stock over 200 day moving average, then go long 100%
2. if last day of month and stock under 200 day moving average, then close long 100% and goto cash.
Aims to miss market declines and keep you long for upside.
Note: Have found doesn't work well in choppy markets moving sideways like the FTSE100 for same period 2000-2016 and causes losses. Also for many stocks.

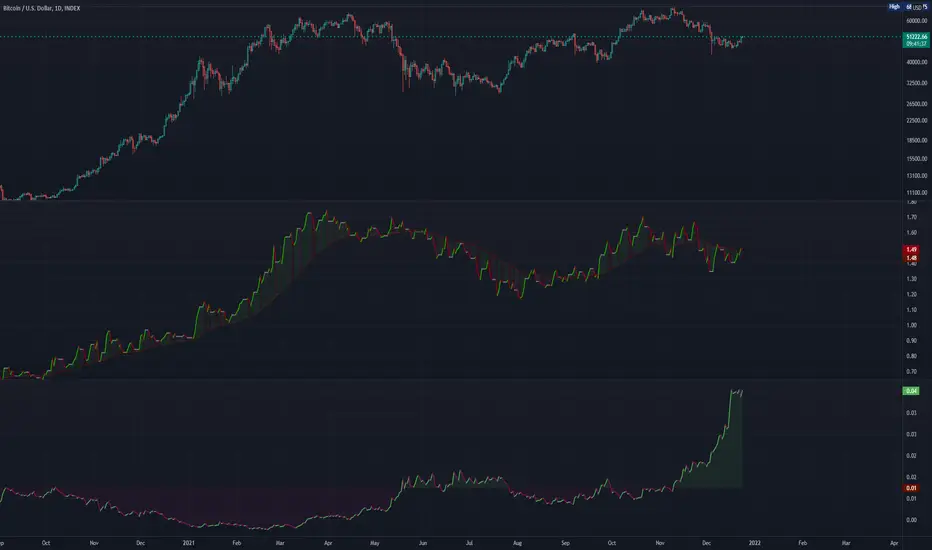
Abz Bonds/BTC divergenceDraft release: This indicator shows the comparative returns from US bonds vs BTC.
I was inspired by this Twitter thread: twitter.com
If you compare the price action of Bitcoin against bond returns over the last year, there's an extraordinary degree of correlation. This may give insights into what's coming next for BTC , but at some point the relationship will inevitably break down. In the meantime, there's much to gain.
DYOR.
Feedback welcome though it may take a while for me to respond.
[mdeacey] EMA% Channel + BB Range StrategyThis strategy is based off the users selection of an EMA and percentage defined channel. The strategy longs when a red "reversal candle" (that exceeds the averages of 3 and 9 above the EMA 3) is found until such time that either the price goes outside the Bollinger Band or the green reversal candle is found. The same but opposite process for shorts. If the price begins trending and moves outside the channel all trades are exited to prevent loss.
For trending markets the sister strategy (" EMA% Channel + Bollinger Band Trending Strategy") should instead be used.
The obvious fallback to this strategy is that:
- If the bands are too wide we don't have a good definition of trending vs ranging and the price can move up/down significantly and trend whilst remaining within the ranging channel. We try to mitigate this through use of a stoploss defined by ATR and a pretty tight channel. This is a tightrope exercise as making the percentage channels tighter misses earlier entries in optimal cases. Change the parameters to find an EMA and percentages to find the best R/R in your case.
Potential further iteration:
- It would be good to see if the R/R changes positively if we only allow shorts above the EMA and longs below it.
All options are configurable and code open source. Happy trading!

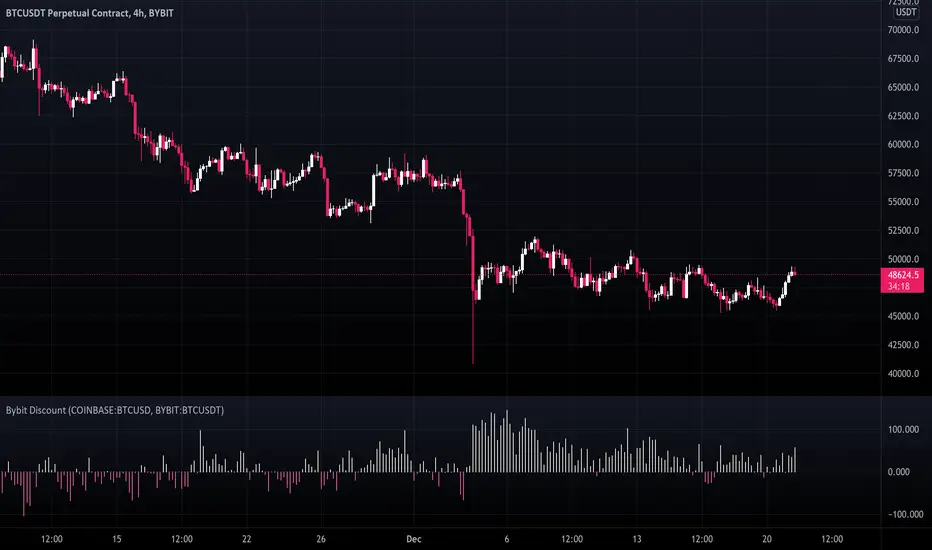
Bybit perp discount vs Coinbase BTCThis indicator shows the discount Bybit BTC perp is trading at relative to Coinbase.
Relative Strength vs SPY - real time & multi TF analysisOne of the most requested features for TradingView is the ability to include custom indicators in the stock market scanner. While I am sure this feature is coming soon (seriously TV, PLEASE) I decided to use the amazing template provided by QuantNomad (), but I wanted to allow the user to modify the table a bit better so that a multi time frame analysis approach could be used.
The recommended way to use this indicator is to apply it three times to your chart. For each instance, assign it a plotting location (left, center, right) and choose the timeframe you wish to use for the RS analysis. By default, the relative strength of all 39 pre selected stocks will be compared against SPY, on the 5 min timeframe. I personally like having this chart on the left, then the 4 hour timeframe in the center, and the daily on the right. Not only does this setup allow you to see the relative strength/weakness of 39 stocks in real time (the one on the left), but you have all the information in front of you including how the stock has been performing relative to SPY on the 4H and D charts.
To make it easiest to read, you should disable all visual elements to the chart you are applying this indicator to. By minimizing the chart and putting it by your side, you can see the bigger picture on how all your stocks are behaving relative to the market.
If you wish to change any of the stocks I have pre selected, make sure to save your chart template. Otherwise you would need to do this every time you load the indicator to your chart which would be incredibly time consuming.

:: Magic Osc The "Magic Oscillators" indicator is based on 4 points:
1. RSI with MA filter
2. A logarithmic MA of the price
3. A “squeeze” of the price (points on the “0” line and the light blue background)
4. The up and down signals, which indicate the trend direction, based on the price vs EMA 50 relationship.
Extra - A "long term" filter with input signal - again MA.
All values are possible to adjust to needs/setup.
The indicator is only to help in quicker and more effective technical analysis and not as entry/exit trading signals.
The indicator can be used and the code modified depending on the interests of each trader.
Good trades...

ATR vs Daily DeltaThis indicator follows the idea of the average true range indicator, but splits red candles from green candles. It also displays daily deltas as a histogram chart. Finally, it allows you to "normalize" the indicator, which displays period percentage moves (shown in decimal form) instead of period deltas, and calculates the ATR from those percentages instead of period deltas.

Half-Pi Cycle CKB top indicator (insanely experimental)This is an insanely experimental script. It's a modified version of the Bitcoin pi-cycle top indicator.
It changes the Bitcoin pi-cycle top formula by halving the number of days in the two DMAs used in calculation, from 350/111 to 175/56. So I call it the half-pi cycle. It correctly picked the top of CKB (Nervos Network) vs USDT on Huobi in spring 2021 within three days.
It probably is a coincidence, and could very easily not pick the next cycle peak correctly at all. Using such a short number of days makes it a little dubious, but I had no choice since there's only so much price history for this coin. I strongly advise you to not make any trades based on this script ! I cannot be held accountable if you lose money due to this script. It hasn't been shown to be accurate multiple times like the Bitcoin pi-cycle top indicator. I simply find this interesting and want to see if it works next time.

Instrument-Z (3Commas Bot)Instrument-Z is what I am currently using as my 3Commas Bot.
It allows you to customize signals from 3 indicators; Crossing MA's, Stochastic RSI, and WaveTrend.
Better yet, it allows you to setup these signals separately depending on whether the Trend MA is going up or down.
So there are 2 sets of inputs for everything, Uptrend inputs and Downtrend inputs.
I have realized that we can't expect a strategy to work the same way in an uptrend vs downtrend, so the inputs should be separated too.
In my testing, separating increased the net profit by 60% on average.
You can select whether you are trading Long or Short.
You can choose your stop loss and take profit levels as well as trade expiration.
You can choose if you only want to trade with the trend (making the opposing signals irrelevant).
The trend is based on the Trend MA.
This script is specifically for cryptocurrencies.
I've noticed that MA crosses on other asset classes are unreliable because the fluctuations are not strong enough to push the MA's across each other in a meaningful way.
If you want to use this as a 3Commas Bot, then you will have to copy the code of the strategy and paste it into your own personal script.
Then you have to change the alert messages at the bottom of the script.
Make sure to change your alert message from this;
{"message_type": "bot", "bot_id": 0000000, "email_token": "0b000a0a-0aa0-00aa-0aa0-000a00000a0a", "delay_seconds": 0}
To this;
{\n\"message_type\": \"bot\",\n\"bot_id\": 0000000,\n\"email_token\": \"0a000a0a-0aa0-00aa-0aa0-000a00000a0a\",\n\"delay_seconds\": 0\n}
With \n after each new line and \ before each quotation.
In the Alert setup, select "alert() function calls only".
This indicator is like a middle ground of complexity between the Juicy Trend indicator and the Instrument-A indicator.
And because it does not feature my neural network project, I have made it open script.
Enjoy!

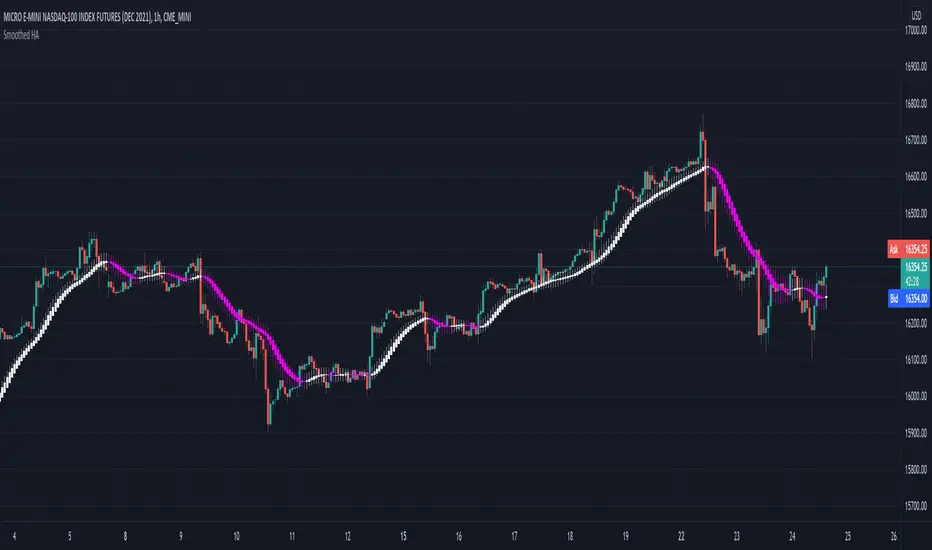
Smoothed Heiken Ashi - SamXThis is my version of the Smoothed Heiken Ashi indicator. While there are a few versions of these out there (most notably "Modified Smoothed Heiken Ashi" by badshah_e_alam and "Smoothed Heiken Ashi Candles v1" by jackvmk), none matched what I was looking for.
1. All had hard-coded the smoothing to use the EMA calculation - in this indicator, these are user-configurable
2. Both applied the double-smoothing principle (Take a moving-average of price, apply the Heiken Ashi conversion, then apply a second moving average to the smoothed Heiken Ashi candles to calculate new candles). While this is the most common approach, I had a few issues with this:
Even if setting both moving average lengths to 1, the indicator did not correctly calculate what should be the actual corresponding Heiken Ashi candle values (as compared to the built-in Heiken Ashi chart on Tradingview)
They were inconsistent in operating on different chart types - indicator values for the same candle can differ between using a base Heiken Ashi or Renko chart vs a standard Candle or Bar chart.
I wanted the ability to easily enable/disable the second smoothing (which is now a configuration option)
I wanted the ability to configure different moving-average calculations for each smoothing iteration (e.g. EMA for the initial smoothing, and Smoothed Moving Average for the second smoothing)
3. Many of the inputs were not clearly or properly defined in the settings window - this script has far more refined user input settings, put in logical groupings, and with relevant help text.
4. Enhanced some visual styling (and added to the Settings) to make it easier for the user to enable/disable printing candle wicks, as well as customizing the bullish / bearish bar colors
5. Added alerts for bar color change to help users catch potential trend reversals
Reference paper on the original Smoothed HA formulas: www.researchgate.net
Reference on the more common implementation formulas (using double-smoothing): www.sierrachart.com