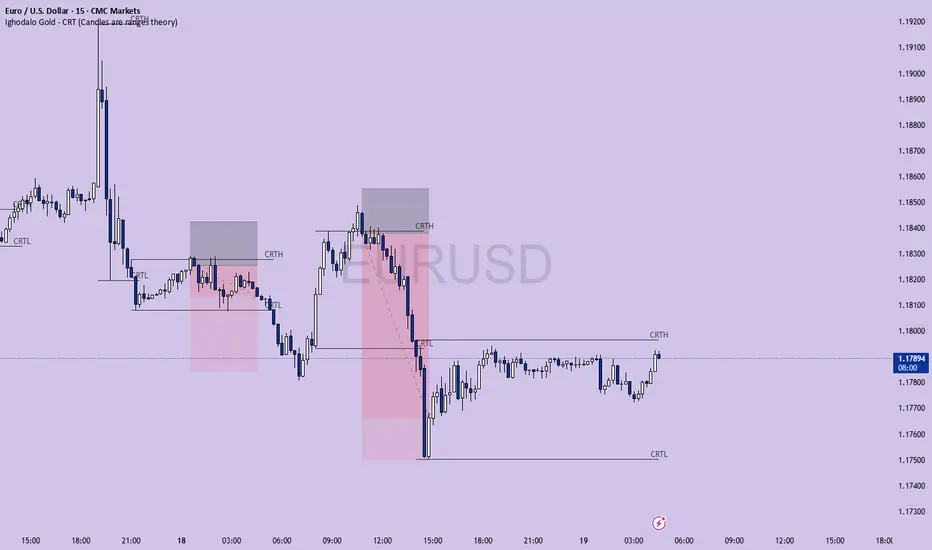
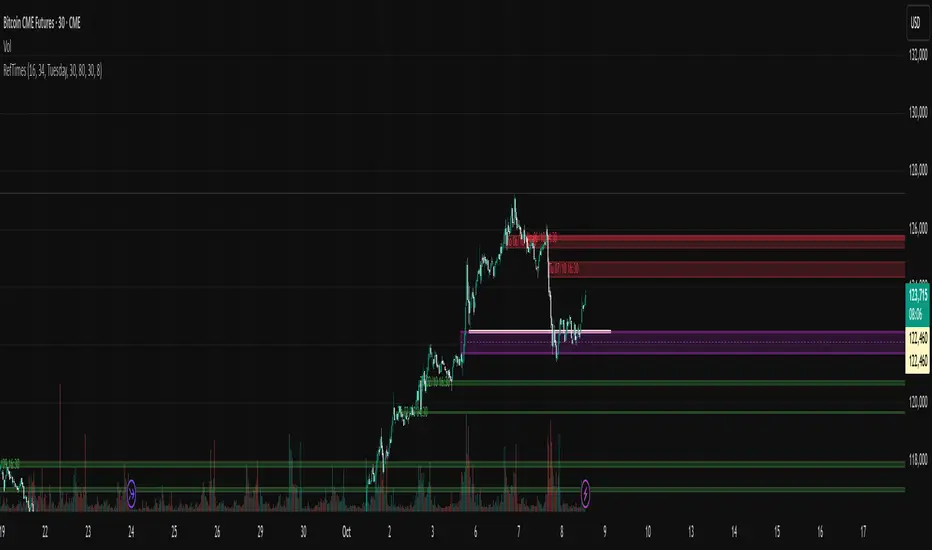
Ighodalo Gold - CRT (Candles are ranges theory)This indicator is designed to automatically identify and display CRT (Candles are Ranges Theory) Candles on your chart. It draws the high and low of the identified range and extends them until price breaks out, providing clear levels of support and resistance.
The Candles are Ranges Theory (CRT) concept was originally developed and shared by a trader named Romeotpt (Raid). All credit for the trading methodology goes to him. This indicator simply makes spotting these specific candles easier.
What is a CRT Candle & How Is It Used?
A CRT candle is a single candle that has both the highest high AND the lowest low over a user-defined period. It is identified by analysing a block of recent candles and finding the one candle that contains the entire price range of that block.
Once a CRT candle is formed, its high and low act as an accumulation range.
A break above or below this range is the manipulation phase.
A reclaim of the range (price closing back inside) signifies a potential distribution phase.
On higher timeframes, this sequence can be interpreted as:
Candle 1: Accumulation
Candle 2: Manipulation
Candle 3: Distribution
Reversal (Turtle Soup):
A sweep of the high or low, followed by a quick reclaim (price closing back inside the range), can signify a reversal. According to the theory’s originator, Romeo, this reversal pattern is called “turtle soup.”
After a bearish reversal at the high, the target becomes the CRT low.
After a bullish reversal at the low, the target becomes the CRT high.
How to Use This Indicator
The indicator is flexible and can be adapted to your trading style. The most important settings are:
Max Lookback Period: Number of past candles ("n") the indicator checks within to find a CRT.
CRT Timeframe:
Select a timeframe (e.g., 1H): The indicator will look at the higher timeframe you selected and plot the most recent CRT range from that timeframe onto your current chart. This is useful for multi-timeframe analysis.
Enable Overlapping CRTs:
False (unchecked): Shows only one active CRT range at a time. The indicator won’t look for a new one until the current range is broken.
True (checked): Constantly searches for and displays all CRT ranges it finds, allowing multiple ranges to appear on the chart simultaneously.
Disclaimer & Notes
-This is a visualisation tool and not a standalone trading signal. Always use it alongside your own analysis and risk management strategy.
-All credit for the "Candles are Ranges Theory" (CRT) concept goes to its creator, Romeotpt (Raid).
"On the journey to the opposite side of the range, price often provides multiple turtle soup entry opportunities. Follow their footprints." — Raid, 2025
Search in scripts for "2025年4月8日实时量比大于1的股票有哪些?"
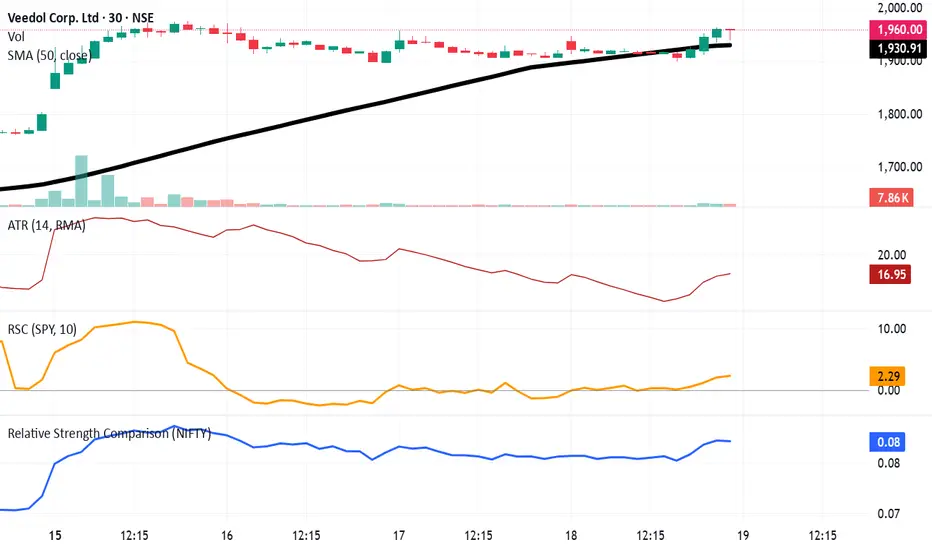
Relative Strength Comparison-NewShRelative Strength Comparison Script created by Shahbaz on 19th Sep 2025
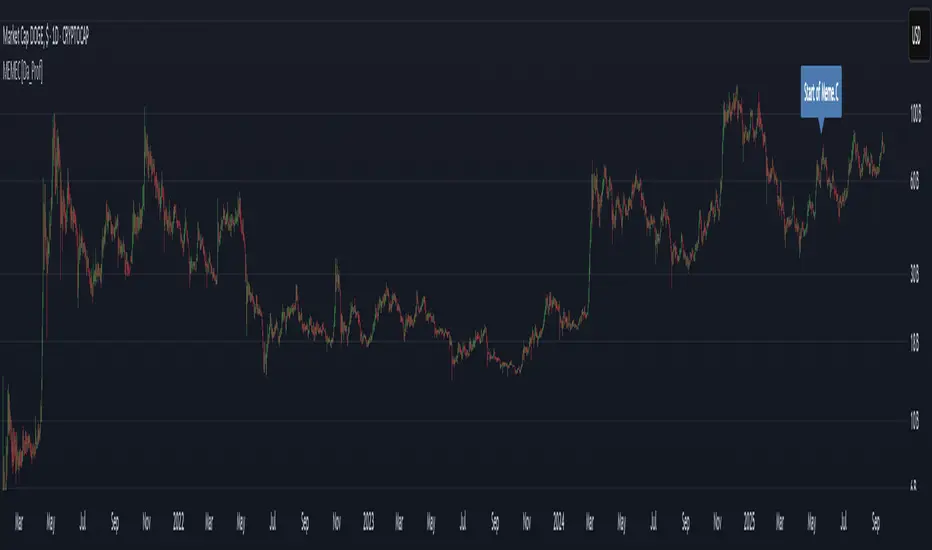
MEMEC - Meme Coin Market Cap [Da_Prof]For this indicator, the meme coin market cap of the top meme coins are added together to get an estimate of the total meme coin market cap back to the first meme coin, DOGE. Meme.C does this natively on TradingView, but its data only goes back to 19 May 2025. For the indicator, MEME.C supersedes the addition of all the individual meme coins (i.e., from 19 May 2025 to present). The start of MEME.C is labeled on the chart by default, but can be removed by deselecting the label in the settings.
After the creation of DOGE, but before data is available for Meme.C, the highest market cap meme coins are added together to estimate the meme coin market cap. The meme coins used by default are DOGE, SHIB, PEPE, BONK, FLOKI, PENGU, TRUMP, SPX6900, FARTCOIN, WIF, M, BRETT, B, MOG, APE, TURBO, DOG, and POPCAT. Users can select if they wish to disregard any or all of these coins. As of the creation of the indicator, DOGE, SHIB, and PEPE have CRYPTOCAP symbols on TradingView. Therefore, the true market cap of these coins is integrated into this indicator. The other meme coin market caps are estimated using price and the circulating supply as of 09/16/2025. I make no claims as to the indicator's exact accuracy. In fact, it isn't exactly accurate since I utilized the circulating supply on the day it was created, so for meme coins that have a changing supply, the market cap will be at least slightly inaccurate. Use this indicator at your own risk.
To use the indicator, it is best to plot overlayed on the CRYPTOCAP:DOGE chart. You can decide whether or not to hide the DOGE market cap.
Heikin FlowHeikin Flow
by Ben Deharde, 2025
Overview
Heikin Flow is a trend and momentum oscillator built on a smoothed reverse-Heikin-Ashi baseline. It quantifies the distance between price and this baseline, then colors the histogram to reflect both direction and acceleration/deceleration. Use it standalone to read trend energy and shifts, or pair it with Heikin Rider for momentum-aware breakout confirmation.
What It Does
Computes a reverse-HA baseline and optionally smooths it with a selectable MA.
Plots a histogram of distance (price minus baseline) to visualize directional pressure.
Colors the histogram by trend state (above/below baseline) and momentum (accelerating vs. decelerating).
Provides alerts on zero-line crosses to spotlight potential momentum regime changes.
The histogram also helps to spot divergence between price and momentum (e.g., price making new highs while the histogram weakens).
How It Works
Reverse-HA Baseline
Heikin Flow derives a “reverse close” value from Heikin Ashi context (using prior HA open/close with current bar range) to capture underlying pressure. This value is range-bounded to avoid extremes, then optionally smoothed. The resulting line acts as a soft directional baseline.
Smoothing (Noise Control)
Choose SMA/EMA/HMA/VWMA/RMA and a length to control baseline responsiveness. Shorter lengths react faster, longer lengths emphasize trend consistency by filtering noise—useful when pairing with breakout tools like Rider.
Trend & Momentum Logic
Trend: If price is above the baseline, the environment is considered uptrend; below indicates downtrend.
Momentum: The change in distance bar-to-bar distinguishes acceleration (growing distance) from deceleration (shrinking distance).
This dual readout helps you see not just direction, but the quality of that direction—strong push vs. weakening move.
Coloring (Aligned with Heikin Rider Palette)
Deep Blue: Uptrend & accelerating
Light Blue: Uptrend & decelerating
Deep Red: Downtrend & accelerating
Soft Orange: Downtrend & decelerating
This mirrors the palette logic from Heikin Rider for immediate visual consistency across the suite.
How to use
Read the histogram above/below zero (price–baseline) as directional bias; watch color changes for momentum context.
Use zero-line crosses as momentum regime shifts; confirm with price action or Heikin Rider breakout signals.
Watch for divergence between price action and the histogram as an early clue of weakening moves.
Adjust smoothing method/length to fit your market and timeframe—faster for scalping, slower to highlight sustained trends.
Inputs
Smoothing Type & Length for the baseline (SMA/EMA/HMA/VWMA/RMA)
Info Box toggles (display and formatting)
Live Mode option for real-time vs. confirmed-bar behavior (avoids inadvertent lookahead)
Originality
Heikin Flow adapts the HA-driven methodology to an oscillator that focuses on distance-to-baseline and momentum quality, using a reverse-HA construction and flexible MA smoothing—complementing Heikin Rider’s smoothed HA envelope breakout design for a cohesive, momentum-aware workflow.
Alerts
Bullish Heikin Flow Cross — distance crosses above 0 (on bar close)
Bearish Heikin Flow Cross — distance crosses below 0 (on bar close)

Iani SMC Sniper XAU v2.2 (Long+Short + News Countdown, v6)Iani SMC Sniper v2.6 — Anytime • Auto Pip • FVG 50% • OB • News Panel
Smart-Money Concepts made simple for intraday XAU/USD (works on any symbol).
Finds BOS, 50% FVG “sniper” entries, optional Order Blocks, London H/L, news countdown, and a mini info panel.
What it does
BOS (Break of Structure): detects bullish/bearish BOS after London sweep logic.
FVG 50% entries: plots precise long/short entry dots at the midpoint of the gap.
Auto TP/SL: TP = RR × risk, SL below/above recent swing with a small buffer.
Order Blocks (optional): marks the last opposite candle after BOS and alerts on OB revisit.
London High/Low: tracks session range; session filter is optional.
News countdown: shows next event time and minutes left (user-selectable timezone).
Mini Panel: top-left table with Trend (last BOS), Next news, R:R, Pip size.
Inputs (key)
Auto pip size: uses syminfo.mintick. Manual override available.
Risk:Reward (RR): default 2.0.
Pivot length: swing sensitivity.
Sessions: enable if you want signals only 12:00–20:00 (symbol timezone). Off = anytime.
News timezone: pick your own (e.g., Europe/Brussels, America/New_York).
Absolute & daily times: add your events (strings like 2025-09-17 20:00 or 14:30,16:00…).
Show labels/levels/OBs: toggle on/off.
Alerts included
BOS Bullish / BOS Bearish
BUY Entry / SELL Entry (return to 50% FVG)
Bullish OB revisit / Bearish OB revisit
TP Long/Short reached, SL Long/Short hit
NEWS WARNING (warning window only; does not block signals)
To use: Add Alert → Condition: this indicator → choose any of the alertconditions.
Best use
Bias: H1 for structure.
Execution: M15 (standard) or M5 (aggressive).
Works great on XAUUSD, but is symbol-agnostic (auto pip adapts).
Notes
News times display in the timezone you pick in settings.
OBs are a simple implementation meant for quick visual guidance.
Labels: BUY/SELL near entries, TP/SL on set and when hit, BOS up/down.
Risk disclaimer
This tool is for education only. Not financial advice. Backtest and manage risk.

Reference timesThe theory behind this indicator is that sometimes the graph reaches a certain price at at a certain time according to the price it had at the same time and day in any of the previous weeks. If you could easily see what happened a few weeks ago on this day's weekday and half an hour from now, you might theoretically gain more assurance as to where the graph might go in the next half an hour.
This of course relies of the premise that some traders choose to enter or exit positions according to historical times they are referencing. Hence the name - Reference times.
Example:
it is now 08:00 ET Wednesday. I want to guess what the graph will do in the next half hour. I enter in the indicator the weekday "Wednesday", the time "8:30", and go to 30 minute candles.
I will then see all the candles the graph has been on historical Wednesdays at 8:30. If the candles are below the 08:00 price, we might guess that the graph might want to descent. If they are above the graph, we might guess that the graph might ascend.
How it works:
The user defines a weekday and time he wants to inquire on.
The script searches for past weekdays and similar hours.
It marks these bars at their wicks.
The user can also inquire "opposite hours" - 12 hours ahead or earlier.
The user can also inquire "opposite days" - Monday<->Wednesday, Tuesday<->Thursday.
In addition, the User may inquire the previous day of his selected weekday, which will mark the most recent previous day existent.
Side note: The Time zone offset is set for Jerusalem time. and so it may need future adjustment.
send debugging instances if you find any
Thank you
Assaf Fogelman 2025

Reference TimesThe theory behind this indicator is that sometime the graph will change its direction at a point that is the point it reached at that weekday on that time in the previous weeks. If you can easily see what happened a few weeks ago on this day's weekday and a half an hour from now, you might theoretically gain more assurance as to where the graph might go in the next half an hour.
This of course relies of the premise that some traders choose to enter or exit positions according to historical times they are referencing. Hence the name - Reference times.
Example:
it is now 08:00 ET Wednesday. I want to guess what the graph will do in half an hour. I enter in the indicator the weekday "Wednesday", the time "8:30", and go to 30 minute candles.
I will then see all the candles the graph has been on historical Wednesdays at 8:30. If the candles are below the 08:00 price, we might guess that the graph might want to descent. If they are above the graph, we would guess the graph might want to ascend.
How it works:
The user defines a weekday and time he wants to inquire on.
The script searches for past weekdays and similar hours.
It marks these bars at their wicks.
The user can also inquire "opposite hours" - 12 hours ahead or earlier.
The user can also inquire "opposite days" - Monday<->Wednesday, Tuesday<->Thursday.
In addition, the User may inquire the previous day of his selected weekday, which will mark the most recent previous day existent.
Side note: The Time zone offset is set for Jerusalem time. and so it may need future adjustment.
send debugging instances if you find any
Thank you
Assaf Fogelman 2025
High and Low - MS - 2.0"Showing the high and low points with numbers.
Micha the leftist didn’t say how it’s called in his video.
#LeftismIsAMentalIllness"
נותן לראות את הנקודות הגבוהות והנמוכות עם מספרים
מיכה השמאלן לא אמר איך קוראים לזה בסרטון שלו
#שמאלנותזומחלתנפש
14/09/2025

FOMC Fund Rate 2022–2025(0.1)This indicator visualizes the Federal Open Market Committee (FOMC) meetings from 2022 through 2025.
It plots vertical lines on the announcement dates and attaches labels showing:
The decision (rate hike ⭡, cut ⭣, or hold ⭤).
The size of the rate change in percentage points.
The cumulative Federal Funds Rate path in parentheses.
Features:
Accurate timestamps for each FOMC meeting (UTC+1).
Customizable line style, width, and color.
Label color and text color options.
Placeholder labels for future meetings to maintain the timeline.
Use this script to keep track of historical Fed policy decisions and visualize the rate path over time directly on your chart.

ICT 00:00, 08:30, 09:30 & 13:30 Opens (NY) — Prior-Day HistoryICT 00:00, 08:30, 09:30 & 13:30 Opens (NY)
This is a derivative of ALPHAICTRADER’s open-source script, republished under the MPL-2.0 with clear attribution and documented changes. It plots four New-York–anchored intraday reference levels—0000, 0830, 0930, 1330—as short, right-padded stubs with clean side labels. Use these time anchors (ICT-style midnight + key US windows) to frame bias, volatility pockets, and intraday trade locations.
What’s original in this version (changes)
Right-padded stubs instead of chart-wide rays — each level ends N bars past the latest candle (configurable).
Side labels at the line tip — text-only labels (0000, 0830, 0930, 1330) that sit at the right end of each stub and update every bar.
Optional prior-day history — show Today only or Today + Prior Day; older lines/labels auto-pruned.
Per-anchor controls — Display, Style, Color, Width, and Show Label for each time.
What it plots (and why)
0000 (NY Midnight): daily session anchor for bias/liquidity context.
0830 (NY): macro data window (CPI/NFP/claims) where volatility often concentrates.
0930 (NY): US cash equity market open; opening-drive structure/acceptance tests.
1330 (NY): early-afternoon anchor for continuation vs. fade.
How it works (under the hood)
Session detection: time("1", session, "America/New_York"); first bar flagged via not na(ts) and na(ts ).
Anchor price: open of that first bar per session/day.
Rendering: lines drawn with xloc=bar_index from start bar to bar_index + Right Pad; x2 updates every bar (no extend.right).
Labels: placed at line.get_x2(line) + Label Pad, soft color variant; updated per bar to stay on the tip.
History: arrays keep either today only or today + yesterday and delete anything older immediately.
How to use
Add to any intraday chart (futures/FX/indices). Anchors are always NY-time; TradingView handles DST.
Inputs
00:00 / 08:30 / 09:30 / 13:30 (NY): Display, Line Style, Color, Width, Show Label
Right Edge: Right Pad (bars) · Label Pad (bars)
History: Show Prior Day (History) — off = today only; on = today + yesterday
Suggested pads: Right Pad 2–5 bars; Label Pad 0–2.
These are context anchors, not signals. Combine with your execution model (market structure, liquidity, FVG/OBs, etc.).
Attribution & License (MPL-2.0)
Original work: “ICT NEW YORK MIDNIGHT OPEN AND 8.30 AM OPEN” by ALPHAICTRADER (MPL-2.0).
This derivative: modifications listed above; source published and kept under MPL-2.0 per license terms.
If you distribute a modified version of this Pine file, you must keep MPL-2.0, retain the copyright/licensing header, publish your modified source, and document your changes.
Notes: Pine v5. Minimalist (no day dividers). Educational tool; not financial advice.
Copyright: © ALPHAICTRADER 2022 · © Funk 2025
License: MPL-2.0

DNSE VN301!, ADX Momentum StrategyDiscover the tailored Pine Script for trading VN30F1M Futures Contracts intraday.
This strategy applies the Statistical Method (IQR) to break down the components of the ADX, calculating the threshold of "normal" momentum fluctuations in price to identify potential breakouts for entry and exit signals. The script automatically closes all positions by 14:30 to avoid overnight holdings.
www.tradingview.com
Settings & Backtest Results:
- Chart: 30-minute timeframe
- Initial capital: VND 100 million
- Position size: 4 contracts per trade (includes trading fees, excludes tax)
- Backtest period: Sep-2021 to Sep-2025
- Return: over 270% (with 5 ticks slippage)
- Trades executed: 1,000+
- Win rate: ~40%
- Profit factor: 1.2
Default Script Settings:
Calculates the acceleration of changes in the +DI and -DI components of the ADX, using IQR to define "normal" momentum fluctuations (adjustable via Lookback period).
Calculates the difference between each bar’s Open and Close prices, using IQR to define "normal" gaps (adjustable via Lookback period).
Entry & Exit Conditions:
Entry Long: Change in +DI or -DI > Avg IQR Value AND Close Price > Previous Close
Exit Long: (all 4 conditions must be met)
- Change in +DI or -DI > Avg IQR Value
- RSI < Previous RSI
- Close–Open Gap > Avg IQR Gap
- Close Price < Previous Close
Entry Short: Change in +DI or -DI > Avg IQR Value AND Close Price < Previous Close
Exit Short: (all 4 conditions must be met)
- Change in +DI or -DI > Avg IQR Value
- RSI > Previous RSI
- Close–Open Gap > Avg IQR Gap
- Close Price > Previous Close
Disclaimers:
Trading futures contracts carries a high degree of risk, and price movements can be highly volatile. This script is intended as a reference tool only. It should be used by individuals who fully understand futures trading, have assessed their own risk tolerance, and are knowledgeable about the strategy’s logic.
All investment decisions are the sole responsibility of the user. DNSE bears no liability for any potential losses incurred from applying this strategy in real trading. Past performance does not guarantee future results. Please contact us directly if you have specific questions about this script.

عكفة الماكد المتقدمة - أبو فارس ©// 🔒 Advanced MACD Curve © 2025
// 💡 Idea & Creativity: Engineer Abu Elias
// 🛠️ Development & Implementation: Abu Fares
// 📜 All intellectual rights reserved - Copying, modifying, or redistributing is not permitted
// 🚫 Any attempt to tamper with this code or violate intellectual property rights is legally prohibited
// 📧 For inquiries and licensing: Please contact the developer, Abu Fares

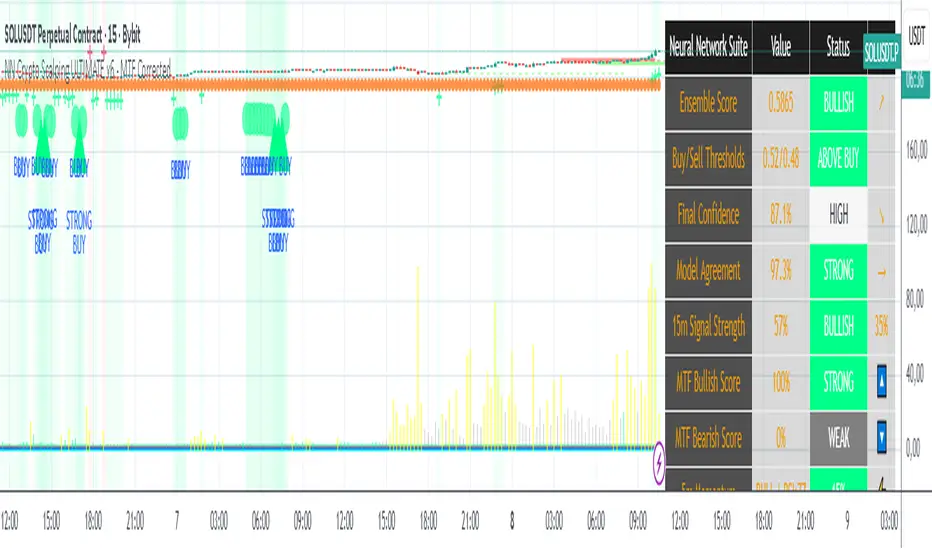
NN Crypto Scalping ULTIMATE v6 - MTF mapercivNeural Network Crypto Trading System v6.1
Complete Technical Documentation
Author
: Neural Network Ensemble Trading System
Version
: 6.1 - MTF Corrected & Bias Fixed
Date
: January 2025
Platform
: TradingView PineScript v6
Executive Summary
The
Neural Network Crypto Trading System v6.1
is an advanced algorithmic trading system that combines three specialized neural networks into an intelligent ensemble to generate cryptocurrency trading signals. The system integrates multi-timeframe analysis, crypto-specific optimizations, dynamic risk management, and continuous learning to maximize performance in highly volatile markets.
Key Features:
Ensemble of 3 specialized Neural Networks
(Primary, Momentum, Volatility)
Multi-Timeframe Analysis
with 5 timeframes (5m, 15m, 1h, 4h, 1D)
22 Advanced Features
for each model
Anti-repainting
guaranteed with confirmed data
8 Market Regime
automatic detections
6 Signal Levels
(Strong/Moderate/Weak Buy/Sell)
Professional dashboard
with 15+ real-time metrics
Intelligent alert system
with webhook integration
Fury by Tetrad on TESLA v2Fury by Tetrad — TSLA v2 (Free Version)
📊 Fury v2 on TSLA — Financial Snapshot
First trade: August 11, 2010
Last trade: September 5, 2025
Net Profit: $10,549.10 (≈ +10,549%)
Gross Profit: $10,554.36
Gross Loss: $5.26
Commission Paid: $86.95
⚖️ Risk/Return Ratios
Sharpe Ratio: 0.42
Sortino Ratio: 17.63
Profit Factor: 2005.38
🔄 Trade Statistics
Total Trades: 37
Winning Trades: 37
Losing Trades: 0
Win Rate: 100%
Fury is a momentum-reversion hybrid designed for Tesla (TSLA) on higher-liquidity timeframes. It combines Bollinger Bands (signal extremes) with RSI (exhaustion filter) to time mean-reversion pops/drops, then exits via price multipliers or optional time-based stops. A Market Direction toggle (Market Neutral / Long Only / Short Only) lets you align with macro bias or risk constraints. Intrabar simulation is enabled for realistic stop/limit behavior, and labeled entries/exits improve visual auditability.
How it works
Entries:
• Long when price pierces lower band and RSI is below the long threshold.
• Short when price pierces upper band and RSI is above the short threshold.
Exits:
• Profit targets via entry×multiplier (independent for long/short).
• Optional price-based stop factors per side.
• Optional time stop (N days) to cap trade duration.
Controls:
• Market Direction switch (Neutral / Long Only / Short Only).
• Tunable BB length/multiplier, RSI length/thresholds, exit multipliers, stops.
Intended use
Swing or position trading TSLA; can be adapted to other high-beta equities with parameter retuning. Use on liquid timeframes and validate with robust out-of-sample testing.
Disclaimers
Backtests are approximations; past performance ≠ future results. Educational use only. Not financial advice.
Stay connected
Follow on TradingView for updates • Telegram: t.me • Website: tetradprotocol.com

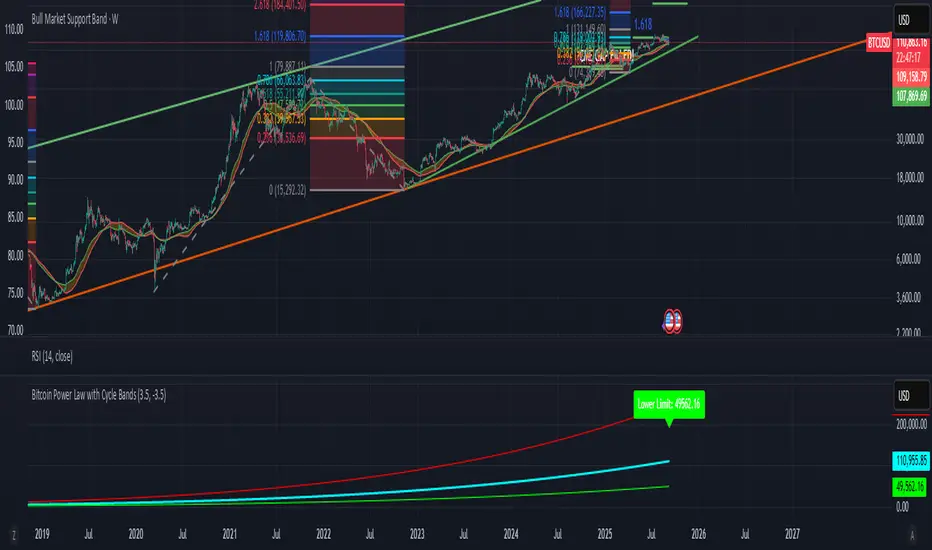
Bitcoin Power Law with Cycle BandsBitcoin Power Law with Cycle Bands DescriptionUnlock the power of Bitcoin’s long-term trends with the Bitcoin Power Law with Cycle Bands script, exclusively available through Bitcoin Wealth Edge! This custom TradingView indicator, built for Pine Script v6, models Bitcoin’s price behavior using a 96% R² power law trendline, derived from days since its genesis (January 3, 2009). Designed to predict cycle tops and bottoms, it features:Power Law Trendline: A cyan line representing fair value (e.g., ~$111,000 as of September 2025), based on a logarithmic regression with adjustable coefficients (a = -17.02, b = 5.83).
Cycle Bands: Adjustable red (upper) and green (lower) bands, defaulting to 3.5x and -3.5x multipliers, aligning with historical peaks (e.g., $69K in 2021) and troughs (e.g., $16K in 2022).
Dynamic Labels: Real-time labels displaying fair value, upper limit ($180K), and lower limit ($40K), updated on the last bar for quick insights.
Follow @HodlerRanch
for updates!
FNGAdataDates_Part1FNGAdataDates_Part1 provides historical trading dates for a financial instrument (e.g., FNGA index or related asset) from May 23, 2025, to approximately mid-2021, covering 950 trading days. The dates are organized into 19 chunks (dates_0 to dates_18), each containing 50 timestamps representing trading days (excluding weekends and possibly holidays). This library is part one of a two-part set due to Pine Script token limits and must be used with FNGAdataDates_Part2 for the complete dataset (1,846 dates). It is designed to align with the FNGAopenPrices and FNGAclosePrices libraries for backtesting, technical analysis, or visualization in Pine Script.
Savitzky-Golay Hampel Filter | AlphaNattSavitzky-Golay Hampel Filter | AlphaNatt
A revolutionary indicator combining NASA's satellite data processing algorithms with robust statistical outlier detection to create the most scientifically advanced trend filter available on TradingView.
"This is the same mathematics that processes signals from the Hubble Space Telescope and analyzes data from the Large Hadron Collider - now applied to financial markets."
━━━━━━━━━━━━━━━━━━━━━━━━━━━━━━━━━━━━━━━━
🚀 SCIENTIFIC PEDIGREE
Savitzky-Golay Filter Applications:
NASA: Satellite telemetry and space probe data processing
CERN: Particle physics data analysis at the LHC
Pharmaceutical: Chromatography and spectroscopy analysis
Astronomy: Processing signals from radio telescopes
Medical: ECG and EEG signal processing
Hampel Filter Usage:
Aerospace: Cleaning sensor data from aircraft and spacecraft
Manufacturing: Quality control in precision engineering
Seismology: Earthquake detection and analysis
Robotics: Sensor fusion and noise reduction
━━━━━━━━━━━━━━━━━━━━━━━━━━━━━━━━━━━━━━━━
🧬 THE MATHEMATICS
1. Savitzky-Golay Filter
The SG filter performs local polynomial regression on data points:
Fits a polynomial of degree n to a sliding window of data
Evaluates the polynomial at the center point
Preserves higher moments (peaks, valleys) unlike moving averages
Maintains derivative information for true momentum analysis
Originally published in Analytical Chemistry (1964)
Mathematical Properties:
Optimal smoothing in the least-squares sense
Preserves statistical moments up to polynomial order
Exact derivative calculation without additional lag
Superior frequency response vs traditional filters
2. Hampel Filter
A robust outlier detector based on Median Absolute Deviation (MAD):
Identifies outliers using robust statistics
Replaces spurious values with polynomial-fitted estimates
Resistant to up to 50% contaminated data
MAD is 1.4826 times more robust than standard deviation
Outlier Detection Formula:
|x - median| > k × 1.4826 × MAD
Where k is the threshold parameter (typically 3 for 99.7% confidence)
━━━━━━━━━━━━━━━━━━━━━━━━━━━━━━━━━━━━━━━━
💎 WHY THIS IS SUPERIOR
vs Moving Averages:
Preserves peaks and valleys (critical for catching tops/bottoms)
No lag penalty for smoothness
Maintains derivative information
Polynomial fitting > simple averaging
vs Other Filters:
Outlier immunity (Hampel component)
Scientifically optimal smoothing
Preserves higher-order features
Used in billion-dollar research projects
Unique Advantages:
Feature Preservation: Maintains market structure while smoothing
Spike Immunity: Ignores false breakouts and stop hunts
Derivative Accuracy: True momentum without additional indicators
Scientific Validation: 60+ years of academic research
━━━━━━━━━━━━━━━━━━━━━━━━━━━━━━━━━━━━━━━━
⚙️ PARAMETER OPTIMIZATION
1. Polynomial Order (2-5)
2 (Quadratic): Maximum smoothing, gentle curves
3 (Cubic): Balanced smoothing and responsiveness (recommended)
4-5 (Higher): More responsive, preserves more features
2. Window Size (7-51)
Must be odd number
Larger = smoother but more lag
Formula: 2×(desired smoothing period) + 1
Default 21 = analyzes 10 bars each side
3. Hampel Threshold (1.0-5.0)
1.0: Aggressive outlier removal (68% confidence)
2.0: Moderate outlier removal (95% confidence)
3.0: Conservative outlier removal (99.7% confidence) (default)
4.0+: Only extreme outliers removed
4. Final Smoothing (1-7)
Additional WMA smoothing after filtering
1 = No additional smoothing
3-5 = Recommended for most timeframes
7 = Ultra-smooth for position trading
━━━━━━━━━━━━━━━━━━━━━━━━━━━━━━━━━━━━━━━━
📊 TRADING STRATEGIES
Signal Recognition:
Cyan Line: Bullish trend with positive derivative
Pink Line: Bearish trend with negative derivative
Color Change: Trend reversal with polynomial confirmation
1. Trend Following Strategy
Enter when price crosses above cyan filter
Exit when filter turns pink
Use filter as dynamic stop loss
Best in trending markets
2. Mean Reversion Strategy
Enter long when price touches filter from below in uptrend
Enter short when price touches filter from above in downtrend
Exit at opposite band or filter color change
Excellent for range-bound markets
3. Derivative Strategy (Advanced)
The SG filter preserves derivative information
Acceleration = second derivative > 0
Enter on positive first derivative + positive acceleration
Exit on negative second derivative (momentum slowing)
━━━━━━━━━━━━━━━━━━━━━━━━━━━━━━━━━━━━━━━━
📈 PERFORMANCE CHARACTERISTICS
Strengths:
Outlier Immunity: Ignores stop hunts and flash crashes
Feature Preservation: Catches tops/bottoms better than MAs
Smooth Output: Reduces whipsaws significantly
Scientific Basis: Not curve-fitted or optimized to markets
Considerations:
Slight lag in extreme volatility (all filters have this)
Requires odd window sizes (mathematical requirement)
More complex than simple moving averages
Best with liquid instruments
━━━━━━━━━━━━━━━━━━━━━━━━━━━━━━━━━━━━━━━━
🔬 SCIENTIFIC BACKGROUND
Savitzky-Golay Publication:
"Smoothing and Differentiation of Data by Simplified Least Squares Procedures"
- Abraham Savitzky & Marcel Golay
- Analytical Chemistry, Vol. 36, No. 8, 1964
Hampel Filter Origin:
"Robust Statistics: The Approach Based on Influence Functions"
- Frank Hampel et al., 1986
- Princeton University Press
These techniques have been validated in thousands of scientific papers and are standard tools in:
NASA's Jet Propulsion Laboratory
European Space Agency
CERN (Large Hadron Collider)
MIT Lincoln Laboratory
Max Planck Institutes
━━━━━━━━━━━━━━━━━━━━━━━━━━━━━━━━━━━━━━━━
💡 ADVANCED TIPS
News Trading: Lower Hampel threshold before major events to catch spikes
Scalping: Use Order=2 for maximum smoothness, Window=11 for responsiveness
Position Trading: Increase Window to 31+ for long-term trends
Combine with Volume: Strong trends need volume confirmation
Multiple Timeframes: Use daily for trend, hourly for entry
Watch the Derivative: Filter color changes when first derivative changes sign
━━━━━━━━━━━━━━━━━━━━━━━━━━━━━━━━━━━━━━━━
⚠️ IMPORTANT NOTICES
Not financial advice - educational purposes only
Past performance does not guarantee future results
Always use proper risk management
Test settings on your specific instrument and timeframe
No indicator is perfect - part of complete trading system
━━━━━━━━━━━━━━━━━━━━━━━━━━━━━━━━━━━━━━━━
🏆 CONCLUSION
The Savitzky-Golay Hampel Filter represents the pinnacle of scientific signal processing applied to financial markets. By combining polynomial regression with robust outlier detection, traders gain access to the same mathematical tools that:
Guide spacecraft to other planets
Detect gravitational waves from black holes
Analyze particle collisions at near light-speed
Process signals from deep space
This isn't just another indicator - it's rocket science for trading .
"When NASA needs to separate signal from noise in billion-dollar missions, they use these exact algorithms. Now you can too."
━━━━━━━━━━━━━━━━━━━━━━━━━━━━━━━━━━━━━━━━
Developed by AlphaNatt
Version: 1.0
Release: 2025
Pine Script: v6
"Where Space Technology Meets Market Analysis"
Not financial advice. Always DYOR

Laguerre-Kalman Adaptive Filter | AlphaNattLaguerre-Kalman Adaptive Filter |AlphaNatt
A sophisticated trend-following indicator that combines Laguerre polynomial filtering with Kalman optimal estimation to create an ultra-smooth, low-lag trend line with exceptional noise reduction capabilities.
"The perfect trend line adapts to market conditions while filtering out noise - this indicator achieves both through advanced mathematical techniques rarely seen in retail trading."
━━━━━━━━━━━━━━━━━━━━━━━━━━━━━━━━━━━━━━━━
🎯 KEY FEATURES
Dual-Filter Architecture: Combines two powerful filtering methods for superior performance
Adaptive Volatility Adjustment: Automatically adapts to market conditions
Minimal Lag: Laguerre polynomials provide faster response than traditional moving averages
Optimal Noise Reduction: Kalman filtering removes market noise while preserving trend
Clean Visual Design: Color-coded trend visualization (cyan/pink)
━━━━━━━━━━━━━━━━━━━━━━━━━━━━━━━━━━━━━━━━
📊 THE MATHEMATICS
1. Laguerre Filter Component
The Laguerre filter uses a cascade of four all-pass filters with a single gamma parameter:
4th order IIR (Infinite Impulse Response) filter
Single parameter (gamma) controls all filter characteristics
Provides smoother output than EMA with similar lag
Based on Laguerre polynomials from quantum mechanics
2. Kalman Filter Component
Implements a simplified Kalman filter for optimal estimation:
Prediction-correction algorithm from aerospace engineering
Dynamically adjusts based on estimation error
Provides mathematically optimal estimate of true price trend
Reduces noise while maintaining responsiveness
3. Adaptive Mechanism
Monitors market volatility in real-time
Adjusts filter parameters based on current conditions
More responsive in trending markets
More stable in ranging markets
━━━━━━━━━━━━━━━━━━━━━━━━━━━━━━━━━━━━━━━━
⚙️ INDICATOR SETTINGS
Laguerre Gamma (0.1-0.99): Controls filter smoothness. Higher = smoother but more lag
Adaptive Period (5-100): Lookback for volatility calculation
Kalman Noise Reduction (0.1-2.0): Higher = more noise filtering
Trend Threshold (0.0001-0.01): Minimum change to register trend shift
Recommended Settings:
Scalping: Gamma: 0.6, Period: 10, Noise: 0.3
Day Trading: Gamma: 0.8, Period: 20, Noise: 0.5 (default)
Swing Trading: Gamma: 0.9, Period: 30, Noise: 0.8
Position Trading: Gamma: 0.95, Period: 50, Noise: 1.2
━━━━━━━━━━━━━━━━━━━━━━━━━━━━━━━━━━━━━━━━
📈 TRADING SIGNALS
Primary Signals:
Cyan Line: Bullish trend - price above filter and filter ascending
Pink Line: Bearish trend - price below filter or filter descending
Color Change: Potential trend reversal point
Entry Strategies:
Trend Continuation: Enter on pullback to filter line in trending market
Trend Reversal: Enter on color change with volume confirmation
Breakout: Enter when price crosses filter with momentum
Exit Strategies:
Exit long when line turns from cyan to pink
Exit short when line turns from pink to cyan
Use filter as trailing stop in strong trends
━━━━━━━━━━━━━━━━━━━━━━━━━━━━━━━━━━━━━━━━
✨ ADVANTAGES OVER TRADITIONAL INDICATORS
Vs. Moving Averages:
Significantly less lag while maintaining smoothness
Adaptive to market conditions
Better noise filtering
Vs. Standard Filters:
Dual-filter approach provides optimal estimation
Mathematical foundation from signal processing
Self-adjusting parameters
Vs. Other Trend Indicators:
Cleaner signals with fewer whipsaws
Works across all timeframes
No repainting or lookahead bias
━━━━━━━━━━━━━━━━━━━━━━━━━━━━━━━━━━━━━━━━
🎓 MATHEMATICAL BACKGROUND
The Laguerre filter was developed by John Ehlers, applying Laguerre polynomials (used in quantum mechanics) to financial markets. These polynomials provide an elegant solution to the lag-smoothness tradeoff that plagues traditional moving averages.
The Kalman filter, developed by Rudolf Kalman in 1960, is used in everything from GPS systems to spacecraft navigation. It provides the mathematically optimal estimate of a system's state given noisy measurements.
By combining these two approaches, this indicator achieves what neither can alone: a smooth, responsive trend line that adapts to market conditions while filtering out noise.
━━━━━━━━━━━━━━━━━━━━━━━━━━━━━━━━━━━━━━━━
💡 TIPS FOR BEST RESULTS
Confirm with Volume: Strong trends should have increasing volume
Multiple Timeframes: Use higher timeframe for trend, lower for entry
Combine with Momentum: RSI or MACD can confirm filter signals
Market Conditions: Adjust noise parameter based on market volatility
Backtesting: Always test settings on your specific instrument
━━━━━━━━━━━━━━━━━━━━━━━━━━━━━━━━━━━━━━━━
⚠️ IMPORTANT NOTES
No indicator is perfect - always use proper risk management
Best suited for trending markets
May produce false signals in choppy/ranging conditions
Not financial advice - for educational purposes only
━━━━━━━━━━━━━━━━━━━━━━━━━━━━━━━━━━━━━━━━
🚀 CONCLUSION
The Laguerre-Kalman Adaptive Filter represents a significant advancement in technical analysis, bringing institutional-grade mathematical techniques to retail traders. Its unique combination of polynomial filtering and optimal estimation provides a clean, reliable trend-following tool that adapts to changing market conditions.
Whether you're scalping on the 1-minute chart or position trading on the daily, this indicator provides clear, actionable signals with minimal false positives.
"In the world of technical analysis, the edge comes from using better mathematics. This indicator delivers that edge."
━━━━━━━━━━━━━━━━━━━━━━━━━━━━━━━━━━━━━━━━
Developed by AlphaNatt | Professional Quantitative Trading Tools
Version: 1.0
Last Updated: 2025
Pine Script: v6
License: Open Source
Not financial advice. Always DYOR

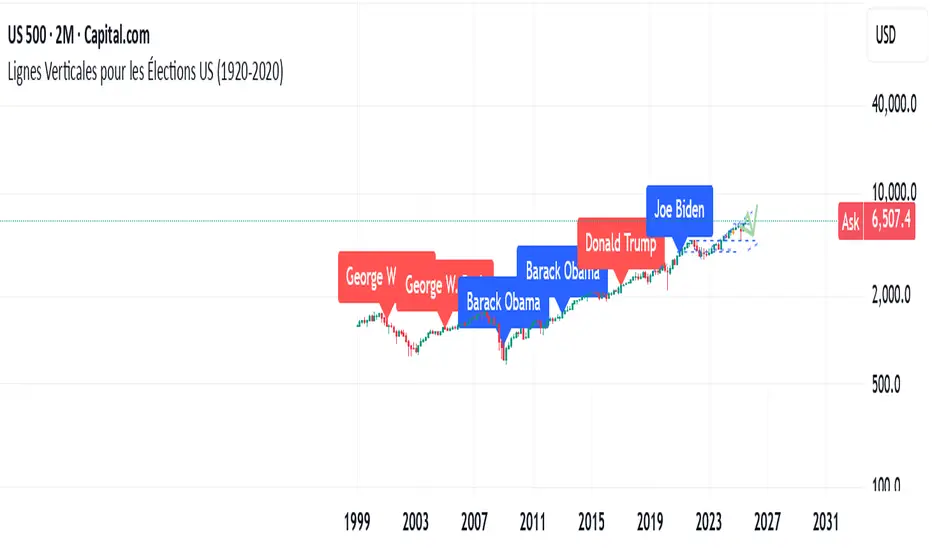
US Elections Democrate-Republicain (1920-2025)This script shows the different U.S. presidents and indicates whether each was Democratic or Republican. It allows users to analyze the market based on the president in office.
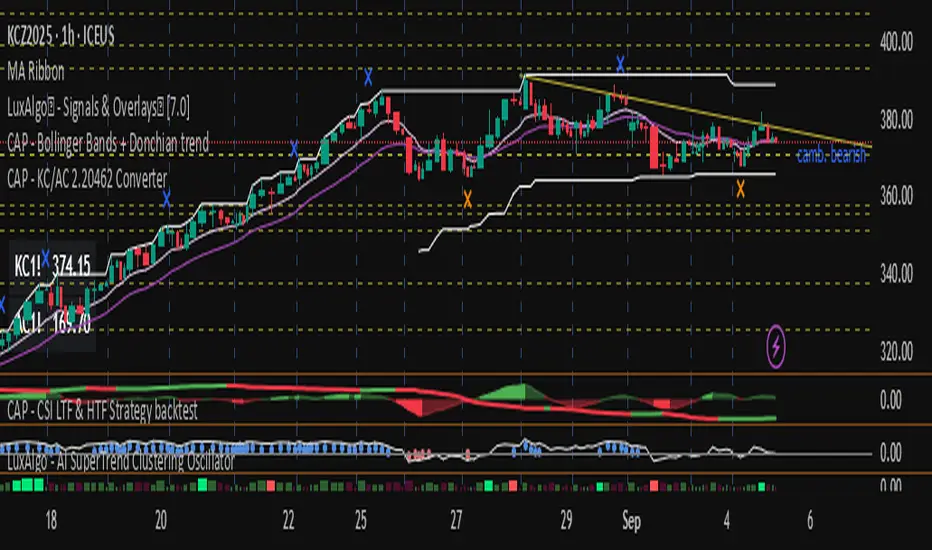
CAP - KC/AC 2.20462 Converter// ───────────────────────────────────────────────────────────────────────────────
// Purpose: Conversion Indicator for ICE “C” (KC) and “C Metric” (AC) Contracts
//
// Background:
// - The Intercontinental Exchange (ICE) is phasing out the legacy Coffee “C” contract (symbol: KC),
// which has been quoted in U.S. cents per pound, and replacing it with the new Coffee “C Metric” contract (symbol: AC),
// quoted in U.S. dollars per metric ton :contentReference {index=0}.
// - The final KC futures expire in March 2028; AC contracts begin trading in September 2025 and use modern specifications
// including pricing per metric ton and flexible bulk delivery formats :contentReference {index=1}.
//
// Why this script matters:
// - Traders are accustomed to the KC pricing format (¢/lb); the AC contract’s USD/MT may create confusion.
// - This indicator visually converts the current chart price—whether from KC or AC contracts—directly into its equivalent unit,
// helping traders quickly assess parity and compare trends across both contract types.
// - It simplifies head-to-head comparison during this transition period, improving clarity on chart price behavior.
//
// Usage instructions:
// - If the symbol starts with "KC", the script divides the price by 2.20462 to convert from ¢/lb to approximate ¢/kg.
// - If the symbol starts with "AC", the script multiplies the price by 2.20462 to reverse the conversion.
// - The results (converted values) are displayed in a table for immediate visual clarity.
// ───────────────────────────────────────────────────────────────────────────────
BBMA Enhanced Pro - Multi-Timeframe Band Breakout StrategyShort Title : BBMA Pro
Overview
The BBMA Enhanced Pro is a professional-grade trading indicator that builds on the Bollinger Bands Moving Average (BBMA) strategy, pioneered by Omar Ali , a Malaysian forex trader and educator. Combining Bollinger Bands with Weighted Moving Averages (WMA) , this indicator identifies high-probability breakout and reversal opportunities across multiple timeframes. With advanced features like multi-timeframe Extreme signal detection, eight professional visual themes, and a dual-mode dashboard, it’s designed for traders seeking precision in trending and consolidating markets. Optimized for dark chart backgrounds, it’s ideal for forex, stocks, and crypto trading.
History
The BBMA strategy was developed by Omar Ali (BBMA Oma Ally) in the early 2010s, gaining popularity in the forex trading community, particularly in Southeast Asia. Building on John Bollinger’s Bollinger Bands, Omar Ali integrated Weighted Moving Averages and a multi-timeframe approach to create a structured system for identifying reversals, breakouts, and extreme conditions. The BBMA Enhanced Pro refines this framework with modern features like real-time dashboards and customizable visualizations, making it accessible to both novice and experienced traders.
Key Features
Multi-Timeframe Extreme Signals : Detects Extreme signals (overbought/oversold conditions) on both current and higher timeframes simultaneously, a rare feature that enhances signal reliability through trend alignment.
Professional Visual Themes : Eight distinct themes (e.g., Neon Contrast, Fire Gradient) optimized for dark backgrounds.
Dual-Mode Dashboard : Choose between Full Professional (detailed metrics) or Simplified Trader (essential info with custom notes).
Bollinger Band Squeeze Detection : Identifies low volatility periods (narrow bands) signaling potential sideways markets or breakouts.
Confirmation Labels : Displays labels when current timeframe signals align with recent higher timeframe signals, highlighting potential consolidations or squeezes.
Timeframe Validation : Prevents selecting the same timeframe for current and higher timeframe analysis.
Customizable Visualization : Toggle signal dots, EMA 50, and confirmation labels for a clean chart experience.
How It Works
The BBMA Enhanced Pro combines Bollinger Bands (20-period SMA, ±2 standard deviations) with WMA (5 and 10 periods) to generate trade signals:
Buy Signal : WMA 5 Low crosses above the lower Bollinger Band, indicating a recovery from an oversold condition (Extreme buy).
Sell Signal : WMA 5 High crosses below the upper Bollinger Band, signaling a rejection from an overbought condition (Extreme sell).
Extreme Signals : Occur when prices or WMAs move significantly beyond the Bollinger Bands (±2σ), indicating statistically rare overextensions. These often coincide with Bollinger Band Squeezes (narrow bands, low standard deviation), signaling potential sideways markets or impending breakouts.
Multi-Timeframe Confirmation : The indicator’s unique strength is its ability to detect Extreme signals on both the current and higher timeframe (HTF) within the same chart. When the HTF generates an Extreme signal (e.g., buy), and the current timeframe follows with an identical signal, it suggests the lower timeframe is aligning with the HTF’s trend, increasing reliability. Labels appear only when this alignment occurs within a user-defined lookback period (default: 50 bars), highlighting periods of band contraction across timeframes.
Bollinger Band Squeeze : Narrow bands (low standard deviation) indicate reduced volatility, often preceding consolidation or breakouts. The indicator’s dashboard tracks band width, helping traders anticipate these phases.
Why Multi-Timeframe Extremes Matter
The BBMA Enhanced Pro’s multi-timeframe approach is rare and powerful. When the higher timeframe shows an Extreme signal followed by a similar signal on the current timeframe, it suggests the market is following the HTF’s trend or entering a consolidation phase. For example:
HTF Sideways First : If the HTF Bollinger Bands are shrinking (low volatility, low standard deviation), it signals a potential sideways market. Waiting for the current timeframe to show a similar Extreme signal confirms this consolidation, reducing the risk of false breakouts.
Risk Management : By requiring HTF confirmation, the indicator encourages traders to lower risk during uncertain periods, waiting for both timeframes to align in a low-volatility state before acting.
Usage Instructions
Select Display Mode :
Current TF Only : Shows Bollinger Bands and WMAs on the chart’s timeframe.
Higher TF Only : Displays HTF bands and WMAs.
Both Timeframes : Combines both for comprehensive analysis.
Choose Higher Timeframe : Select from 1min to 1D (e.g., 15min, 1hr). Ensure it differs from the current timeframe to avoid validation errors.
Enable Signal Dots : Visualize buy/sell Extreme signals as dots, sourced from current, HTF, or both timeframes.
Toggle Confirmation Labels : Display labels when current timeframe Extremes align with recent HTF Extremes, signaling potential squeezes or consolidations.
Customize Dashboard :
Full Professional Mode : View metrics like BB width, WMA trend, and last signal.
Simplified Trader Mode : Focus on essential info with custom trader notes.
Select Visual Theme : Choose from eight themes (e.g., Ice Crystal, Royal Purple) for optimal chart clarity.
Trading Example
Setup : 5min chart, HTF set to 1hr, signal dots and confirmation labels enabled.
Buy Scenario : On the 5min chart, WMA 5 Low crosses above the lower Bollinger Band (Extreme buy), confirmed by a recent 1hr Extreme buy signal within 50 bars. The dashboard shows narrow bands (squeeze), and a green label appears.
Action : Enter a long position, targeting the middle band, with a stop-loss below the recent low. The HTF confirmation suggests a strong trend or consolidation phase.
Sell Scenario : WMA 5 High crosses below the upper Bollinger Band on the 5min chart, confirmed by a recent 1hr Extreme sell signal. The dashboard indicates a squeeze, and a red label appears.
Action : Enter a short position, targeting the middle band, with a stop-loss above the recent high. The aligned signals suggest a potential reversal or sideways market.
Customization Options
BBMA Display Mode : Current TF Only, Higher TF Only, or Both Timeframes.
Higher Timeframe : 1min to 1D.
Visual Theme : Eight professional themes (e.g., Neon Contrast, Forest Glow).
Line Style : Smooth or Step Line for HTF plots.
Signal Dots : Enable/disable, select timeframe source (Current, Higher, or Both).
Confirmation Labels : Toggle and set lookback window (1-100 bars).
Dashboard : Enable/disable, choose mode (Full/Simplified), and set position (Top Right, Bottom Left, etc.).
Notes
Extreme Signals and Squeezes : Extreme signals often occur during Bollinger Band contraction (low standard deviation), signaling potential sideways markets or breakouts. Use HTF confirmation to filter false signals.
Risk Management : If the HTF shows a squeeze (narrow bands), wait for the current timeframe to confirm with an Extreme signal to reduce risk in choppy markets.
Limitations : Avoid trading Extremes in highly volatile markets without additional confirmation (e.g., volume, RSI).
Author Enhanced Professional Edition, inspired by Omar Ali’s BBMA strategy
Version : 6.0 Pro - Simplified
Last Updated : September 2025
License : Mozilla Public License 2.0
We’d love to hear your feedback! Share your thoughts or questions in the comments below.

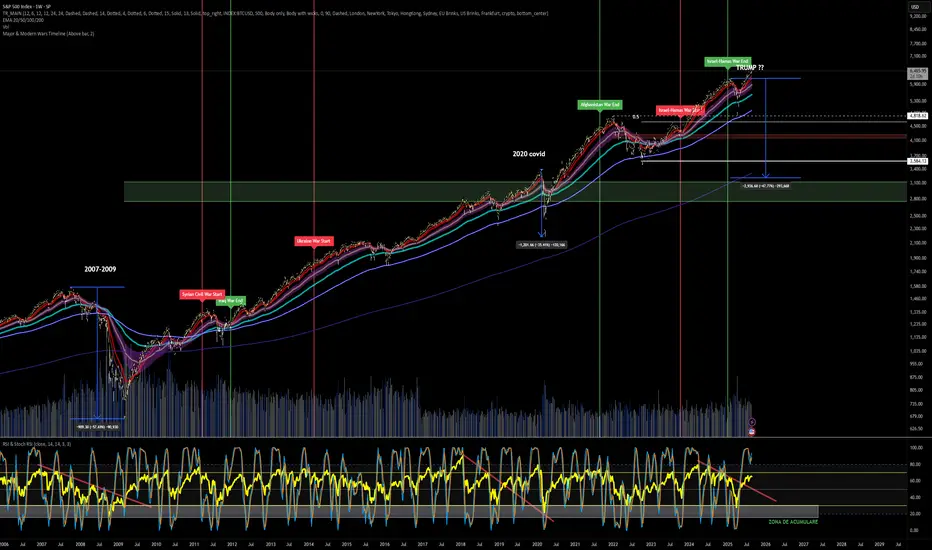
Major & Modern Wars TimelineDescription:
This indicator overlays vertical lines and labels on your chart to mark the start and end dates of major global wars and modern conflicts.
Features:
Displays start (red line + label) and end (green line + label) for each war.
Covers 20th century wars (World War I, World War II, Korean War, Vietnam War, Gulf War, Afghanistan, Iraq).
Includes modern conflicts: Syrian Civil War, Ukraine War, and Israel–Hamas War.
For ongoing conflicts, the end date is set to 2025 for timeline visualization.
Customizable: label position (above/below bar), line width.
Works on any chart timeframe, overlaying events on financial data.
Use case:
Useful for historical market analysis (e.g., gold, oil, S&P 500), helping traders and researchers see how wars and conflicts align with market movements.
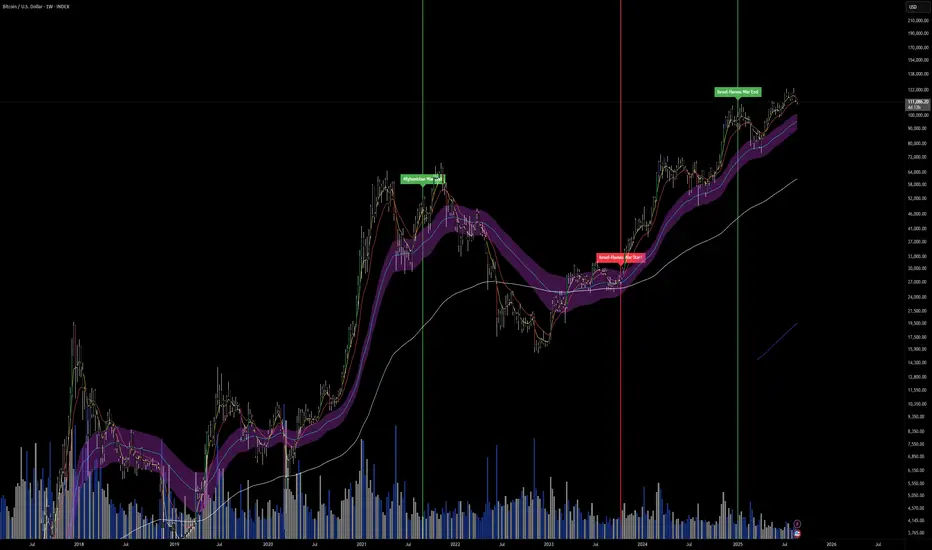