Institutional Analyst LLM📊 Institutional Analyst Board LLM – Smart Money Confluence Scanner for XAUUSD, Forex, Crypto 🔍 Overview The Institutional Analyst Board is a complete multi-timeframe smart money toolkit designed for traders who demand clarity, confluence, and precision. It brings together institutional-grade metrics—Order Blocks (OB), Fair Value Gaps (FVG), Liquidity Sweeps, MACD/RSI...
PTS Ultimate Analysis Board (Flexible Position + Ticker)
GoldenTradeClub
GoldenTradeClub
Updated
Jul 15
PTS Ultimate Analysis Board (Flexible Position + Ticker) Version: Pine v5 Description: This indicator builds a fully customizable, multi-timeframe dashboard table that surfaces 19 key metrics for any ticker (current chart TF, 1 h, 4 h). You can position the table at the top-right or bottom-right of your chart and toggle each metric on or off. Key...
Trading Engine AI Light
GoldenTradeClub
GoldenTradeClub
Jul 14
The Trading Engine includes the best and most effective technical analysis tools. It has 27 different Buy Signal parameters and 26 different Sell Signal parameters. Furthermore, it also has 9 Stop Loss triggers for Long Positions and 8 Stop Loss triggers for Short Positions. Many of the Buy or Sell Signal parameters function as Take Profit and Stop Loss signals...
Elliott Wave Complete
GoldenTradeClub
GoldenTradeClub
Jul 4
1. Indicator Presentation Name: Elliott Wave Complete Type: Pine Script v5 overlay dashboard for TradingView Purpose: Automates Elliott Wave motive (1-5) and corrective (A-B-C) pattern detection on any timeframe, enriches it with classic ZigZag pivots, dynamic Fibonacci projection levels, optional wave-count info box, and real-time alerts—all in one...
💀⚡ PTS WIZARD 666™ ULTIMATE SUPREME V5.0 - COMPLETE FIXED ⚡💀
GoldenTradeClub
GoldenTradeClub
Jul 4
1. Indicator Presentation Name: 💀⚡ PTS WIZARD 666™ ULTIMATE SUPREME V5.0 – COMPLETE FIXED Short ID: PTS-666-SUPREME Type: Pine Script v5 overlay dashboard for TradingView Purpose: An all-in-one trading overlay that integrates advanced WaveTrend momentum, RSI/MFI analysis, POC volume profiling, multiple Fibonacci golden/ultimate zones, volume footprint & imbalance...
🔥 PTS TRADE 666™ ULTIMATE BOOKMAP + QUANTUM ENGINE
GoldenTradeClub
GoldenTradeClub
Jul 4
1. Indicator Presentation Name: 🔥 PTS TRADE 666™ ULTIMATE BOOKMAP + QUANTUM ENGINE Short ID: PTS666_QUANTUM_FINAL Type: Pine Script v5 overlay dashboard for TradingView Purpose: A cutting-edge, institutional-grade suite that unifies bookmap-style footprint volume profiling, dynamic heatmap liquidity analysis, AI-driven pattern recognition, smart-money protocols,...
🔥 PTS TRADE 666™ - ULTIMATE INSTITUTIONAL TOOL 🔥
GoldenTradeClub
GoldenTradeClub
Jul 4
1. Indicator Presentation Name: 🔥 PTS TRADE 666™ – ULTIMATE INSTITUTIONAL TOOL V2.0 Short ID: PTS666_UIT_V2 Type: Pine Script v5 overlay dashboard for TradingView Purpose: Combines institutional-grade footprint volume analysis, smart-money structure detection, statistical anomaly checks, multi-timeframe divergence, Ichimoku insights, pattern recognition, and an...
PTS Wizard
GoldenTradeClub
GoldenTradeClub
Jul 4
1. Indicator Presentation Name: PTS Wizard Short Title: PTS Wizard Type: Pine Script v5 overlay dashboard for TradingView Purpose: A unified multi-strategy toolkit that overlays key market insights—liquidity zones, smart-money structure, footprint-style volume profile, consolidation ranges, statistical deviation bands, price forecasts, and session analysis—into a...
🔥 PTS.TRADE 666™ ULTIMATE HYBRID + MTF V3
GoldenTradeClub
GoldenTradeClub
Jul 4
1. Indicator Presentation Name: 🔥 PTS.TRADE 666™ ULTIMATE HYBRID + MTF V3 Short ID: PTS666_ULTIMATE_MTF_V3 Type: Overlay dashboard for TradingView Purpose: A next-level hybrid trading suite that merges institutional-grade order-flow analysis, smart-money concepts, AI-driven insights, classic momentum oscillators (WaveTrend, divergence, “Gold” signals),...
🧙♂ PTS WIZARD V3.0 - FINAL EDITION
GoldenTradeClub
GoldenTradeClub
Jul 4
1. Indicator Presentation Name: 🧙♂ PTS WIZARD V3.0 – FINAL EDITION Short Title: PTS-WIZARD-V3-FINAL Type: Overlay trading dashboard for TradingView Purpose: A comprehensive multi-module indicator that blends classic cipher momentum signals, Elliott Wave pattern detection, advanced statistical analyses (Z-Score, Benford’s Law, Ehlers SNR), footprint-style volume...
🧙♂ PTS WIZARD V3.0 + FOOTPRINT ULTIMATE
GoldenTradeClub
GoldenTradeClub
Jul 4
Name: PTS WIZARD V3.0 + FOOTPRINT ULTIMATE Type: Overlay trading dashboard for TradingView Purpose: Combines classic cipher-style momentum signals with an advanced footprint volume profile, multi-timeframe bias, statistical filters, and a fusion-score system—displayed in a customizable on-chart dashboard. Core Modules Cipher Momentum Signals WaveTrend...
🧙♂ PTS WIZARD V3.0 - BASIC
GoldenTradeClub
GoldenTradeClub
Jul 1
PTS WIZARD V3.0 Basic – Ultimate Multi-Tool Trading Dashboard An all-in-one overlay combining classic cipher signals, Elliott Wave pattern detection, volume analytics, divergence spotting, and smart-entry timing—backed by advanced statistical filters and a live dashboard. Key Features Cipher Signals WaveTrend with overbought/oversold zones & cross signals RSI...
Trading Engine vCD AI
GoldenTradeClub
GoldenTradeClub
Jun 15
The Trading Engine includes the best and most effective technical analysis tools. It has 27 different Buy Signal parameters and 26 different Sell Signal parameters. Furthermore, it also has 9 Stop Loss triggers for Long Positions and 8 Stop Loss triggers for Short Positions. Many of the Buy or Sell Signal parameters function as Take Profit and Stop Loss signals...
Trading Engine vCD
GoldenTradeClub
GoldenTradeClub
Updated
Mar 21
The Trading Engine includes the best and most effective technical analysis tools. It has 27 different Buy Signal parameters and 26 different Sell Signal parameters. Furthermore, it also has 9 Stop Loss triggers for Long Positions and 8 Stop Loss triggers for Short Positions. Many of the Buy or Sell Signal parameters function as Take Profit and Stop Loss signals...
TE CLIENT v13
GoldenTradeClub
GoldenTradeClub
Updated
Mar 15
The Trading Engine includes the best and most effective technical analysis tools. It has 27 different Buy Signal parameters and 26 different Sell Signal parameters. Furthermore, it also has 9 Stop Loss triggers for Long Positions and 8 Stop Loss triggers for Short Positions. Many of the Buy or Sell Signal parameters function as Take Profit and Stop Loss signals...
Trading Engine v13
GoldenTradeClub
GoldenTradeClub
Updated
Mar 15
The Trading Engine includes the best and most effective technical analysis tools. It has 27 different Buy Signal parameters and 26 different Sell Signal parameters. Furthermore, it also has 9 Stop Loss triggers for Long Positions and 8 Stop Loss triggers for Short Positions. Many of the Buy or Sell Signal parameters function as Take Profit and Stop Loss signals...
Trading Engine B2B
GoldenTradeClub
GoldenTradeClub
Updated
Jan 14
The Trading Engine includes the best and most effective technical analysis tools. It has 25 different Buy Signal parameters and 24 different Sell Signal parameters. Furthermore, it also has 9 Stop Loss triggers for Long Positions and 8 Stop Loss triggers for Short Positions. Many of the Buy or Sell Signal parameters function as Take Profit and Stop Loss signals...
Trading Engine B2B FX V9
GoldenTradeClub
GoldenTradeClub
Updated
Jan 14
The VFLOW Trading Engine includes the best and most effective technical analysis tools. It has 20 different Buy Signal parameters and 18 different Sell Signal parameters. Furthermore, it also has 7 Stop Loss triggers for Long Positions and 5 Stop Loss triggers for Short Positions. Many of the Buy or Sell Signal parameters function as Take Profit and Stop Loss...
English
Select market data provided by ICE Data services.
Select reference data provided by FactSet. Copyright © 2025 FactSet Research Systems Inc.
© 2025 TradingView, Inc.
More than a product
Supercharts
Screeners
Stocks
ETFs
Bonds
Crypto coins
CEX pairs
DEX pairs
Pine
Heatmaps
Stocks
ETFs
Crypto
Calendars
Economic
Earnings
Dividends
More products
Yield Curves
Options
News Flow
Pine Script®
Apps
Mobile
Desktop
Tools & subscriptions
Features
Pricing
Market data
Trading
Overview
Brokers
Special offers
CME Group futures
Eurex futures
US stocks bundle
About company
Who we are
Athletes
Blog
Careers
Media kit
Merch
TradingView store
Tarot cards for traders
The C63 TradeTime
Policies & security
Terms of Use
Disclaimer
Privacy Policy
Cookies Policy
Accessibility Statement
Security tips
Bug Bounty program
Status page
Community
Social network
Wall of Love
Refer a friend
House Rules
Moderators
Ideas
Trading
Education
Editors' picks
Pine Script
Indicators & strategies
Wizards
Freelancers
Business solutions
Widgets
Charting libraries
Lightweight Charts™
Advanced Charts
Trading Platform
Growth opportunities
Advertising
Brokerage integration
Partner program
Education program
Look First
Close
Updated 3 hours ago
Institutional Analyst Board
Manage access
Remove from favorites
Use on chart
0
11
Jul 19
📊 Institutional Analyst Board – Smart Money Confluence Scanner for XAUUSD, Forex, Crypto
🔍 Overview
The Institutional Analyst Board is a complete multi-timeframe smart money toolkit designed for traders who demand clarity, confluence, and precision. It brings together institutional-grade metrics—Order Blocks (OB), Fair Value Gaps (FVG), Liquidity Sweeps, MACD/RSI bias, VWAP positioning, and Break of Structure (BoS)—into a single powerful visual dashboard.
This indicator is especially optimized for Gold (XAUUSD) but is also compatible with Crypto and Forex assets.
🧠 Key Features
✅ Multi-Timeframe Dashboard (5M / 15M / 1H)
✅ Order Block Detection with dynamic zones that extend until broken
✅ Fair Value Gap Detection with clear zone shading and border distinction
✅ MACD + RSI Confluence for momentum and bias alignment
✅ VWAP Positioning to identify premium/discount zones
✅ Liquidity Sweeps (internal/external range breaks)
✅ Killzone Highlighting (Asia / London / New York)
✅ Break of Structure (BoS) with advanced confluence filters
✅ Gold Bias Flags across timeframes (BUY / SELL / NEUTRAL)
✅ Dynamic Price Watermark with real-time data
✅ Fully customizable colors, transparencies, and text labels
🧠 How It Works
The Board uses institutional logic to analyze the chart in real time:
Metric Purpose
OB Zones Highlight potential smart money footprints where price is likely to react.
FVG Zones Identify imbalance areas between buyers and sellers—ideal for mean reversion entries.
MACD/RSI Confirm momentum direction and relative strength confluence.
VWAP Determine whether price is trading at a premium or discount.
Liquidity Sweeps Detect manipulative moves before major reversals.
BoS Mark potential trend reversals, filtered by institutional confluence.
Each signal is computed across 3 timeframes and visualized in a clean board that updates live. You’ll also see labels, alerts, and session overlays for maximum clarity.
📌 Ideal Use Case
This tool is perfect for:
Funded Challenge Traders (FTMO, MyForexFunds, etc.)
Gold scalpers and intraday traders
Crypto price action traders using BTC, ETH, SOL, etc.
Smart Money Concept (SMC) and ICT followers
⚙️ Customization Options
Toggle each module (OB, FVG, VWAP, MACD/RSI, etc.)
Set transparency and color for each zone type
Adjust Killzone timing (Asia, London, NY)
Control board position (Top/Bottom) and metric visibility
📈 Compatible Assets
✅ XAUUSD (optimized)
✅ Forex majors/minors
✅ Crypto pairs (BTC, ETH, SOL, etc.)
✅ Indices (GER40, NASDAQ, SPX with minor adaptation)
🛠️ Requirements
Use on TradingView v5
Set chart time to UTC+0 or UTC+3 for optimal Killzone accuracy
For crypto, redefine Killzone hours if needed (24/7 market)
🧠 Pro Tip
Pair this indicator with volume profile tools, CVD/Delta Flow, or Footprint overlays to build high-confidence trade setups with clear institutional confluence.
Search in scripts for "BOS"

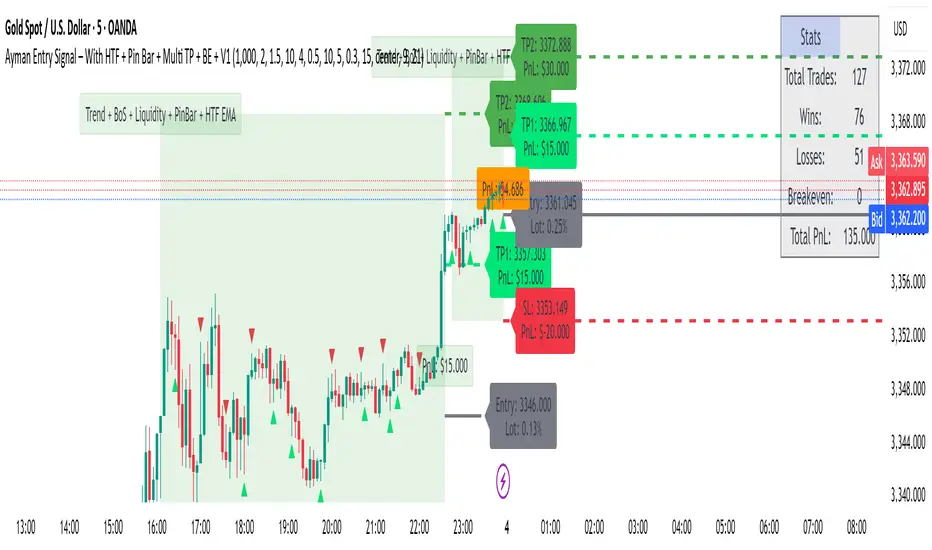
Ayman Entry Signal – With HTF + Pin Bar
A professional and versatile trading indicator combining classic technical analysis with Smart Money Concepts to detect high-probability entry points.
Designed especially for scalping gold and forex pairs on lower timeframes. Fully customizable to suit any trading style.
✅ Key Features:
EMA Trend Confirmation
Break of Structure (BoS) Detection
Order Block Zone Recognition
Fair Value Gap (FVG) Confirmation
Liquidity Sweep Detection
Pin Bar Candlestick Confirmation
Higher Timeframe Confirmation (HTF EMA + HTF BoS)
🎯 Smart Risk Management:
Automatically calculates Stop Loss (SL) and Take Profit (TP) based on the selected timeframe.
Dynamically adjusts lot size based on account capital and risk percentage.
📈 How It Works:
The indicator triggers a Buy or Sell signal only when a selected set of conditions are met, including:
Trend direction (EMA crossover)
Break of structure
Presence within strong supply/demand zones
Confirmation from higher timeframe
Reversal Pin Bar pattern
🛎 Alerts:
Built-in alert system notifies you instantly when a valid Buy or Sell signal is triggered.
⚙️ Customizable Settings:
Risk Percentage
Capital Size
HTF timeframe
Enable/Disable individual filters (EMA, BoS, OB, FVG, Liquidity, Pin Bar, HTF)
📌 Best Timeframes:
1-min, 5-min, and 15-min – especially during high-volume sessions like London or New York.
🔸 Note:
This is not financial advice. Always backtest and use manual confirmations before live trading.
PRO SMC DASHBOARDPRO SMC DASHBOARD - PRO LEVEL
Advanced Supply & Demand / SMC dashboard for scalping and intraday:
Multi-Timeframe Trend: Visualizes trend direction for M1, M5, M15, H1, H4.
HTF Supply/Demand: Shows closest high time frame (HTF) supply/demand zone and distance (in pips).
Smart “Flip” & Liquidity Signals: Flip and Liquidity Sweep arrows/signals are shown only when truly significant:
Near HTF Supply/Demand zone
And confirmed by volume spike or high confluence score
Momentum & Bias: Real-time momentum (RSI M1), H1 bias and fakeout detection.
Confluence Score: Objective score (out of 7) for trade confidence.
Volume Spike, Divergence, BOS: Includes volume spikes, RSI divergence (M1), and Break of Structure (BOS) for both M15 & H1.
Ultra-clean chart: Only valid signals/alerts shown; no spam or visual clutter.
Full dashboard with all signals and context, always visible bottom-right.
Best used for:
Forex, Gold/Silver, US indices, and crypto
Scalping/intraday with fast, clear decisions based on multi-factor SMC logic
Usage:
Add to your chart, monitor the dashboard for valid setups, and trade only when multiple factors align for high-probability entries.
How to Use the PRO SMC DASHBOARD
1. Add the Script to Your Chart:
Apply the indicator to your favorite Forex, Gold, crypto, or indices chart (best on M1, M5, or M15 for entries).
2. Read the Dashboard (Bottom Right):
The dashboard shows real-time information from multiple timeframes and key SMC filters, including:
Trend (M1, M5, M15, H1, H4):
Arrows show up (↑) or down (↓) trend for each timeframe, based on EMA.
Momentum (RSI M1):
Shows “Strong Up,” “Strong Down,” or “Neutral” plus the current RSI value.
RSI (H1):
Higher timeframe momentum confirmation.
ATR State:
Indicates current volatility (High, Normal, Low).
Session:
Detects if the market is in London, NY, or Asia session (based on UTC).
HTF S/D Zone:
Shows the nearest high timeframe Supply or Demand zone, its timeframe (M15, H1, H4), and exact pip distance.
Fakeout (last 3):
Detects recent false breakouts—if there are multiple fakeouts, potential for reversal is higher.
FVG (Fair Value Gap):
Indicates direction and distance to the nearest FVG (Above/Below).
Bias:
“Strong Buy,” “Strong Sell,” or “Neutral”—multi-timeframe, momentum, and volatility filtered.
Inducement:
Alerts for possible “stop hunt” or liquidity grab before reversal.
BOS (Break of Structure):
Recent or live breaks of market structure (for both M15 & H1).
Liquidity Sweep:
Shows if price just swept a key high/low and then reversed (often key reversal point).
Confluence Score (0-7):
Higher score means more factors align—look for 5+ for strong setups.
Volume Spike:
“YES” appears if the current volume is significantly above average—big players are active!
RSI Divergence:
Bullish or bearish divergence on M1—signals early reversal risk.
Momentum Flip:
“UP” or “DN” appears if RSI M1 crosses the 50 line, confirmed by location and other filters.
Chart Signals (Arrows & Markers):
Flip arrows (up/down) and Liquidity markers only appear when price is at/near a key Supply/Demand zone and confirmed by either a volume spike or strong confluence.
No signal spam:
If you see an arrow or LIQ tag, it’s a truly significant moment!
Suggested Trading Workflow:
Scan the Dashboard:
Is the multi-timeframe trend aligned?
Are you near a major Supply or Demand zone?
Is the Confluence Score high (5 or more)?
Check for Signals:
Is there a Flip or LIQ marker near a Supply/Demand zone?
Is volume spiking or a fakeout just occurred?
Look for Reversal or Continuation:
If there’s a Flip at Demand (with high confluence), consider a long setup.
If there’s a LIQ sweep + flip + volume at Supply, consider a short.
Manage Risk:
Don’t chase every signal.
Confirm with your entry criteria and preferred session timing.
Pro Tips:
Highest confidence trades:
When dashboard signals and chart arrows/markers agree, especially with high confluence and volume spike.
Adapt pip distance filter:
Dashboard is tuned for FX and gold; for other assets, adjust pip-size filter if needed.
Use alerts (if enabled):
Set up custom TradingView alerts for “Flip” or “Liquidity” signals for auto-notifications.
Designed to help you make professional, objective decisions—without chart clutter or second-guessing!

Fractal Pullback Market StructureFractal Pullback Market Structure
Author: The_Forex_Steward
License: Mozilla Public License 2.0
The Fractal Pullback Market Structure indicator is a sophisticated price action tool designed to visualize internal structure shifts and break-of-structure (BoS) events with high accuracy. It leverages fractal pullback logic to identify market swing points and confirm whether a directional change has occurred.
This indicator detects swing highs and lows based on fractal behavior, drawing zigzag lines to connect these key pivot points. It classifies and labels each structural point as either a Higher High (HH), Higher Low (HL), Lower High (LH), or Lower Low (LL). Internal shifts are marked using triangle symbols on the chart, distinguishing bullish from bearish developments.
Break of Structure events are confirmed when price closes beyond the most recent swing high or low, and a horizontal line is drawn at the breakout level. This helps traders validate when a structural trend change is underway.
Users can configure the lookback period that defines the sensitivity of the pullback detection, as well as a timeframe multiplier to align the logic with higher timeframes such as 4H or Daily. There are visual customization settings for the zigzag lines and BoS markers, including color, width, and style (solid, dotted, or dashed).
Alerts are available for each key structural label—HH, HL, LH, LL—as well as for BoS events. These alerts are filtered through a selectable alert mode that separates signals by timeframe category: Low Timeframe (LTF), Medium Timeframe (MTF), and High Timeframe (HTF). Each mode allows the user to receive alerts only when relevant to their strategy.
This indicator excels in trend confirmation and reversal detection. Traders can use it to identify developing structure, validate internal shifts, and anticipate breakout continuation or rejection. It is particularly useful for Smart Money Concept (SMC) traders, swing traders, and those looking to refine entries and exits based on price structure rather than lagging indicators.
Visual clarity, adaptable timeframe logic, and precise structural event detection make this tool a valuable addition to any price action trader’s toolkit.

Rally/Drop Market Structure (Multi-Timeframe)Rally/Drop Market Structure
Supply and Demand Zones from Bullish/Bearish Breaks
Overview:
The Rally/Drop Market Structure indicator is a powerful price action tool that identifies key structural turning points in the market by detecting bullish and bearish breaks . After each confirmed break, it plots either a demand zone (following a bullish break or rally) or a supply zone (following a bearish break or drop). These zones represent institutional footprints — areas where price is likely to react due to imbalance or unfilled orders.
The indicator is based on synthetic higher timeframe (HTF) candles to provide a more stable and smoothed structural map, improving clarity and signal quality over raw candles.
How It Works:
- A bullish break is defined when price makes a higher high and a higher low (or closes above the previous high depending on your selected mode).
- A bearish break is defined when price makes a lower high and a lower low (or closes below the previous low).
- After a bullish break, the indicator plots a demand zone based on the low and high of the most recent bearish candle — representing where demand stepped in.
- After a bearish break, the indicator plots a supply zone from the most recent bullish candle — indicating where supply took control.
- Optional mitigation logic marks zones as mitigated (or deletes them) once price trades into the opposing side.
- Internal shift detection highlights swing highs and lows , labels structural points (HH, HL, LH, LL), and identifies potential liquidity sweeps .
Features:
- Dynamic plotting of rally-based demand zones and drop-based supply zones
- Toggle to use Highs/Lows or Close-based breaks for structure
- Support for LTF, MTF, and HTF analysis (with selectable timeframe)
- Zone mitigation logic with optional automatic cleanup
- Labeling of key swing points: HH , HL , LH , LL , and LS (Liquidity Sweep)
- Zigzag visualization for structure flow
- Alert-ready for internal shifts, BoS, and zone creation
- Separate styling options for BoS lines, internal shift shapes, and zone colors
How to Use:
- Set your desired HTF candle source (e.g., 1H or 4H) depending on your trading style.
- Use Highs/Lows mode for pure price action structure or Close mode for more conservative signals.
- Observe when a bullish break occurs — a demand zone will form where price previously dropped before rallying. Look for long opportunities if price revisits this zone.
- After a bearish break , a supply zone forms where the rally failed — use this to scout short entries on retests.
- Use BoS lines to confirm structure shifts and validate entry triggers or trend direction.
- Monitor mitigated zones for reduced reliability or avoid them completely by enabling automatic deletion.
- Use alerts to stay notified about key changes without watching the chart constantly.
Recommended Strategies:
- Smart money or ICT-style trading : identify institutional footprints and mitigation setups
- Reversal trading : catch price rejecting off unmitigated zones after structure break
- Trend continuation : enter in the direction of internal structure after pullbacks into zones
- Liquidity sweep confirmation : filter out false breaks using HH/LL with LS detection
Tips:
- Combine this indicator with a higher timeframe bias tool (e.g., moving average, higher timeframe market structure).
- For scalping, use tighter HTFs and reduce the zone duration.
- For swing trading, use larger HTFs (1H, 4H, Daily) and increase zone persistence.
Summary:
The Rally/Drop Market Structure indicator gives you an actionable framework for understanding price structure, market intent, and supply/demand imbalances. Whether you're looking for precision entries, trend confirmation, or smart money concepts, this tool helps simplify complex price behavior into clean, usable structure and zones.

Alpha - Combined BreakoutThis Pine Script indicator, "Alpha - Combined Breakout," is a combination between Smart Money Breakout Signals and UT Bot Alert, The UT Bot Alert indicator was initially developer by Yo_adriiiiaan
The idea of original code belongs HPotter.
This Indicator helps you identify potential trading opportunities by combining two distinct strategies: Smart Money Breakout and a modified UT Bot (likely a variation of the Ultimate Trend Bot). It provides visual signals, draws lines for potential take profit (TP) and stop loss (SL) levels, and includes a dashboard to track performance metrics.
Tutorial:
Understanding and Using the "Alpha - Combined Breakout" Indicator
This indicator is designed for traders looking for confirmation of market direction and potential entry/exit points by blending structural analysis with a trend-following oscillator.
How it Works (General Concept)
The indicator combines two main components:
Smart Money Breakout: This part identifies significant breaks in market structure, which "smart money" traders often use to gauge shifts in supply and demand. It looks for higher highs/lows or lower highs/lows and flags when these structural points are broken.
UT Bot: This is a trend-following component that generates buy and sell signals based on price action relative to an Average True Range (ATR) based trailing stop.
You can choose to use these signals independently or combined to generate trading alerts and visual cues on your chart. The dashboard provides a quick overview of how well the signals are performing based on your chosen settings and display mode.
Parameters and What They Do
Let's break down each input parameter:
1. Smart Money Inputs
These settings control how the indicator identifies market structure and breakouts.
swingSize (Market Structure Time-Horizon):
What it does: This integer value defines the number of candles used to identify significant "swing" (pivot) points—highs and lows.
Effect: A larger swingSize creates a smoother market structure, focusing on longer-term trends. This means signals might appear less frequently and with some delay but could be more reliable for higher timeframes or broader market movements. A smaller swingSize will pick up more minor market structure changes, leading to more frequent but potentially noisier signals, suitable for lower timeframes or scalping.
Analogy: Think of it like a zoom level on your market structure map. Higher values zoom out, showing only major mountain ranges. Lower values zoom in, showing every hill and bump.
bosConfType (BOS Confirmation Type):
What it does: This string input determines how a Break of Structure (BOS) is confirmed. You have two options:
'Candle Close': A breakout is confirmed only if a candle's closing price surpasses the previous swing high (for bullish) or swing low (for bearish).
'Wicks': A breakout is confirmed if any part of the candle (including its wick) surpasses the previous swing high or low.
Effect: 'Candle Close' provides stronger, more conservative confirmation, as it implies sustained price movement beyond the structure. 'Wicks' provides earlier, more aggressive signals, as it captures momentary breaches of the structure.
Analogy: Imagine a wall. 'Candle Close' means the whole person must get over the wall. 'Wicks' means even a finger touching over the top counts as a breach.
choch (Show CHoCH):
What it does: A boolean (true/false) input to enable or disable the display of "Change of Character" (CHoCH) labels. CHoCH indicates the first structural break against the current dominant trend.
Effect: When true, it helps identify early signs of a potential trend reversal, as it marks where the market's "character" (its tendency to make higher highs/lows or lower lows/highs) first changes.
BULL (Bullish Color) & BEAR (Bearish Color):
What they do: These color inputs allow you to customize the visual appearance of bullish and bearish signals and lines drawn by the Smart Money component.
Effect: Purely cosmetic, helps with visual identification on the chart.
sm_tp_sl_multiplier (SM TP/SL Multiplier (ATR)):
What it does: A float value that acts as a multiplier for the Average True Range (ATR) to calculate the Take Profit (TP) and Stop Loss (SL) levels specifically when you're in "Smart Money Only" mode. It uses the ATR calculated by the UT Bot's nLoss_ut as its base.
Effect: A higher multiplier creates wider TP/SL levels, potentially leading to fewer trades but larger wins/losses. A lower multiplier creates tighter TP/SL levels, potentially leading to more frequent but smaller wins/losses.
2. UT Bot Alerts Inputs
These parameters control the behavior and sensitivity of the UT Bot component.
a_ut (UT Key Value (Sensitivity)):
What it does: This integer value adjusts the sensitivity of the UT Bot.
Effect: A higher value makes the UT Bot less sensitive to price fluctuations, resulting in fewer and potentially more reliable signals. A lower value makes it more sensitive, generating more signals, which can include more false signals.
Analogy: Like a noise filter. Higher values filter out more noise, keeping only strong signals.
c_ut (UT ATR Period):
What it does: This integer sets the look-back period for the Average True Range (ATR) calculation used by the UT Bot. ATR measures market volatility.
Effect: This period directly influences the calculation of the nLoss_ut (which is a_ut * xATR_ut), thus defining the distance of the trailing stop loss and take profit levels. A longer period makes the ATR smoother and less reactive to sudden price spikes. A shorter period makes it more responsive.
h_ut (UT Signals from Heikin Ashi Candles):
What it does: A boolean (true/false) input to determine if the UT Bot calculations should use standard candlestick data or Heikin Ashi candlestick data.
Effect: Heikin Ashi candles smooth out price action, often making trends clearer and reducing noise. Using them for UT Bot signals can lead to smoother, potentially delayed signals that stay with a trend longer. Standard candles are more reactive to raw price changes.
3. Line Drawing Control Buttons
These crucial boolean inputs determine which type of signals will trigger the drawing of TP/SL/Entry lines and flags on your chart. They act as a priority system.
drawLinesUtOnly (Draw Lines: UT Only):
What it does: If checked (true), lines and flags will only be drawn when the UT Bot generates a buy/sell signal.
Effect: Isolates UT Bot signals for visual analysis.
drawLinesSmartMoneyOnly (Draw Lines: Smart Money Only):
What it does: If checked (true), lines and flags will only be drawn when the Smart Money Breakout logic generates a bullish/bearish breakout.
Effect: Overrides drawLinesUtOnly if both are checked. Isolates Smart Money signals.
drawLinesCombined (Draw Lines: UT & Smart Money (Combined)):
What it does: If checked (true), lines and flags will only be drawn when both a UT Bot signal AND a Smart Money Breakout signal occur on the same bar.
Effect: Overrides both drawLinesUtOnly and drawLinesSmartMoneyOnly if checked. Provides the strictest entry criteria for line drawing, looking for strong confluence.
Dashboard Metrics Explained
The dashboard provides performance statistics based on the lines drawing control button selected. For example, if "Draw Lines: UT Only" is active, the dashboard will show stats only for UT Bot signals.
Total Signals: The total number of buy or sell signals generated by the selected drawing mode.
TP1 Win Rate: The percentage of signals where the price reached Take Profit 1 (TP1) before hitting the Stop Loss.
TP2 Win Rate: The percentage of signals where the price reached Take Profit 2 (TP2) before hitting the Stop Loss.
TP3 Win Rate: The percentage of signals where the price reached Take Profit 3 (TP3) before hitting the Stop Loss. (Note: TP1, TP2, TP3 are in order of distance from entry, with TP3 being furthest.)
SL before any TP rate: This crucial metric shows the number of times the Stop Loss was hit / the percentage of total signals where the stop loss was triggered before any of the three Take Profit levels were reached. This gives you a clear picture of how often a trade resulted in a loss without ever moving into profit target territory.
Short Tutorial: How to Use the Indicator
Add to Chart: Open your TradingView chart, go to "Indicators," search for "Alpha - Combined Breakout," and add it to your chart.
Access Settings: Once added, click the gear icon next to the indicator name on your chart to open its settings.
Choose Your Signal Mode:
For UT Bot only: Uncheck "Draw Lines: Smart Money Only" and "Draw Lines: UT & Smart Money (Combined)". Ensure "Draw Lines: UT Only" is checked.
For Smart Money only: Uncheck "Draw Lines: UT Only" and "Draw Lines: UT & Smart Money (Combined)". Ensure "Draw Lines: Smart Money Only" is checked.
For Combined Signals: Check "Draw Lines: UT & Smart Money (Combined)". This will override the other two.
Adjust Parameters:
Start with default settings. Observe how the signals appear on your chosen asset and timeframe.
Refine Smart Money: If you see too many "noisy" market structure breaks, increase swingSize. If you want earlier breakouts, try "Wicks" for bosConfType.
Refine UT Bot: Adjust a_ut (Sensitivity) to get more or fewer UT Bot signals. Change c_ut (ATR Period) if you want larger or smaller TP/SL distances. Experiment with h_ut to see if Heikin Ashi smoothing suits your trading style.
Adjust TP/SL Multiplier: If using "Smart Money Only" mode, fine-tune sm_tp_sl_multiplier to set appropriate risk/reward levels.
Interpret Signals & Lines:
Buy/Sell Flags: These indicate the presence of a signal based on your selected drawing mode.
Entry Line (Blue Solid): This is where the signal was generated (usually the close price of the signal candle).
SL Line (Red/Green Solid): Your calculated stop loss level.
TP Lines (Dashed): Your three calculated take profit levels (TP1, TP2, TP3, where TP3 is the furthest target).
Smart Money Lines (BOS/CHoCH): These lines indicate horizontal levels where market structure breaks occurred. CHoCH labels might appear at the first structural break against the prior trend.
Monitor Dashboard: Pay attention to the dashboard in the top right corner. This dynamically updates to show the win rates for each TP and, crucially, the "SL before any TP rate." Use these statistics to evaluate the effectiveness of the indicator's signals under your current settings and chosen mode.
*
Set Alerts (Optional): You can set up alerts for any of the specific signals (UT Bot Long/Short, Smart Money Bullish/Bearish, or the "Line Draw" combined signals) to notify you when they occur, even if you're not actively watching the chart.
By following this tutorial, you'll be able to effectively use and customize the "Alpha - Combined Breakout" indicator to suit your trading strategy.

AQPRO Block Force
📝 INTRODUCTION
AQPRO Block Force is a powerful trading tool designed to identify and track Orderblocks (OBs) in real-time based on Fair Value Gap (FVG) principles. This indicator employs quite strict yet effective FVG filtering criteria to ensure only significant OBs are displayed, avoiding minor inefficiencies or duplicates within the same impulse or corrective moves. Each OB adapts dynamically to price action and can be categorized as Classic, Strong, or Extreme, based on proprietary conditions and best ideas from SMC (Smart Money Concepts).
In addition to plotting Orderblocks, the indicator offers useful filtering systems like an Age Filter to ensure cleanliness of the OB data on the chart and prevent old, irrelevant OBs from obstructing the chart. Users can also enable MTF (Multi-Timeframe) functionality to view OBs from other timeframes, providing a comprehensive analysis across multiple levels of market structure. With extensive customization options, AQPRO Block Force allows traders to tailor the visuals and behavior to fit their specific trading preferences.
This indicator does not parse any instituotinal data, order books and other fancy financial sources for finding order blocks nor it uses them for confirmation purposes. Calculations algorithms of order blocks are based purely on current asset's price history.
IMPORTANT NOTE: in the sections below term 'quality' will be applied to orderblocks quite a number of times. By 'quality' in the context of orderblocks we mean the reaction of price upon the sweep of orderblock. Basically, if the price reverses after reaching the orderblock, this orderblock is considered to be of high quality. Definition for low -quality orderblock can be deducted by analogy.
🎯 PURPOSE OF USAGE
This indicator serves one and only purpose — help traders identify most lucrative institutional orderblocks on the chart in real time. Even though event of price reaching an orderblock cannot be considered as a sole signal in many trading strategies without proper confirmation, such event nevertheless is quite important in SMC-based trading, because when price sweeps OB it usually means, that a reversal will soon follow, but, of course, this is not the case every time.
Traders should not expect from this indicator detection of perfect orderblocks, which would surely revese the price on encounter, but they can expect is a time-proven algorithm of determing orderblocks that on average produces more high-quality orderblocks than simple similar tools from open-source libraries.
More in-depth advices on the usage will be given in the sections below, but for now let's summarise subgoals of the indicator:
Detecting orderblocks filtered through strict FVG validation rules to improve overall quality of orderblocks;
Classifying orderblocks as Classic, Strong, or Extreme based on wether or not classic orderblocks pass filtering conditions, which are based on crossing critical price levels and SMC principles like ChoCh (Change of Character);
Eliminating clutter and manage chart space with the Age Filter, removing old OBs outside a user-defined age range;
Utilizing MTF functionality to track significant OBs from other timeframes alongside current timeframe analysis;
Providing traders with customization options for indicator's visuals to help them organize information on the chart in a clean way.
⚙️ SETTINGS OVERVIEW
This indicator's customization options allow you to fully control its functionality and visuals. Below is a breakdown of the settings grouped by the exact setting sections and parameters from the indicator:
🔑 Main Settings
Show OBs from current timeframe — toggles the display of OBs from the current timeframe on the chart;
Show classic OBs — enables or disables the display of Classic OBs;
Show strong OBs — enables or disables the display of Strong OBs, which meet the ChoCh-based filter criteria;
Show extreme OBs — enables or disables the display of Extreme OBs, which exceed proprietary price level risk thresholds.
⏳ Filter: Age
Use Age Filter — toggles the Age Filter, which removes old OBs based on their age;
Max Age — sets the maximum age of OBs to be displayed (in bars). OBs older than this value will be hidden;
Min Age — sets the minimum age of OBs to be displayed (in bars). OBs younger than this value will not be shown.
🌋 MTF Settings
Show MTF OBs — toggles the display of OBs from higher timeframes;
Timeframe — select the timeframe to use for MTF OB detection (e.g., 15m, 1h).
⏳ MTF / Filter: Age
Use Age Filter (MTF) — toggles the Age Filter for MTF OBs;
Max Age — sets the maximum age of MTF OBs to be displayed (in bars);
Min Age — sets the minimum age of MTF OBs to be displayed (in bars).
🎨 Visual Settings
Classic OB (Bullish) — sets the color for bullish Classic OBs;
Classic OB (Bearish) — sets the color for bearish Classic OBs;
Strong OB (Bullish) — sets the color for bullish Strong OBs;
Strong OB (Bearish) — sets the color for bearish Strong OBs;
Extreme OB (Bullish) — sets the color for bullish Extreme OBs;
Extreme OB (Bearish) — sets the color for bearish Extreme OBs.
📈 APPLICATION GUIDE
Application methodology of this indicator is pretty much the same as with any other indicator, whose purpose is to find and display orderblocks on the chart. However, before actually diving into the guide on application, we want to make a small step back to remind traders of the history of orderblocks as a concept, its limitations and benefits.
Orderblocks themselves are essentially just zones of potential institutional interest, which if reached are expected to reverse the price in the opposite direction. 'Potential' is a suitable remark for indicator's success probability, because, as was mentioned above, orderblocks don't guarantee price reversal regardless of quality of the indicator. This is the case for the simplest of reasons — orderblocks are based solely on price history and thus are to be considered a mathematical model , degree of success of which is never 100%, because all mathematical models abide by a "golden rule of trading" : past performance doesn't guarantee future results.
However, the extensive history of orderblocks clearly shows that this tool, despite being decades old, can still help traders produce market insights and improve any strategy's performance. Orderblocks can be used both as a primary source of signals and as confirmation tool, but from our experience they are better to be used as confirmation tool. Our indicator is not an exception in this matter and we advice any trader to use it mainly for confirmation purposes, because use-case of orderblocks as confirmation tools have much success stories on average than being used as primary signal source.
This being said, let's return to the application guide and start reviewing the indicator from the most basic step — how it will look like when you first load it on your chart:
This indicator consisis of 3 main logic blocks:
Orderblock evaluation;
MTF Orderblock evaluation;
Orderblock post-filtering.
The principles behind these logic blocks will be easy to understand for truly experiences traders, but we understand the need to explain them to a wider audience, so let's review each of these logic blocks below.
ORDERBLOCK EVALUATION
Principles behind our orderblock detection logic are as follows:
Find FVG (Fair Value Gap) .
Note: this indicator uses only three-candle FVGs and doesn't track FVGs with insidebars after third (farther) candle.
If you don't know what FVG means, we recommend researching this term in the Internet, but the basic explanation is this: FVG is the formation of candles, which are positioned in a way that there are an unclosed price area between 1st and 3rd candle.
Conditions:
bullish FVG = high of 3rd candle < low of 1st candle AND high of 3rd candle < close of 2nd candle AND high of 2nd candle < close of 1st candle AND low of 3rd candle < low of 2nd candle ;
bearish FVG = low of 3rd candle < high of 1st candle AND low of 3rd candle > close of 2nd candle AND low of 2nd candle > close of 1st candle AND high of 3rd candle > high of 2nd candle .
See visual showcase of valid & invalid bullish & bearish FVGs on the screenshot below:
As was shown on the screenshot above, the only correc t formation for FVGs are considered to be just like on pictures 1 and 2 (leftmost column of patterns) . Only these formations will take part in further determenings orderblocks.
Send FVGs through filtering conditions.
This is the truly important part. Without properly filtering FVGs we would get huge clusters of FVGs on the chart and they will not make sense to be reviewed, because there will be just too much of them and their quality will be very questionable .
Even though there is a quite number of ways to filter FVGs, we decided to go with the ones we deem actually useful. For this indicator we chose two methods, that work in tandem — 1) base candle's inside bar condition and 2) single appearance on current impulse/correction line. Let's review these conditions below and start with looking at the examples of them on the screenshot below:
Examples of 1st & 2nd conditions are displayed on the left and right charts respectively.
The filtering logic in 1st and 2nd is quite connected and further explanation should help you understand it just enough to start trading with our indicator.
Let's start with explaining the term 'base candle' and logic behind it. Base candle candle be explained quite shortly: it is the latest candle on the chart, whose high or low broke previous base candle's high or low respectively. The first candle in the time series of price data is by default considered the base candle. If any new candle after base candle doesn't overtake base candle's high or low (meaning, that this candle is inside the range of base candle), such candle is called an "inside bar" .
Inside bar's term is important to understand, because FVGs, which appear inside the inside bars are usually quite useless, because price doesn't react from them, so orderblocks with such FVGs are also of bad quality as well. Clear depiction of inside bar was provided in the screenshot of conditions above on the left chart, so we won't waste time making another example.
However, this is not it. Base candle, inside bars and a few other types of bars are all a part of SMC ideas and in the world of SMC there is a special term, that hold the most important place and is considered the cornerstone of SMC methodology — impulse/correction lines (valid pullbacks) . The average definition of impulse/correction lines is quite hard to understand for an average trader, but we can summarise like this:
Impulse/correction line is a line, that starts at the beginning of the sequence of base candles, each new candle of which consistently updates previous base candle's respective high/low.
We won't go into description of this principle because it is outside of scope of this indicator, but you can research this topic in the Internet by keywords ' impulse correction trading ' or 'valid pullback principles trading '. The general idea of usage of impulse/correction lines in the context of this indicator is that each such lines 'holds' inside at least one FVG and we need to find exactly the first FVG, while leaving all other FVGs behind, because they to be of worse quality on average.
Basically, by using translating these terms into conditions from example above, we have achieved a simple yet powerful filtering system. system for FVGs, which allows us to work with orderblocks of much higher quality than average open-source indicators.
If FVG passed filters, evaluate its OB.
When FVG is confirmed, we can start the evaluation of its orderblock. The evaluation of orderblocks consists of several checkpoints: 1) is orderblock beyond current ChoCh* AND/OR 2) is orderblock from extreme price levels, calculated by our proprietary risk system. Let's review these checkpoints below.
* ChoCh (Change of Character, fundamental SMC idea) — price level, which if broken by close of price can potentially cause a revesal of the trend to direction opposite to the the previous one. To learn more about ChoCh please research the term on the Internet, because this indicator uses its standard definition and explaining of this term goes beyond the scope of this indicator.
To determine if orderblock is beyond current ChoCh levels, we need to first determine where these levels are on the chart. ChoCh levels of this indicator are calculated with a very lite approach, which is based on pivot points.
You can see basic demonstration of ChoCh levels in action on the screenshot below:
IMPORTANT NOTE: pivot period for pivots points inside our indicator is by default equal to 5 and cannot be changed in settings at the moment of publication.
On the screenshot above you can clearly see that ChoCh levels are essentially highest/lowest pivot point levels in between certain range of bars, where price doesn't update its extremum. You can see on there screenshot a new type of line — BoS (Break of Structure). BoS is almost the same thing as ChoCh, but with one change: it is a confirmation of price updating its extremum in the same direction as it was before, while ChoCh updates price extremum in the direction opposite to which it was before .
Why do these levels matter when evaluating the orderblocks? Orderblocks, which are located beyond current BoS/ChoCh levels, are of much higher quality on average than average orderblocks and they are called Strong Orderblocks .
On the chart such orderblocks are marked with 'Strong OB' label inside the body of an orderblock.
You can see the examples of Strong OBs on the screenshot below:
That was the explanation of the 1st orderblock evaluation criteria. Now let's talk about the 2nd one.
Our 2nd evaluation criteria for orderblocks is a test on whether or price is behind specific price level, which is calculated by our proprietary risk system, which is based on fundamental of statistics, such as 'standard deviation' and etc.
This criteria allows us to catch orderblocks, which are located at quite extreme price levels, and mark them on trader's chart explicitly. Orderblocks, which are above our custom price levels, are called Extreme Orderblocks an are marked with 'Extreme OB' label inside orderblock's body.
You can see the example of Extreme OB on the screenshot below:
That was the explanation of the 2nd evaluation criteria of the orderblock.
If an orderblock doesn't pass any of these two criterias, it is considered a classic orderblock. These orderblock are most common ones and have the lowest success rate among other types of orderblocks, listed above. Such orderblocks are marked with 'OB' label inside the orderblock's body.
You can see the examples of classic OB on the screenshot below:
This is it for orderblock evaluation logic. After doing all these steps, all orderblocks that we found are collected and displayed on the chart with their bodies and label marks.
What happens after the detection of the orderblocks?
All active orderblocks are being tracked in real time and their statuses are being updated as well (Strong orderblock can become Extreme orderblock and vice versa) . By an active orderblock we mean an orderblock, which wasn't swept by price's high or low. Bodies of active orderblocks are prolonged to the next candle on each new candle.
If an orderblock was swept, indicator will stop prolonging this orderblock and will mark it as swept on the chart with almost hollow body and dashed border line of the orderblock's body. Also swept orderblocks lose their name label, so you won't see any text in the orderblock after it was swept, but you will see its colour.
You can see the example of an active & swept orderblocks on the screenshot below:
This functionality helps distinguish active orderblocks from swept ones (inactive) and make more informed decisions.
MTF OB EVALUATION
Principles of MTF OBs evaluation are exactly the same as they are for current timeframe's OBs.
MTF OBs are displayed on the chart in same way as other OBs, but with one little change: to the right side of MTF OB's status will be postfix of the timeframe, from which this OB came from. Timeframe for MTF OBs can be chosen by user in the settings of the indicator.
MTF OBs also preserve their statuses (Strong, Extreme and Classic) when displayed on the current timeframe, so you won't stack of mistakenly marked MTF OBs as Extreme just because they are far away from the price.
You can see the example of MTF OBs on the screenshot below:
Also MTF OBs when swept lose only their name label, but the timeframe postfix will still be there, so you could distinguish MTF OBs from OBs of the current timeframe.
See the example of swept MTF OBs below:
Overall MTF orderblocks is a very useful to get a sense of where the higher timeframe liquidity reside and then adjust your strategy accordingly. Taking your trades from the place of high liquidity, like orderblocks, doesn't guarantee certain solid price reaction, but it definitely provides a trader with much a greater change of 1) catching a decent price move 2) not losing money white trading against institutional players.
As was stated above, we recommend using this tool as a confirmation system for your main trading strategy, because its usage as primary source of signals in the long-run is not viable, judging from historical backtest results and general public opinions of traders.
ORDERBLOCK POST-FILTERING
To enhance filtering capabilities of this indicator even further, we decided to add two filters, which would help reduce the amount of bad and untradeable orderblocks. These two filters are 1) age filter and 2) cancellation filter. Let's review both of them below.
Talking about the age filter , this filter was designed to help get rid of old orderblocks, which clutter the chart with visual noise and make it harder to find valueable orderblocks. This filter has to parameters: min age and max age . What does age mean in the context of an orderblock? It is the distance between OB's left border's bar and current bar. If this distance is between min age and max age values, such orderblock is considered valid and age filter passes it for further evaluation, but this distance is too short or too long, age filter deletes this orderblock from the chart.
You can the example of an orderblock which didn't pass age filter requirements and was deleted from the chart on the screenshot below:
It is important to mention that the missing orderblock from the right chart will be appear on the chart right when its age will exceed min age parameter of age filter.
The principle of work for max age parameter can be deducted by analogy: if the orderblock's age in bigger than max age value of age filter, this orderblock will be deleted from the chart .
For MTF OBs we decided to their own age filter, so that it won't abide by current timeframe's restrictions, because MTF OBs are usually much older than OB from current timeframe, so they would deleted a lot of time before they even appear on the chart, if they would abide by the age filter of current timeframe.
Default parameters of age filter are "max age = 500" and "min age = 0" . "Min age = 0" means that there is restrictions on the minimum age of orderblocks and they will appear on the chart as soon as the indicator validates them.
That was the explanation of the age filter.
Talking about the cancellation filter , this filter was intended to spot orderblocks which were extremely untradable and visually alert traders about them on the chart. In this indicator this filter works like this: for each orderblock cancellation filter creates a special price level and checks if it was broken by the close of price.
This special price level consists of the farthest border. of the orderblock ( top border for bearish OBs and bottom border for bullish OBs) and a certain threshold, which is added to the farthest border. This threshold is based on the current ATR value of the asset. This filter helps detect the orderblocks which should not be considered for trading, because price has already went too far beyond the liquidity of this orderblock.
Orderblocks, which are spotted by this filter, are marked with '❌' emoji on the price history.
You can see the example of an orderblock which was spotted by the cancellation filter in the screenshot below:
This filter is applied to both current timeframe and MTF timeframe and is NOT configurable in the settings.
🔔 ALERTS
This indicator employs alerts for an event when new signal occurs on the current timeframe or on MTF timeframe. While creating the alert below 'Condition' field choose 'any alert() function call'.
When this alert is triggered, it will generate this kind of message:
// Alerts for current timeframe
string msg_template = "EXCHANGE:ASSET, TIMEFRAME: BULLISH_OR_BEARISH OB at SWEPT_OB_BORDER_PRICE was reached."
string msg_example = "BINANCE:BTCUSDT, 15m: bearish OB at 170000.00 was reached."
// Alerts for MTF timeframe
string msg_template_mtf = "EXCHANGE:ASSET, TIMEFRAME: BULLISH_OR_BEARISH MTF OB at SWEPT_OB_BORDER_PRICE was reached."
string msg_example_mtf = "BINANCE:BTCUSDT, 15m: bearish MTF OB at 170000.00 was reached."
📌 NOTES
These OBs work on any timeframe, but we would advise to to use on higher timeframes, starting from at least 15m, because liquidity from higher timeframe tends to be much valuable when deciding which orderblock to take for a trade;
Use these OBs as a confirmation tool for your main strategy and refrain from using them as primary signal source. Traders, which use SMC-based strategies, will benefit from these orderblocks the most;
We recommend trading only with Strong and Extreme orderblocks, because they are proved to be of much greater quality than classic orderblocks and they work quite well in mid-term and long-term trading strategies. Classic orderblocs can be used for short-term trading strategies, but even in this case these OBs cannot be blindly trusted;
We strongly advise against take for a trading orderblocks, which were spotted by cancellation filter, because they are considered to be voided of liquidity;
Don't forget that you can toggle different types of OBs, MTF settings and visual settings in the settings of the indicator and fine-tune them to your liking.
🏁 AFTERWORD
AQPRO Block Force is an indicator which designed with idea of helping trading save time on automatically detecting valuable orderblocks on the chart, evaluate their strength and filter out bad orderblocks. These employ the best principles of SMC, including FVGs, valid pullbacks and etc. FVGs play the key role in validating the existence of a particular orderblock and work in tandem with valid pullback to determine the maximum amount of true FVGs even in the most cluttered impulse/correction moves of the price. Our filters — Age Filter and Cancellation Filter — enhance the quality of the orderblocks by allowing only the newest and liquid orderblocks to appear on the chart. Additional MTF functionality allow trader to see orderblocks from other timeframe, which can be chosen in the settings, and get a sense of where the global liquidity resides. This indicator will be a useful confirmation tool to any trading strategy, but the SMC traders will surely get the most benefits out of it.
ℹ️ If you have questions about this or any other our indicator, please leave it in the comments.

cd_mtg_CxThis indicator is designed to show discount / premium zones and price gaps (fvg) on the screen within a rule.
Overview:
As it is known, the price continues its movement with swings and uses some zones to continue or reverse its movement. Commonly used of these zones are named by different traders such as supply / demand, order block, suport/ resistance zone. And again, many traders prefer to be involved in the entry when the price determined with the help of market structure reaches the premium / discount zones.
Expectation from the indicator and how it works:
Identify areas where the price is likely to react.
Zones to be determined for this purpose:
1- Discount / premium zones
2- Mitigation zones with price retesting
3- Price gaps (FVG's)
How is it determined?
1- Tracks the price in the higher timeframe it is alignment with, when the price violates the previous candle in the new candle (high/low), the previous candle's zones between top/bottom - middle levels.
high - middle => premium zone
low - middle => discount zone
and displays it on the screen.
2- Mitigation zones: When the price retests the discount/premium zones, those zones appear on the screen by extending to the last bar and are named as mitigation zones in the indicator.
3- Price gaps (FVG's): It is shown on the screen with known rules and higher time frame option.
Zones where the price does not respect are deleted from the display.
Settings:
- HTF for mitigation zones : Alignment high time frame selection
- HTF for FVG zones : Alignment high time frame selection
- Show HTF boxes : Show / hide
- Show Mitigation zones : Show / hide
- Show Discount/Premium zones: Show / hide
- Show FVG zones : Show / hide
And colors….
Screenshots and example :
The 15m chart is open on the screen and I select the alignment time zone H4. I select the higher time zone H1 in FVGs.
Screenshot with Show HTF boxes and Show FVG zones selected:
With show discount / premium zones selected :
With show mitigation zones selected :
Final Word : When the price comes to our zone, we take action together with other confirmations.
Our expectation from the zones is to send the price back to the region it came from.
If it is not successful, we should plan a reverse transaction.
Cheerful trades...
-- Türkçe Açıklama
Bu indikatör, bir kural dahilinde ucuzluk / pahalılık bölgelerini ve fiyat boşluklarını (fvg) ekranda göstermek ve traderlara en uygun yerde işlem fırsatı sunmak üzere tasarlanmıştır.
Genel Bakış :
Bilindiği gibi fiyat hareketine salınımlarla devam eder ve hareketine devam etmek ya da tersine dönmek için bazı bölgeleri kullanır. Bu bölgelerin yaygın şekilde kullanılanları supply / demand, order block , support /resistance zone gibi farklı ekollerce adlandırılmıştır. Ve yine birçok trader market yapısı yardımla belirlediği fiyatın ucuzluk / pahalılık bölgelerine gelmesiyle işleme dahil olmayı tercih eder.
İndikatörden beklenti ve nasıl çalışır:
Beklenti; Fiyatın tepki alması muhtemel bölgeleri belirlemesidir.
Bu amaçla belirleyeceği bölgeler:
1- Ucuzluk / pahalılık bölgeleri
2- Fiyatın tekrar test etmesiyle “mitigasyon bölgeleri/mitige”
3- Fiyat boşlukları (FVG ler)
Nasıl belirler ?
1- Fiyatı uyumlu olduğu üst zaman diliminde takip eder, fiyat yeni mumda bir önceki mumu ihlal ettiğinde (high/low), önceki mumun tepe/dip - orta seviyeleri arasında kalan bölgeleri
high - middle => premium zone
low - middle => discount zone
olarak belirler ve ekranda gösterir.
2- Mitigasyon bölgesi: Fiyat ucuzluk/ pahalılık bölgeleri yeniden test ettiğinde, o bölgeler son bara uzatılarak ekranda görünür ve indikatörde ismi “mitigation zone” olarak geçer.
3- Fiyat boşlukları (FVG) : Bilinen kurallarla ve üst zaman dilimi seçeneğiyle ekranda gösterilir.
Fiyatın saygı göstermediği bölgeler ekrandan silinir.
Ayarlar:
- HTF for mitigation zones : Uyumlu üst zaman dilimi seçimi
- HTF for FVG zones : Uyumlu üst zaman dilimi seçimi
Gösterim ve renk seçenekleri.
Ekran görüntüleri ve örnek : (İngilizce kısımda)
Son söz : Fiyat bölgemize geldiğinde diğer konfirmelerle birlikte işlem alıyoruz.
Bölgelerden beklentimiz fiyatı geldiği bölgeye tekrar göndermesidir.
Eğer başarılı olamazsa tersi yönde işlem planlamalıyız.
Neşeli tradeler...

Smart Money Breakout Signals [AlgoAlpha]Introducing the Smart Money Breakout Signals, a cutting-edge trading indicator designed to identify key structural shifts and breakout opportunities in the market. This tool leverages a blend of smart money concepts like Break of Structure (BOS) and Change of Character (CHoCH) to provide traders with actionable insights into market direction and potential entry or exit points.
Key Features :
✨ Market Structure Analysis : Automatically detects and labels BOS and CHoCH for trend confirmation and reversals.
🎨 Customizable Visualization : Tailor bullish and bearish colors for breakout lines and signals to suit your preferences.
📊 Dynamic Take-Profit Targets : Displays three tiered take-profit levels based on breakout volatility.
🔔 Real-Time Alerts : Stay ahead of the game with notifications for bullish and bearish breakouts.
📋 Performance Dashboard : Monitor signal statistics, including win rates and total signals, directly on your chart.
How to Use :
Add the Indicator : Add the script to your favourites ⭐ and customize settings like market structure horizon and confirmation type.
Monitor Breakouts : Observe BOS and CHoCH labels to identify potential trend shifts. Use the breakout lines and tiered take-profit levels to plan trades effectively.
Set Alerts : Enable alerts for bullish or bearish breakouts to act on opportunities without constant monitoring.
How It Works :
The indicator identifies market structure by analyzing pivot highs and lows over a user-defined time horizon. A breakout is confirmed based on either candle closes or wicks surpassing previous pivot points. Upon detection, the script generates signals with breakout lines and calculates take-profit targets based on the distance from the breakout level. A built-in dashboard tracks performance metrics like total signals and win rates, giving traders real-time feedback on strategy effectiveness.

C|M Capital (Market Structure Pro)CM Capital (Market Structure Pro)
Overview:
The CM Capital (Market Structure Pro) Indicator is a groundbreaking tool for traders seeking a comprehensive market analysis. This closed-source script merges multiple facets of market dynamics into a single, user-friendly interface, designed to enhance decision-making by providing a multi-dimensional view of market behavior. By combining advanced market structure detection, liquidity event identification, Fair Value Gap analysis, and session-specific insights, this indicator offers traders a strategic advantage in navigating the complexities of financial markets.
Key Functionalities:
Market Structure Insights:
Break of Structure (BOS) and Market Structure Shifts (MSS):
Methodology: Our approach uses fractal analysis coupled with custom algorithms to dissect price movements, identifying pivotal moments where market structure breaks or shifts. The script evaluates candle patterns, volume data, and price momentum to flag these events.
Customization: Users can choose between candle close or wick confirmations and select from various line styles for visualization, tailoring the sensitivity to match their trading strategy, whether it's scalping or swing trading.
Utility: These markers act as early signals for trend changes, allowing traders to prepare for potential reversals or continuations, especially useful in volatile markets where timely decisions are crucial.
Structure Strength:
Highs and Lows Definition: The 'Structure Strength' setting in this indicator directly influences the identification of structure highs and lows. It's not just about detecting market structure; it's about defining what constitutes a significant high or low based on your trading horizon.
Swing vs. Internal Structure:
Lower Strength: Opting for a lower strength setting will highlight more extreme, swing-type structures. This means the indicator will mark out only the most pronounced highs and lows, which are ideal for traders focusing on broader market swings or longer-term trends.
Higher Strength: Conversely, increasing the strength level plots more internal structure levels. This setting is perfect for traders who want to dive into the market's micro-movements, offering insights into potential support and resistance within ongoing trends, essentially capturing more reactive and detailed price action.
Strategic Application: This adjustable parameter allows traders to zoom in or out on the market structure, aligning with their trading style or the specific market conditions they're navigating. Whether you're looking to catch significant market turns or to finesse entries and exits within a trend, the structure strength setting provides the granularity needed for nuanced market analysis.
Liquidity Sweeps:
Detection: Beyond traditional price action analysis, our indicator incorporates a unique method to spot liquidity sweeps. By analyzing price movements against historical support/resistance zones, it highlights instances where significant orders might have been absorbed, suggesting areas of potential price reversal or continuation.
Visualization: Liquidity sweeps are visually marked with customizable colors and an 'X' label, making them instantly recognizable. This feature is particularly beneficial for traders looking to enter or exit trades based on market inefficiencies or anticipated institutional activity.
Application: Traders can use these signals to anticipate where the market might react strongly, either as support for entries or as a caution for exits, enhancing trade precision.
Fair Value Gaps (FVGs):
Identification: Our proprietary FVG detection algorithm looks for price discrepancies over recent bars, signaling where the market could aim to rebalance. This is not merely about spotting gaps but understanding their context within the market's flow.
Enhanced Visualization: Users can extend FVGs across the chart, providing a clearer view of potential mean reversion points or continuation levels, aiding in setting targets or stop-losses.
Strategic Use: FVGs serve as dynamic levels where traders might expect price action to revisit, offering opportunities for mean reversion trades or confirming trend strength.
Session Visualization:
Session Markers: By delineating Asia, London, and New York session times, the indicator helps traders recognize session-specific volatility, trends, and liquidity conditions. Each session can be customized for color and duration, aligning with various trading strategies.
Timeframe Correlation: Integrating session analysis with structural and liquidity insights allows for a strategy where trades are timed not just by price action but by when in the global market cycle they occur, potentially increasing the effectiveness of entry and exit points.
Watermark Display:
Personalization: Add a personal touch or brand identity to your charts with customizable text and color options for the watermark, enhancing both the aesthetic and functional aspects of your trading setup.
Originality:
This script's originality lies in its holistic approach to market analysis. The integration of these diverse yet synergistic components provides a unique toolset:
Confluence of Signals: Each element enhances the others, creating a confluence where structural changes, liquidity events, and time-based market conditions are analyzed in concert, offering a more complete trading signal than isolated indicators.
Customization for Diverse Trading Styles: From high-frequency scalping to long-term trend following, the script's flexibility caters to a broad spectrum of trading strategies by allowing adjustments in sensitivity, visualization, and application.
How to Use:
Setup: Add the script to your chart and explore the settings in the input panel. Customize the visual and functional aspects to align with your trading style.
Strategy Application:
Use BOS/MSS for trend confirmation, liquidity sweeps for entry/exit precision, FVGs for mean reversion opportunities, and session markers to time your trades optimally.
Consider combining signals for stronger trade validation; for instance, a BOS during the London session might be more significant if it coincides with a liquidity sweep and an FVG from the Asian session.

Volumetric Rejection Blocks [UAlgo]The Volumetric Rejection Blocks is designed to help traders identify and visualize key price levels where volumetric rejections occur, which may indicate a shift in market sentiment. These rejections can signal potential trend reversals or areas where price action is likely to face support or resistance. By drawing rejection blocks based on volumetric strength, the indicator allows users to observe where significant buying or selling pressure has been exerted, which can be used as a reference point for future price action.
Also indicator dynamically calculates swing highs and lows, analyzes bullish and bearish strengths based on volume-weighted price movements, and displays rejection blocks on the chart. Each rejection block represents an area where the price attempted to move beyond a certain level but faced rejection, either on a close or wick basis. This can be particularly useful for traders who rely on market structure and order flow to make informed decisions about entering or exiting trades.
🔶 Key Features
Swing Length Customization: Allows users to define the swing length, helping tailor the sensitivity of the swing high and low detection to the specific market conditions.
Rejection Block Visualization: Displays up to the last 10 rejection blocks based on user settings, clearly marking areas of significant bullish or bearish rejections.
Volumetric Strength Analysis: The indicator calculates bullish and bearish strength for each rejection block, based on volume-weighted price movements over the last few bars, giving insight into the intensity of the rejection.
Violation Check Type: Offers two options for violation detection—"Close" and "Wick". This allows traders to specify whether a price level is considered broken only if it closes beyond the level or if any wick breaches it.
Bullish and Bearish Block Coloring: Rejection blocks are colored to represent bullish (green) and bearish (red) rejection areas. The color transparency can be adjusted for clear visibility overlaid on the price chart.
Market Structure Labels: Labels and lines marking "Market Structure Shift" (MSS) and "Break of Structure" (BOS) are displayed, giving traders context about significant market structure changes.
🔶 Interpreting the Indicator
Rejection Blocks: These colored blocks on the chart indicate areas where the price faced significant buying or selling pressure. A green block suggests a bullish rejection (support zone), where buyers absorbed the sell-off, potentially pushing the price upward. Conversely, a red block indicates a bearish rejection (resistance zone), where sellers overpowered buyers, potentially driving the price lower.
Strength Analysis: The width of the green and red sections within a rejection block represents the relative bullish and bearish strengths. A wider green section indicates stronger bullish support, while a wider red section suggests more robust bearish resistance. This helps traders gauge the likelihood of price holding or breaching these levels.
Market Structure Shift (MSS) and Break of Structure (BOS): The indicator automatically detects and labels significant changes in market structure. An "MSS" label indicates the first break, suggesting a potential shift in trend direction. A "BOS" label indicates a subsequent confirmation in trend direction, allowing traders to recognize potential trend continuations.
Violation Check: Traders can choose how to interpret breaks of these rejection blocks. Using the "Close" option provides a more conservative approach, requiring a close beyond the level for confirmation. The "Wick" option is more aggressive, treating any wick beyond the level as a break.
🔶 Disclaimer
Use with Caution: This indicator is provided for educational and informational purposes only and should not be considered as financial advice. Users should exercise caution and perform their own analysis before making trading decisions based on the indicator's signals.
Not Financial Advice: The information provided by this indicator does not constitute financial advice, and the creator (UAlgo) shall not be held responsible for any trading losses incurred as a result of using this indicator.
Backtesting Recommended: Traders are encouraged to backtest the indicator thoroughly on historical data before using it in live trading to assess its performance and suitability for their trading strategies.
Risk Management: Trading involves inherent risks, and users should implement proper risk management strategies, including but not limited to stop-loss orders and position sizing, to mitigate potential losses.
No Guarantees: The accuracy and reliability of the indicator's signals cannot be guaranteed, as they are based on historical price data and past performance may not be indicative of future results.

SMC Order Block & Liquidity EntryThe SMC Order Block and Liquidity Trap Entry Strategy script uses Smart Money Concepts (SMC), which analyze institutional actions in the market, to assist traders in identifying high-probability trades. In order to help traders match their entry with institutional activity, this script highlights important regions of interest, including order blocks, liquidity zones, and indications for Break of Structure (BOS) or Change of Character (CHoCH).
The fundamental ideas of this approach, which focuses on regions where institutions frequently make sizable orders or sweep liquidity, are based on SMC principles. Order blocks, which are frequently important support or resistance zones when institutions are involved, are the final bullish or bearish candle before a significant price move in the other direction. There are liquidity zones that show where retail stop-loss orders build up (above recent highs or below recent lows), such as Buy-Side Liquidity (BSL) and Sell-Side Liquidity (SSL). Before changing the direction of the price, institutions could target these zones, giving traders possible chances.
The script depicts liquidity levels above or below recent highs and lows, automatically finds order blocks within a specified lookback time, and looks for BOS (a continuation signal) or CHoCH (a reversal signal). When liquidity retests inside an order block coincide with BOS or CHoCH circumstances, entry signals are produced. While short entries are triggered when the price breaks below the order block and SSL, long entry alerts are triggered when the price breaks above the order block and BSL.

Smart Money Concepts IndicatorBEST ICT AND SMC INDICATOR
The **Smart Money Concepts Indicator** is designed to enhance trading decisions by incorporating key principles from Smart Money Concepts (SMC), focusing on the detection of market structure changes, liquidity zones, order flow, and order blocks. This indicator is particularly useful for traders looking to understand market dynamics and make informed trading decisions based on advanced market analysis.
#### Key Features:
1. **Break of Structure (BOS)**:
- Identifies upward and downward breaks in market structure, indicating potential trend reversals.
- Visual markers on the chart help traders spot these critical levels.
2. **Change of Character (CHOCH)**:
- Detects significant changes in market direction, highlighting potential shifts in momentum.
- Clearly labeled signals indicate when the market may be changing its character.
3. **Order Blocks**:
- Highlights order blocks, which are key areas where significant buying or selling has occurred.
- Provides visual cues for potential support and resistance zones.
4. **Liquidity Zones**:
- Marks liquidity zones, indicating areas where buy-side or sell-side liquidity may be targeted.
- Helps traders understand where the market might draw liquidity.
5. **Dynamic Take Profit and Stop Loss Levels**:
- Calculates and plots take profit (TP) and stop loss (SL) levels based on the Average True Range (ATR) for adaptive risk management.
- Customizable multipliers allow traders to adjust levels based on their risk tolerance.
6. **Order Flow Analysis**:
- Displays bullish and bearish order flow signals based on candle close relative to open.
- Provides insights into market sentiment and potential future price action.
#### How to Use:
- **Identifying Entry and Exit Points**: Use BOS and CHOCH signals to find potential entry points, while leveraging TP and SL levels for risk management.
- **Market Analysis**: Analyze order blocks and liquidity zones to make informed decisions on market behavior.
- **Visual Confirmation**: The clear visual cues provided by the indicator make it easier to interpret market movements and align trades with institutional behavior.
#### Conclusion:
The Smart Money Concepts Indicator is an invaluable tool for traders looking to enhance their understanding of market structure and make more informed trading decisions. By integrating advanced concepts like BOS, CHOCH, and liquidity analysis, this indicator helps traders navigate the complexities of the market with greater confidence.

ICT Panther (By Obicrypto) V1 ICT Panther Indicator: Full and Detailed Description
The ICT Panther Indicator, created by Obicrypto, is an advanced technical analysis tool designed specifically for traders looking to identify key price action events based on institutional trading techniques, particularly in the context of the Inner Circle Trader (ICT) methodology. This indicator helps traders spot market structure breaks, order blocks, and potential trade opportunities driven by institutional behaviors in the market. Here's a detailed breakdown of its features and how it works:
What Does the ICT Panther Indicator Do?
1. Market Structure Breaks (MSB) Identification:
The ICT Panther identifies critical points where the market changes direction, commonly referred to as a break of structure (BoS). When the price breaks above or below certain key levels (based on highs and lows or opens and closes), it signals a potential shift in market sentiment. These break-of-structure points are essential for traders to determine whether the market is likely to continue its trend or reverse.
2. Order Blocks Visualization:
The indicator plots demand (bullish) and supply (bearish) boxes, which represent areas where institutional traders might place significant buy or sell orders. These zones, known as order blocks, are areas where the price tends to pause or reverse, giving traders key insights into potential entry and exit points. The indicator shows these areas graphically as colored boxes on the chart, which can be used to plan trades based on market structure and price action.
3. Pivot Point Detection:
The ICT Panther identifies important pivot points by tracking higher highs and lower lows. These pivot points are critical in determining the strength of a trend and can help traders confirm the direction of the market. The indicator uses a unique algorithm to detect two levels of pivot points:
- First-Order Pivots: Major pivot points where the price makes notable highs and lows.
- Second-Order Pivots: Smaller pivot points, useful for detecting microtrends within the larger market structure.
4. Bullish and Bearish Break of Structure Lines:
When a significant market structure break (BoS) occurs, the indicator will automatically draw red lines (for bearish break of structure) and green lines (for bullish break of structure) at key price levels. These lines help traders quickly see where institutional moves have occurred in the past and where potential future price moves could originate from.
5. Tested and Filled Boxes:
The ICT Panther also has a built-in mechanism to dim previously tested order blocks. When the price tests an order block (returns to a previous demand or supply zone), the box's color dims to indicate that the area has already been tested, reducing its significance. If the price fully fills an order block, the box stops plotting, providing a clear and clutter-free chart.
Key Features
1. Market Structure Break (MSB) Trigger:
- The indicator allows users to select between highs/lows or opens/closes as the trigger for market structure breaks. This flexibility lets traders adjust the indicator to suit their personal trading style or the behavior of specific assets.
2. Order Block Detection and Visualization:
- The tool automatically plots bullish and bearish demand and supply boxes, representing institutional order blocks on the chart. These boxes provide visual cues for areas of potential price action, where institutional traders might be active.
3. Second-Order Pivot Highlighting:
- The ICT Panther offers an option to plot second-order pivots, highlighting smaller pivot points within the larger market structure. These pivots can be helpful for short-term traders who need to react to smaller price movements while still keeping the larger trend in mind.
4. Box Test and Fill Delays:
- Users can configure delays for box tests and box fills, meaning the indicator will only mark a box as tested or filled after a certain number of bars. This prevents false signals and helps confirm that a zone is truly significant in the market.
5. Customization and Visual Clarity:
- The indicator is highly customizable, allowing users to turn on or off various features like:
- Displaying second-order pivots.
- Highlighting candles that broke structure.
- Plotting market structure broke lines.
- Showing or hiding tested and filled demand boxes.
- Setting custom delays for box testing and filling to suit different market conditions.
6. Tested and Filled Order Block Visualization:
- The indicator visually adjusts the tested and filled order blocks, dimming tested zones and removing filled zones to avoid clutter on the chart. This ensures that traders can focus on active trading opportunities without distractions from historical data.
How Does It Work?
1. Detecting Market Structure Breaks (BoS):
- The indicator continuously tracks the market for key price action signals. When the price breaks through previous highs or lows (or opens and closes, depending on your selection), the indicator marks this as a break of structure. This is a critical signal used by institutional traders and retail traders alike to determine potential future price movements.
2. Order Block Identification:
- Whenever a bullish break of structure occurs, the indicator plots a green demand box to show the area where institutional buyers might have placed significant orders. Similarly, for a bearish break of structure, it plots a red supply box representing areas where institutional sellers are active.
3. Pivot Analysis and Tracking:
- As the market moves, the indicator continuously updates first-order and second-order pivot points based on highs and lows. These points help traders identify whether the market is trending or consolidating. Traders can use these pivot points in combination with the order blocks to make informed trading decisions.
4. Box Testing and Filling:
- When the price retests an existing order block, the box dims to show it has been tested. If the price fully fills the box, it is no longer shown, which helps traders focus on the most relevant, untested order blocks.
Benefits for Traders
- Improved Decision-Making: With clear visuals and advanced logic based on institutional trading strategies, this indicator provides a deeper understanding of market structure and price action.
- Reduced Clutter: The indicator intelligently manages the display of order blocks and pivot points, ensuring that traders focus only on the most relevant information.
- Adaptability: Whether you are a swing trader or a day trader, the ICT Panther can be adjusted to fit your trading style, offering robust and flexible tools for tracking market structure and order blocks.
- Institutional Edge: By identifying institutional-level order blocks and market structure breaks, traders using this indicator can trade in line with the strategies of large market participants.
Who Should Use the ICT Panther Indicator?
This indicator is ideal for:
- Crypto, Forex, and Stock Traders who want to incorporate institutional trading concepts into their strategies.
- Technical Analysts looking for precise tools to measure the market structure and price action.
- ICT Traders who follow the Inner Circle Trader methodology and want an advanced tool to automate and enhance their analysis.
- Price Action Traders seeking a reliable indicator to track pivot points, order blocks, and market structure breaks.
The ICT Panther Indicator is a powerful, versatile tool that brings institutional trading techniques to the fingertips of retail traders. Whether you are looking to identify key market structure breaks, order blocks, or crucial pivot points, this indicator offers detailed visualizations and customizable options to help you make more informed trading decisions. With its ability to track the activities of institutional traders, the ICT Panther Indicator equips traders with the insights needed to stay ahead of the market and trade with confidence.
With the ICT Panther Indicator, traders can follow the movements of institutional money, making it easier to predict market direction and capitalize on high-probability trading opportunities.
Enjoy it and share it with your friends!

SMC StructuresTitle: SMC Structures Indicator
Description:
The SMC Structures indicator is a powerful tool designed to identify and visualize key structural elements in price action, based on the principles of Smart Money Concepts (SMC). This indicator helps traders identify potential areas of support, resistance, and price reversals by highlighting significant market structures.
Key Features:
Structure Identification: The indicator automatically detects and marks important high and low structures in the market.
Break of Structure (BOS) Detection: It identifies and labels instances where previous structures are broken, indicating potential trend changes or continuations.
Change of Character (CHoCH) Detection: The indicator recognizes and marks Changes of Character, which are significant shifts in market behavior.
Customizable Visuals: Users can personalize the appearance of BOS and CHoCH markings, including colors, line styles, and widths.
Current Structure Display: The indicator can optionally show the current active structure, helping traders understand the immediate market context.
Historical Structure Tracking: Users can specify the number of historical structure breaks to display, allowing for a cleaner chart while maintaining relevant information.
Flexible Break Confirmation: The indicator offers the option to confirm structure breaks using either the candle body or wick, accommodating different trading styles.
Technical Details:
The indicator uses advanced algorithms to identify significant price structures based on local highs and lows.
It employs a lookback period of 10 bars for structure detection, ensuring relevance to current market conditions.
The code includes safeguards to handle different market phases and avoid false signals during ranging periods.
Customization Options:
Colors for Bullish and Bearish BOS and CHoCH markings
Line styles and widths for all structure markings
Number of historical breaks to display
Option to show or hide the current active structure
Choice between candle body or wick for structure break confirmation
Use Cases:
Trend Analysis: Identify the start of new trends or potential trend reversals.
Support and Resistance: Pinpoint key levels where price may react.
Trade Entry and Exit: Use structure breaks as potential entry or exit signals.
Market Context: Understand the broader market structure to make informed trading decisions.
This indicator is particularly useful for traders who follow Smart Money Concepts and those looking to enhance their understanding of market structure. It provides a visual representation of complex market dynamics, helping traders make more informed decisions based on structural analysis.
Note: This indicator is best used in conjunction with other analytical tools and a solid understanding of market dynamics. Always practice proper risk management when using any trading indicator.
Would you like me to explain or break down any part of the code?

LIT_Globas_sys - Liquidity Inducement Theorem (SMC, IDM)LIT_GLOBAL_SYS Trading Tool Documentation, is a comprehensive market analysis tool that includes all components needed for trading according to Liquidity Inducement Theorem (LIT). LIT differs from classical trading methods and is considered a highly effective and profitable strategy.
What can LIT_GLOBAL_SYS do?
--- Market Structure
The main feature of Liquidity Inducement Theorem is building the correct structure, specifically construction taking into account inducement (IDM). Thus, a new HH or LL can only form when the price has taken the first correct pullback - inducement (IDM), and after this, we understand the location of BoS (break of structure) and CHoCH (change of character).
LIT_GLOBAL_SYS automatically and perfectly displays the correct structure following all LIT rules. Looking at the indicator, a trader always understands which range the price is currently in and where it's trending at the moment. The indicator also shows dynamic (live) levels, providing a clear understanding of the market structure in real-time.
The indicator settings allow customization of each structural element according to trader preferences. For example, you can change the style, color, and shape of structural objects.
--- Correct Pullbacks and Inside Bars
In Liquidity Inducement Theorem, correct pullbacks are fundamental. The structure, order blocks, liquidity levels, order flow, and single candle order blocks (CSOB) are all built based on pullbacks.
What is a pullback?
- When the next candle updates the low of the previous candle, we can finish drawing an upward pullback
- We can start drawing a downward correct pullback when the next candle updates the low of the previous candle
- The downward movement will continue until the opposite occurs - updating the high of the previous candle
There are complexities in determining pullbacks - these are inside bars. In Liquidity Inducement Theorem, inside bars are completely ignored!
For example, in an upward movement, at some point, candles may stop updating the high and low of the previous candle and remain within the boundaries of the previous candle. Theoretically, there could be any number of such candles from 1 to infinity. In such cases, it's important to wait for the price to exit the mother candle (the candle after which other candles remained within its high and low range).
LIT_GLOBAL_SYS easily handles this and displays both pullbacks and inside bars correctly.
--- Order Blocks and Fair Value Gaps (FVG)
In Liquidity Inducement Theorem, order blocks are defined differently from classical order blocks:
1. The order block must take liquidity from the previous candle
2. The order block must have Fair Value Gaps (FVG) before it
3. Inside bars are completely ignored for both Order Blocks and FVG
4. If an OB fulfills the first condition (taking liquidity from the previous candle) but doesn't have FVG before it, this block is moved forward along the candles until there is an imbalance before it
There are two most important order blocks in LIT strategy:
1. Inducement order block (idm ob) - the first order block after Inducement
2. Extreme order block (Ext ob) - the first order block before CHoCH
LIT_GLOBAL_SYS perfectly displays correct order blocks and Fair Value Gaps following all rules. It offers full customization options:
- Specify the number of displayed OBs
- Disable all order blocks except idm ob and Ext ob
- Change block frame color and style
- Disable or modify text display in blocks
--- Single Candle Order Block (Scob)
Rules for building Scob:
1. The candle takes liquidity from the previous candle and closes within the body of the previous candle
2. The candle following the Scob candle must close its body below the previous candle
3. Scob forms in continuation of the trend movement
4. Scob completely ignores inside bars
LIT_GLOBAL_SYS accurately displays Scob as triangles and fully ignores inside bars both left and right. The menu allows complete customization of display and quantity of displayed Scobs.
--- Liquidity Lines, Order Flow, and Three-Minute Rule
Auxiliary functions include:
- Liquidity Lines -
Each pullback is marked with a line, showing where unclosed liquidity exists. Completed lines can be hidden to help predict price movement and enter trades correctly.
- Order Flow -
The indicator implements order flow by drawing a line when a pullback is broken (closed by body) in the opposite direction until the second touch. If price moves away without a second touch, the line remains, showing unclosed OF and potential price return zones.
- Three-Minute Rule -
Some LIT traders use the three-minute rule: price manipulations in the last and first three minutes of each 15-minute candle are additional entry factors, especially in the last quarter of an hourly candle. LIT_GLOBAL_SYS displays this rule only on the one-minute timeframe with symbols below for M15 and H1.
--- Trading Sessions, PDH/PDL, and EMA
The system includes:
- Trading sessions (Tokyo, Frankfurt, London, New York) with customizable time settings
- Previous Day High and Previous Day Low (pdh/pdl) levels
- Exponential Moving Average (EMA) with adjustable length
- Equilibrium display between current BoS and CHoCH levels
--- Alert System
LIT_GLOBAL_SYS includes all necessary alerts for Liquidity Inducement Theorem:
1. SCOB
2. EMA
3. BoS, ChoCh, Sweep
4. IDM
5. IDM OB and Ext OB
Users can simply check the desired alerts in the menu and activate them to receive notifications when price reaches specified zones.

Price Action Volumetric Breaker Blocks [UAlgo]The Price Action Volumetric Breaker Blocks indicator is designed to identify and visualize significant price levels in the market. It combines concepts of price action, volume analysis, and market structure to provide traders with a comprehensive view of potential support and resistance areas. This indicator identifies "breaker blocks," which are price zones where the market has shown significant interest in the past.
These blocks are created based on swing highs and lows, and are further analyzed using volume data to determine their strength. The indicator also tracks market structure shifts, providing additional context to price movements.
By visualizing these key levels and market structure changes, traders can gain insights into potential areas of price reversal or continuation, helping them make more informed trading decisions.
🔶 Key Features
Dynamic Breaker Block Identification: The indicator automatically detects and draws breaker blocks based on swing highs and lows. These blocks represent areas of potential support and resistance.
Volume-Weighted Strength Analysis: Each breaker block is analyzed using volume data to determine its bullish and bearish strength. This is visually represented by the proportion of green (bullish) and red (bearish) coloring within each block.
Market Structure Break (MSB) and Break of Structure (BOS): The indicator identifies and labels Market Structure Breaks (MSB) and Break of Structure (BOS) events, providing context to larger market trends.
Customizable Settings:
- Adjustable swing length for identifying pivot points
- Option to show a specific number of recent breaker blocks
- Choice between wick or close price for violation checks
- Toggle to hide overlapping blocks for cleaner analysis
Violation Detection: Automatically detects when a breaker block has been violated (broken through), either by wick or close price, depending on user settings.
Overlap Control: Provides an option to hide overlapping order blocks, ensuring that the chart remains clean and easy to read when multiple blocks are detected in close proximity.
🔶 Interpreting Indicator
Breaker Blocks:
Breaker blocks are key areas where the price moves through and invalidates a previously identified order block. The indicator detects a breaker block when the price violates an order block by exceeding its high or low (depending on whether it's a bullish or bearish block). This violation is determined by either the wick or the close of a candle, depending on the user's selection in the "Violation Check" setting. When a breaker block is detected, the indicator removes the violated order block from the chart, signaling that the zone is no longer relevant for future price action.
Bullish Breaker Block: This occurs when a bearish order block (red) is violated by the price closing above the block’s top boundary or when the wick surpasses this level. It signals that a prior bearish structure has been invalidated, and the market may shift to a bullish trend.
Bearish Breaker Block: This occurs when a bullish order block (teal) is violated by the price closing below the block’s bottom boundary or when the wick drops below it. It suggests that a previous bullish structure has been broken, indicating potential bearish momentum.
Market Structure Labels:
"MSB" (Market Structure Break) labels indicate a potential change in trend direction.
"BOS" (Break of Structure) labels confirm the continuation of the current trend after breaking a significant level.
Block Strength:
A block with more green indicates stronger bullish interest.
A block with more red indicates stronger bearish interest.
The relative sizes of the green and red portions show the balance of power between buyers and sellers at that level.
🔶 Disclaimer
Use with Caution: This indicator is provided for educational and informational purposes only and should not be considered as financial advice. Users should exercise caution and perform their own analysis before making trading decisions based on the indicator's signals.
Not Financial Advice: The information provided by this indicator does not constitute financial advice, and the creator (UAlgo) shall not be held responsible for any trading losses incurred as a result of using this indicator.
Backtesting Recommended: Traders are encouraged to backtest the indicator thoroughly on historical data before using it in live trading to assess its performance and suitability for their trading strategies.
Risk Management: Trading involves inherent risks, and users should implement proper risk management strategies, including but not limited to stop-loss orders and position sizing, to mitigate potential losses.
No Guarantees: The accuracy and reliability of the indicator's signals cannot be guaranteed, as they are based on historical price data and past performance may not be indicative of future results.

Pure Price Action ICT Tools [LuxAlgo]The Pure Price Action ICT Tools indicator is designed for pure price action analysis, automatically identifying real-time market structures, liquidity levels, order & breaker blocks, and liquidity voids.
Its unique feature lies in its exclusive reliance on price patterns, without being constrained by any user-defined inputs, ensuring a robust and objective analysis of market dynamics.
🔶 MARKET STRUCTURES
A Market Structure Shift, also known as a Change of Character (CHoCH), is a pivotal event in price action analysis indicating a potential change in market sentiment or direction. An MSS occurs when the price reverses from an established trend, signaling that the prevailing trend may be losing momentum and a reversal might be underway. This shift is often identified by key technical patterns, such as a higher low in a downtrend or a lower high in an uptrend, which indicate a weakening of the current trend's strength.
A Break of Structure typically indicates the continuation of the current market trend. This event occurs when the price decisively moves beyond a previous swing high or low, confirming the strength of the prevailing trend. In an uptrend, a BOS is marked by the price breaking above a previous high, while in a downtrend, it is identified by the price breaking below a previous low.
While a Market Structure Shift (MSS) can indicate a potential trend reversal and a Break of Structure (BOS) often confirms trend continuation, they do not assure a complete reversal or continuation. MSS and BOS levels can also function as liquidity zones or areas of price consolidation rather than definitively signaling a change in market direction. Traders should approach these signals cautiously and validate them with additional factors before making trading decisions. For further details on other components of the tool, please refer to the following sections.
🔶 ORDER & BREAKER BLOCKS
Order and Breaker Blocks are key concepts in price action analysis that help traders identify significant levels in the market structure.
Order Blocks are specific price zones where significant buying or selling activity has occurred. These zones often represent the actions of large institutional traders or market makers, who execute substantial orders that impact the market.
Breaker Blocks are specific price zones where a strong reversal occurs, causing a break in the prevailing market structure. These blocks indicate areas where the price encountered significant resistance or support, leading to a reversal.
In summary, Order and Breaker Blocks are essential tools in price action analysis, providing insights into significant market levels influenced by institutional trading activities. These blocks help traders make informed decisions about potential support and resistance levels, trend reversals, and breakout confirmations.
🔶 BUYSIDE & SELLSIDE LIQUIDITY
Both buy-side and sell-side liquidity zones are critical for identifying potential turning points in the market. These zones are where significant buying or selling interest is concentrated, influencing future price movements.
In summary, buy-side and sell-side liquidity provide crucial insights into market demand and supply dynamics, helping traders make informed decisions based on the availability of orders at different price levels.
🔶 LIQUIDITY VOIDS
Liquidity voids are gaps or areas on a price chart where there is a lack of trading activity. These voids represent zones with minimal to no buy or sell orders, often resulting in sharp price movements when the market enters these areas.
In summary, liquidity voids are crucial areas on a price chart characterized by a lack of trading activity. These voids can lead to rapid price movements and increased volatility, making them essential considerations for traders in their analysis and decision-making processes.
🔶 SWING POINTS
Reversal price points are commonly referred to as swing points. Traders often analyze historical swing points to discern market trends and pinpoint potential trade entry and exit points.
Do note that in this script these are subject to backpainting, that is they are not located where they are detected.
The detection of swing points and the unique feature of this script rely exclusively on price action, eliminating the need for numerical user-defined settings. The process begins with detecting short-term swing points:
Short-Term Swing High (STH): Identified as a price peak surrounded by lower highs on both sides.
Short-Term Swing Low (STL): Recognized as a price trough surrounded by higher lows on both sides.
Intermediate-term and long-term swing points are detected using the same approach but with a slight modification. Instead of directly analyzing price candles, previously detected short-term swing points are utilized. For intermediate-term swing points, short-term swing points are analyzed, while for long-term swing points, intermediate-term ones are used.
This method ensures a robust and objective analysis of market dynamics, offering traders reliable insights into market structures. Detected swing points serve as the foundation for identifying market structures, buy-side/sell-side liquidity levels, and order and breaker blocks presented with this tool.
In summary, swing points are essential elements in technical analysis, helping traders identify trends, support, and resistance levels, and optimal entry and exit points. Understanding swing points allows traders to make informed decisions based on the natural price movements in the market.
🔶 SETTINGS
🔹 Market Structures
Market Structures: Toggles the visibility of the market structures, both shifts and breaks.
Detection: An option that allows users to detect market structures based on the significance of swing levels, including short-term, intermediate-term, and long-term.
Market Structure Labels: Controls the visibility of labels that highlight the type of market structure.
Line Style: Customizes the style of the lines representing the market structure.
🔹 Order & Breaker Blocks
Order & Breaker Blocks: Toggles the visibility of the order & breaker blocks.
Detection: An option that allows users to detect order & breaker blocks based on the significance of swing levels, including short-term, intermediate-term, and long-term.
Last Bullish Blocks: Number of the most recent bullish order/breaker blocks to display on the chart.
Last Bearish Blocks: Number of the most recent bearish order/breaker blocks to display on the chart.
Use Candle Body: Allows users to use candle bodies as order block areas instead of the full candle range.
🔹 Buyside & Sellside Liquidity
Buyside & Sellside Liquidity: Toggles the visibility of the buyside & sellside liquidity levels.
Detection: An option that allows users to detect buy-side & sell-side liquidity based on the significance of swing levels, including short-term, intermediate-term, and long-term.
Margin: Sets margin/sensitivity for a liquidity level detection.
Visible Levels: Controls the amount of the liquidity levels/zones to be visualized.
🔹 Liquidity Voids
Liquidity Voids: Enable display of both bullish and bearish liquidity voids.
Threshold Multiplier: Defines the multiplier for the threshold, which is hard-coded to the 200-period ATR range.
Mode: Controls the lookback length for detection and visualization. Present considers the last X bars specified in the option, while Historical includes all available data.
Label: Enable display of a label indicating liquidity voids.
🔹 Swing Highs/Lows
Swing Highs/Lows: Toggles the visibility of the swing levels.
Detection: An option that allows users to detect swing levels based on the significance of swing levels, including short-term, intermediate-term, and long-term.
Label Size: Control the size of swing level labels.
🔶 RELATED SCRIPTS
Pure-Price-Action-Structures.
Market-Structures-(Intrabar).
Buyside-Sellside-Liquidity.
Order-Breaker-Blocks.

Market Core [BigBeluga]MARKET CORE Toolkit
The BigBeluga Market Core Toolkit is a comprehensive suite of advanced trading indicators designed to provide traders with a holistic view of market dynamics, structure, and potential opportunities.
In an ever-evolving market, relying on a single indicator can leave traders vulnerable to gaps in their analysis. The BigBeluga Market Core Toolkit addresses this challenge by integrating a range of complementary indicators that work synergistically to reveal the full picture. From detecting key support and resistance levels to identifying market structure shifts, volume imbalances, inefficiencies or analysis of money flow, this toolkit covers every aspect of market behavior.
⬤ Order Blocks
BigBeluga Order Blocks revolutionize the way traders visualize potential areas of significant market activity. Unlike traditional order block indicators that often result in cluttered, noisy charts, these Order Blocks are designed for clarity and effectiveness. They simulate and predict where large areas of market orders may rest by analyzing volume and volatility, providing excellent support or resistance areas.
The blocks offer cleaner chart presentation with reasonable distribution, volume ratio visualization within each block, and categorization into Strong, High and Balanced blocks.
Additionally, a third line has been introduced to rank order blocks by volume using a modified percent rank method for more precise ranking.
This ranking system uses percentile ranks, a concept commonly used in standardized tests. In the context of order blocks, the percentile rank of a particular order block's volume is interpreted as the percentage of the order blocks strength. This method provides a more nuanced and statistically robust way of comparing and prioritizing order blocks.
Key features:
Cleaner chart presentation with reasonable distribution of blocks
Volume ratio visualization within each block (bullish vs bearish)
Categorization into High and Balanced blocks for easy identification of significant levels
Relative volume percentage and volume delta display
Advanced ranking system using modified percent rank method for volume comparison
These Order Blocks help traders:
Forecast excellent support or resistance areas
Gain insight into the balance of the market at specific levels
Identify significant market levels at a glance
Visualize market imbalances through volume delta
Prioritize order blocks based on their relative volume importance
Make more informed decisions about potential entry and exit points
⬤ Beluga Profile
The Beluga Profile is a revolutionary market analysis tool that transforms complex market data into a clear, intuitive visual narrative. At its core, it combines a Dual-Profile Analysis, merging Delta Volume Profile with Money Flow Profile to give traders a comprehensive view of market dynamics.
The percentage scale on the left side aren't just numbers; they represent the Levels Strength Percentage, a crucial ranking system that immediately draws your attention to the most significant price zones. Complementing this, a heat map overlay brings these strength levels to life, offering an instant, color-coded representation of where the market's most influential areas lie.
To the right, a detailed breakdown of volume and money flow for each level provides the hard data behind the visual cues. This granular information allows you to dive deep into the market's structure, understanding not just where the significant levels are, but why they matter.
Below the main chart, the Delta Volume Bar serves as a foundation, showing the average delta of the volume profile. This bar is more than just a measure of volume – it's a window into the underlying forces driving price movement. Just above this bar, a macro trend indicator in the form of an arrow offers a quick, clear signal of the overall market direction based on these delta volume calculations.
But the Beluga Profile doesn't just show you what's happening – it helps you understand the 'why' and 'how'. The Adaptive Points of Interest feature allows you to customize your analysis, focusing on the areas that matter most to your trading strategy. You can select from various options including Money Flow, Delta+, Delta-, Volume+, and Level % (Highest), tailoring the display to your specific analytical needs. This flexibility ensures you can focus on the most relevant data for your trading style. Real-time Active Price Tracking ensures you're always in sync with the latest market movements.
All of these elements work in concert, creating a symphony of market information. They empower you to:
Spot key price levels with uncanny precision
Foresee potential market turns before they happen
Grasp the quality and strength of price moves
Adjust your strategy on the fly as market conditions shift
Develop a holistic understanding of market structure and participant behavior
Make informed decisions backed by a clear view of the overall market trend
In essence, the Beluga Profile isn't just a tool – it's your market storyteller, translating the complex language of price, volume, and money flow into a narrative that you can understand and act upon with confidence.
⬤ Smart Money Concepts (SMC)
The Smart Money Concepts component of the toolkit focuses on automatically detecting key market structures crucial in technical analysis. It identifies and visualizes Break of Structure (BOS) and Change of Character (CHOCH) patterns, helping traders spot potential trend reversals and significant market movements. This includes BOS identification when price breaks previous support or resistance and CHOCH detection for potential trend reversals, with automatic detection of both bullish and bearish patterns.
The latest enhancement to this feature adds a new layer of analysis through Delta Volume Calculation. When a BOS or CHOCH is detected, the toolkit calculates the delta volume within the range from the high or low point to the break point. This analysis considers all the candles in this range and determines whether the volume is predominantly bullish, bearish, or neutral.
Bullish Volume: If the delta volume is bullish, a green diamond is plotted at the high or low point, indicating potential upward momentum.
Bearish Volume: If the delta volume is bearish, a red diamond is plotted, suggesting downward pressure.
Neutral Volume: When the volume is neutral, a yellow diamond is displayed, indicating a balance in buying and selling forces.
This visual representation of volume dynamics provides an additional layer of insight, helping traders assess the strength and direction of price movements following a structure break. You can see an example of this on the attached image, where the diamonds clearly indicate the type of volume driving the breakout.
The toolkit also incorporates Fair Value Gap (FVG) Detection. Fair Value Gaps represent inefficiencies in the market, where there is an imbalance between buy and sell orders. These gaps often act as magnets for price, potentially leading to future reversals or continuations when filled. The toolkit identifies and highlights these gaps, allowing traders to recognize areas where the market may seek to rebalance.
Additionally, Double Top and Bottom Pattern Detection has been integrated, identifying potential reversal points at these classic price formations. Double tops signal potential bearish reversals after a price peak, while double bottoms suggest potential bullish reversals after a price dip. These patterns can be crucial indicators for traders looking to capitalize on upcoming trend changes.
Smart Money Concepts help traders:
Identify potential trend reversals early with a clearer view of market structure.
Recognize significant changes in market structure and volume participation.
Differentiate between temporary pullbacks and genuine trend changes using volume insights (color coded diamonds).
Shows Fair Value gaps which helps to identify price momentum and inefficiencies in the market.
This enhancement ensures that traders can not only see structural changes but also understand the volume behind those moves, leading to more informed and confident trading decisions.
⬤ Support and Resistance Levels
This powerful tool is designed to identify key price levels in the market, providing traders with a clear visual representation of potential support and resistance areas. It goes beyond simple level identification by incorporating a sophisticated ranking system and adjustable sensitivity.
The grading system of levels is a unique feature that evaluates the significance of high and low points in the price action. It takes into consideration how many times the price has touched or interacted with specific levels. This means that levels which have been tested multiple times are given higher importance in the ranking. For example, a price level that has acted as support or resistance three times will be ranked higher than a level that has only been touched once.
By leveraging this grading system, traders can focus on the most significant levels that have repeatedly influenced price action, potentially improving the accuracy of their trading decisions and risk management strategies.
This Support and Resistance Levels indicator helps traders:
Identify and prioritize potential reversal points based on their historical significance and frequency of price interaction
Set more accurate entry and exit points aligned with key market levels, focusing on those with higher ranking
Understand the hierarchical structure of market support and resistance, distinguishing between major and minor levels
Plan stop-loss and take-profit levels with greater precision, using the ranking to gauge the strength of each level
Adapt their analysis to varying market strengths and volatilities, with the ability to filter out less significant levels
Recognize recurring price patterns and potential breakout levels based on the ranked historical price interactions
⬤ How to Use the Toolkit
Each of these indicators, while powerful on its own, works synergistically with the others to provide a more complete picture of the market.
The strength of this toolkit lies in its ability to analyze the market from multiple perspectives
Combining these advanced trading indicators into a cohesive toolkit empowers traders with a comprehensive, multi-dimensional view of the market that no single indicator could provide on its own. The market's complexity demands an approach that goes beyond relying on just one aspect, such as price action, volume, or order flow. Integrating these diverse indicators creates a robust analytical framework that captures the market from multiple angles, leading to more accurate insights and better-informed decision-making.
Analyze Order Blocks to identify potential support/resistance and volume imbalances
Use Beluga Profile for comprehensive market structure and trend analysis
Monitor SMC indicators for potential trend reversals and breakouts
Utilize Support and Resistance Levels for precise entry/exit points and risk management
Combine insights from all tools for a multi-dimensional view of market conditions
⬤ Customization
Each component of the toolkit offers various customization options to suit different trading styles and preferences. These inputs allow traders to adjust settings to better fit their analysis needs and strategies:
Order Blocks
- Order Blocks : Set the amount of Order Blocks on the chart.
- Color Selection : Choose the color for highlighting the order blocks on your chart.
Market Structure
- Sensitivity : Adjust the sensitivity for detecting market structure breaks. Higher sensitivity will detect more granular breaks, while lower sensitivity focuses on more significant movements.
- Data : Enable or disable the display of market structure data.
- Zigzag Option : Toggle Zigzag displays from highs and lows.
S/R (Support and Resistance)
- Sensitivity : Control how sensitive the tool is in detecting support and resistance levels. Lower sensitivity will highlight fewer but stronger levels, while higher sensitivity may reveal more levels.
- Width % : Adjust the width of the support and resistance zones to visually emphasize their importance.
- Color Selection : Choose colors for both support and resistance levels for better clarity.
FVG (Fair Value Gap)
- Max : Set the maximum number of fair value gaps to display. Higher values will show more gaps, while lower values will focus on the most prominent ones.
- Color Selection : Customize the color for the fair value gap areas.
Volume Profile
- Length : Define the look-back period for the volume profile analysis. A longer length considers more historical data, while a shorter length focuses on recent data.
- Levs : Choose the number of volume levels to display, allowing for more or fewer volume bars within the profile.
- BG : Enable or disable background shading for the volume profile.
- HeatMap : Activate or deactivate the heat map overlay for volume intensity visualization.
- POC (Point of Control) : Toggle the Point of Control display and choose between different metrics, such as volume+, money flow, Delta+ and Delta-, Level % (Highesr), to base the POC on.
- Color Selection : Customize the color for the Point of Control line.
These customization options provide traders with the flexibility to tailor the toolkit to their specific trading strategies, enhancing their ability to identify key market signals with precision.
Each component of the toolkit offers various customization options to suit different trading styles and preferences.
The BigBeluga Market Core Toolkit synthesizes complex market data into clear, actionable formats, providing traders with professional-level insights. It's a comprehensive market analysis system that can give traders a significant edge in understanding market behavior and identifying high-probability trade setups. While highly effective, it's recommended to use this toolkit in conjunction with fundamental analysis and sound risk management practices for optimal trading results.
Paid script

Pure Price Action Structures [LuxAlgo]The Pure Price Action Structures indicator is a pure price action analysis tool designed to automatically identify real-time market structures.
The indicator identifies short-term, intermediate-term, and long-term swing highs and lows, forming the foundation for real-time detection of shifts and breaks in market structure.
Its distinctive/unique feature lies in its reliance solely on price patterns, without being limited by any user-defined input, ensuring a robust and objective analysis of market dynamics.
🔶 USAGE
Market structure is a crucial aspect of understanding price action. The script automatically identifies real-time market structure, enabling traders to comprehend market trends more easily. It assists traders in recognizing both trend changes and continuations.
Market structures are constructed from three sets of swing points, short-term swings, intermediary swings, and long-term swings. Market structures associated with longer-term swing points are indicative of longer-term trends.
A market structure shift (MSS), also known as a change of character (CHoCH), is a significant event in price action analysis that may signal a potential shift in market sentiment or direction. Conversely, a break of structure (BOS) is another significant event in price action analysis that typically indicates a continuation of the prevailing trend.
However, it's important to note that while an MSS can be the first indication of a trend reversal and a BOS signifies a continuation of the prevailing trend, they do not guarantee a complete reversal or continuation of the trend.
In some cases, MSS and BOS levels may also act as liquidity zones or areas of price consolidation, rather than indicating a definitive change in market direction or continuation. Traders should approach them with caution and consider additional factors to confirm the validity of the signal before making trading decisions.
🔶 DETAILS
🔹 Market Structures
Market structures are based on the analysis of price action and aim to identify key levels and patterns in the market, where swing point detection is one of the core concepts within ICT trading methodologies and teachings.
Swing points are automatically detected solely based on market movements, without any reliance on user-defined input.
🔹 Utilizing Swing Points
Swing points are not identified in real time as they occur. While short-term swing points may be displayed with a delay of at most one bar, the identification of intermediate and long-term swing points depends entirely on market movements. Furthermore, detection is not limited by any user-defined input but relies solely on pure price action. Consequently, swing points are not typically utilized in real-time trading scenarios.
Traders often analyze historical swing points to discern market trends and pinpoint potential entry and exit points for their trades. By identifying swing highs and lows, traders can:
Recognize Trends: Swing highs and lows help traders identify the direction of the trend. Higher swing highs and higher swing lows indicate an uptrend, while lower swing highs and lower swing lows indicate a downtrend.
Identify Support and Resistance Levels: Swing highs often serve as resistance levels, known in ICT terminology as Buyside Liquidity Levels, while swing lows function as support levels, also referred to in ICT terminology as Sellside Liquidity Levels. Traders can utilize these levels to strategize entry and exit points for their trades.
Spot Reversal Patterns: Swing points can form various reversal patterns, such as double tops or bottoms, head and shoulders patterns, and triangles. Recognizing these patterns can signal potential trend reversals, allowing traders to adjust their strategies accordingly.
Set Stop Loss and Take Profit Levels: In the context of ICT teachings, swing levels represent specific price levels where a concentration of buy or sell orders is anticipated. Traders can target these liquidity levels/pools to accumulate or distribute their positions, essentially using swing points to establish stop loss and take profit levels for their trades.
Overall, swing points provide valuable information about market dynamics and can assist traders in making more informed trading decisions.
🔶 SETTINGS
🔹 Structures
Swings and Size: Toggles the visibility of the structure's highs and lows, assigns an icon corresponding to the structures, and controls the size of the icons.
Market Structures: Toggles the visibility of the market structures.
Market Structure Labels: Controls the visibility of labels that highlight the type of market structure.
Line Style and Width: Customizes the style and width of the lines representing the market structure.
Swing and Line Colors: Customizes colors for the icons representing highs and lows, and the lines and labels representing the market structure.
🔶 RELATED SCRIPTS
Market-Structures-(Intrabar).
Buyside-Sellside-Liquidity.

Time - Bar StatusCandlestick analysis
The Indicator "Bar Status" will display the current open candle state and the last three close candles state based on the logic below.
Abbreviations.
OC = Open Candle (if in no state listed below)
FB = False Break
BO = Break Out
IN = Inside Bar
FBR = False Break Reversal
Logic:
OC = This is the current open candle yet to close. Its status will change as it progresses through time until close.
Green False Break Revers (FBR) = bar Close is higher than previous bar Close AND bar High is higher than previous bar High AND bar Low is lower than previous bar Low.
Green False Break (FB) = bar Close is lower than previous bar High AND bar High is higher than previous bar High.
Green Breakout (BO) = bar Close is higher than previous bar Close AND bar High is higher than previous bar High.
Green Inside Bar (IN) = bar High is lower than previous bar High AND bar Low is higher than previous bar Low.
Red False Break Revers (FBR) = bar Close is lower than previous bar Close AND bar Low is lower than previous bar Low AND bar High is Higher than previous bar High.
Red False Break (FB) = bar Close is higher than previous bar Low AND bar Low is lower than previous bar Low.
Red Breakout (BO) = bar Close is lower than previous bar Close AND bar Low is lower than previous bar Low.
Red Inside Bar (IN) = bar High is lower than previous bar High AND bar Low is higher than previous bar Low.
The end column is the current open candle/bar.
The second from the end column is the last closed candle/bar.
The third from the end column is the second closed candle/bar.
The forth from the end column is the third closed candle/bar.
=============================================================
Also Includes candle countdown timer, of various candles. i.e. 4 hour, 1 hour, 15min, 5 min.

Smart Money Setup 01 [TradingFinder]Double Order Blocks Proof🔵 Introduction
The Price Action, styled as the "Smart Money Concept" or "SMC," was introduced by Mr. David J. Crouch in 2000 and is one of the most modern technical styles in the financial world. In financial markets, Smart Money refers to capital controlled by major market players (central banks, funds, etc.), and these traders can accurately predict market trends and achieve the highest profits.
In the "Smart Money" style, various types of "order blocks" can be traded. This indicator uses a type of "order block" originating from "BoS" (Breakout of Structure). The most important feature of this indicator is the confirmation of two order blocks.
🟣 Important
For example, after the first "BoS" and the formation of the first Order Block, if a second "BoS" occurs before touching the price of the first Order Block and the formation of the second Order Block, a trading setup with 2 order blocks is formed, which confirms the dominant market trend.
For a better understanding of this subject, see the explanations in the following two images.
Bullish Setup Details :
Bearish Setup Details :
🔵 How to Use
After adding the indicator to the chart, you should wait for the formation of the trading setup. You can observe different trading positions by changing the "Time Frame" and "Pivot Period." Generally, the higher the "Time Frame" and "Pivot Period," the more valid the formed setup is.
Bullish Setup Details on Chart :
Bearish Setup Details on Chart :
You can access the "Pivot Period" input through the settings.

ziksfx Structure - LiteInspired by the 'mentfx Structure' indicator created by Anton (mentfx) on TradingView, I have developed my own unique version of the market structure indicator, enhancing it with features that resonate with my personal trading style and offer additional insights into market behaviour.
In the spirit of Anton's original concept, my indicator incorporates the fundamental idea of "sells before buys" for bullish ranges and "buys before sells" for bearish ranges. This methodological approach is designed to mirror the activities of large market participants who typically offload positions before accumulating again in a bullish context, and accumulate before offloading in a bearish context.
The "ranges" displayed on the chart represent historical and updated highs and lows, reflecting the structural delivery of price across any timeframe. This approach assumes that in a bullish range, the market is likely to sustain upward momentum until it reaches a new high or experiences a significant "sell before buy" scenario, and conversely in a bearish range.
Key Enhancements and Features:
Immediate Break of Structure (BOS) Recognition: This feature promptly updates the high/low to the candle that triggers a BOS, providing a more agile response compared to the original mentfx Structure's approach of waiting for a swing high/low to set the range. This adaptation allows me for quicker adaptation to the market's unfolding narrative.
Market Stage Visualization: By seamlessly integrating with the structure tracking, my indicator presents the current 'Market Stage,' offering a clear stage of the current market's phase, which is crucial for informed trading decisions. The core methodology for determining market stages is derived from the foundational concepts established by mentfx.
Moving Average Integration: The inclusion of a Moving Average (MA) within the indicator adds a layer of trend confirmation, reinforcing decisions based on market structure with established trend analysis techniques. You can use EMA or SMA.
Customizable Session Settings: Tailor the indicator to focus on specific market hours, enhancing its utility for session-based trading strategies and backtesting efficiency.
Triple M: The Triple-M feature is also included in this indicator, which provides a visual representation of the market's momentum and potential reverse.
ATR: Utilizes the Average True Range (ATR) to estimate stop loss levels, providing a data-driven method to manage risk in accordance with current market volatility.
Watermark: Displays the name of the ticker and the current timeframe directly on the chart for easy reference, ensuring clarity and orientation when analyzing multiple instruments or timeframes.
How It Works:
When a range is assigned as being bullish, it will continue updating the high until a new high is created after the bos (= the new high of the range) and will not update or change until a candle's body, open's or close's above it - which will re-update the high and update the low. The low will be updated based on the last time price had a candle (open or closure) below a previous candle low, and then will find the lowest low after the rule was met to assign a low (the idea here is to locate the last major "sell before buy" and showcase that range. And this will occur vice versa, where: when a range is assigned as bearish, it will continue updating the low until a true low is created (=low of the range) and will not update or change until a candle's body, open's or close's below it - which will reupdate the low and update the high. The high will be updated based on the last time price had a candle (open or closure) above a previous candle high, and then will find the highest high after the rule was met to assign a high (once again, the idea being to locate the last major "buy before sell" and showcase price as existing in that range.)
A high is considered as a high that has a lower high to its left and to its right. And a low is considered as a low that has a higher low to its left and to its right. These high and low are used to determine the final high or low of a Bullish or Bearish range (respectively).
Range Determination: The indicator assesses the market momentum and assigns a Bullish or Bearish state based on the most recent directional break.
High/Low Rules Adaptation: In a Bullish range, indicator updates the high if a candle's body, not just the wick, exceeds the current high. This subtle yet significant change allows for a more conservative and potentially more accurate portrayal of bullish sentiment.
Dynamic Updating: As the market evolves, the indicator recalibrates the high and low lines based on the latest price movements, ensuring that you always have the most current and relevant data.
The indicator is not merely a trend-following or scalping tool. It leverages a distinct interpretation of market behavior, focusing on the last major "sell before buy" in Bullish ranges and "buy before sell" in Bearish ranges. By doing so, it aims to pinpoint the true sentiment behind price movements, offering traders a more grounded basis for anticipating market trends.
Of course, a special acknowledgment is due to Anton for his foundational work and the insightful knowledge he's giving day-by-day. The principles of his structure tracking method and market approach have significantly influenced the creation of this indicator, which now carries those insights forward, adapted through the lens of my personal trading philosophy.
