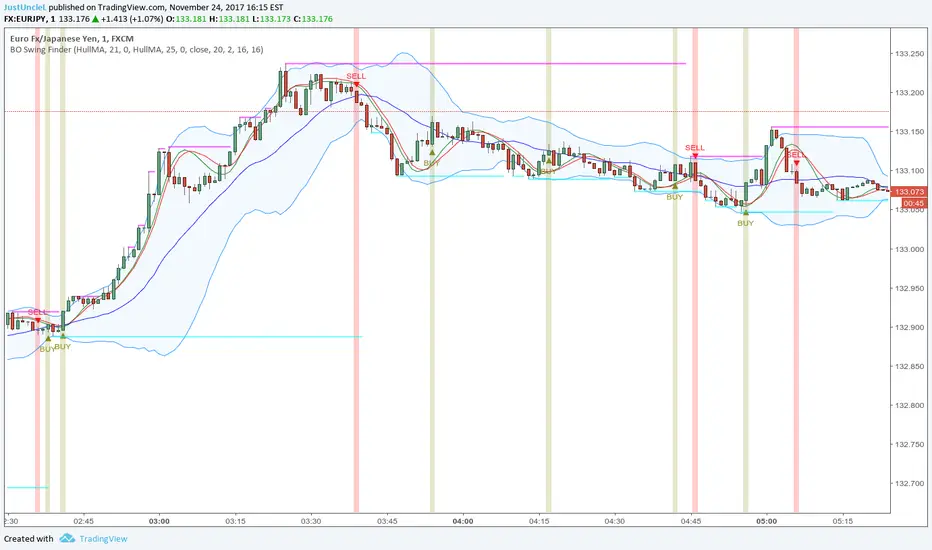
BO Swing Finder R0.6 by JustUncleLThis indicator alert study attempts to detect confirmed Swing points. It uses Bollinger Band centre line crosses as the main signal. The main detection occurs by looking for the first BB centre line cross that was initiated from outside the Bollinger Channel (alternatively KC channel can be used).
The optional HullMA (any any other MA pair) are used to confirm the swing direction. The indicator also plots the two KitKat Support and Resistance lines with optional High/Low labelling on KitKat1 lines.
This indicator tool is suitable for any time frame and can be traded with Binary Option (even 1min) orders (2-3 candle expiry) or as Forex trade orders. It is suitable for Currencies, Cryptocurrencies and Metals. May also be useful on other markets as well.
The MA filtering options, each MA line can be a different type, with an optional offset:
SMA = Simple Moving Average.
EMA = Exponential Moving Average.
WMA = Weighted Moving Average
VWMA = Volume Weighted Moving Average
SMMA = Smoothed Simple Moving Average.
DEMA = Double Exponential Moving Average
TEMA = Triple Exponential Moving Average.
HullMA = Hull Moving Average, fast moving MA.
SSMA = Ehlers Super Smoother Moving average, similar results to HullMA.
ZEMA = Near Zero Lag Exponential Moving Average.
TMA = Triangular (smoothed) Simple Moving Average.
NOTE: The signal calculations do occur on the current candle, so the state of the signal may re-build until the current candle is closed. I have designed the script to behave this way on purpose. This gives traders the option of
preparing their trade early or even taking the trade early if they want. Otherwise the trader can be more conservative and wait for signal candle to close, to give them a confirmed signal. (This is NOT re-painting as the historical signal states are fixed and will not change, unless you change some setup options.)
Hints:
1) As with all indicator and alerting tools, not all signals will yield a tradable successful swing. You need to apply you own analysis on each signal to determine the probability of success.
2) When using the MA to filter the signals you should use it for two types of filtering:
Supportive that confirm swing like fast moving MAs with fairly short lengths, eg HullMA(21,25).
Long Term Direction with smoother longer length MAs like SMMA(180,220) to show up swings back into direction of the longer term trends.
Inspiration: @Lyiness
References:
Momentum VMA KITKAT CROSS v2.1 by vdubus (- Vdubus_Channel www.vdubus.co.uk)
Search in scripts for "BOS"

RSI Candles Pro [MTF]**RSI Candles Pro**
## **Overview**
The RSI Candles Pro indicator provides an advanced framework for visualizing RSI momentum through candlestick representation, structural analysis, and multi-dimensional confirmation signals. Unlike conventional RSI oscillators that display only a line plot, this system transforms RSI into a complete OHLC candlestick chart with integrated strength metrics, structural break detection, divergence analysis, and dynamic support/resistance mapping.
Each element adapts continuously to RSI behavior, offering traders a living map of momentum shifts, structural changes, and reversal potential. The indicator doesn't simply show overbought/oversold conditions—it quantifies momentum strength, tracks structural breaks, detects price-RSI divergences, and projects key inflection levels with precision.
The result is a comprehensive, momentum-aware representation of market structure:
- **RSI OHLC Candles** visualize momentum direction, strength, and conviction through candlestick patterns with dynamic color intensity.
- **Strength Scoring System** quantifies momentum conviction using distance from neutral, momentum acceleration, and candle body characteristics.
- **RSI Structure Lines & Zones** connect swing highs and lows, creating visual support/resistance zones within RSI space.
- **Break of Structure (BOS) Detection** identifies decisive momentum shifts when RSI breaks previous structural levels, complete with projected support/resistance lines.
- **Auto Pivot Horizontal Lines** dynamically map key RSI levels where price repeatedly reacts, serving as momentum inflection zones.
- **Divergence Detection** captures classic bullish and bearish divergences between price action and RSI behavior, flagging potential reversal conditions.
Unlike static RSI line plots or simple zone highlighting, RSI Candles Pro fuses candlestick visualization with structural awareness, strength quantification, and divergence analysis to provide a clear, multi-dimensional picture of momentum dynamics and potential turning points.
---
## **Theoretical Foundation**
The RSI Candles Pro indicator builds on principles of **momentum oscillation theory**, **structural market analysis**, and **divergence recognition**—concepts widely used by technical analysts to identify trend strength, exhaustion, and reversal conditions.
Standard RSI indicators display momentum as a single line crossing threshold levels, but this approach ignores critical dimensions: **momentum strength**, **structural context**, and **rate of change acceleration**. This indicator recognizes that RSI behavior can be decomposed into candlestick patterns that reveal conviction, hesitation, and reversal signals just as price candles do.
At its core are six interacting components:
### **1. RSI OHLC Candlestick Construction**
The indicator calculates RSI independently for open, high, low, and close prices within each bar, creating true RSI candlesticks rather than a single-line plot. This reveals:
- **Momentum direction** (bullish vs. bearish candles)
- **Momentum volatility** (wick length shows RSI range)
- **Momentum conviction** (body size indicates decisiveness)
- **Indecision patterns** (doji candles signal momentum exhaustion)
### **2. Strength Scoring Algorithm**
A composite strength score quantifies momentum conviction by analyzing three factors:
- **Distance from neutral (50 level)**: Greater distance indicates stronger directional bias
- **Momentum acceleration**: Rate of RSI change over recent bars reveals building or fading momentum
- **Body-to-range ratio**: Larger bodies relative to total candle range show decisive momentum vs. indecision
This produces a 0-100 strength score that dynamically adjusts candle transparency—strong moves appear vibrant, weak moves appear faded—providing instant visual feedback on momentum quality.
### **3. RSI EMA with Slope-Sensitive Coloring**
A smoothed exponential moving average of RSI serves as a trend filter, but with a critical enhancement: **dynamic color coding based on slope direction**. When the RSI EMA slopes upward, it displays in bullish color; when sloping downward, bearish color. This provides instant trend context and filters noise from raw RSI fluctuations.
### **4. RSI Structural Framework**
The indicator identifies swing highs and lows within RSI space using pivot detection, then:
- **Connects consecutive swings with lines** to visualize RSI trend channels
- **Creates shaded zones between swings** to highlight support/resistance regions in momentum space
- **Implements cooloff periods** to prevent redundant signals and maintain chart clarity
These structural elements reveal whether RSI is forming higher highs/higher lows (bullish structure) or lower highs/lower lows (bearish structure).
### **5. Break of Structure (BOS) Logic**
The system detects **decisive momentum shifts** when RSI breaks previous structural levels in alignment with RSI EMA trend direction:
- **Bullish BOS**: RSI breaks above previous swing high while RSI EMA is rising
- **Bearish BOS**: RSI breaks below previous swing low while RSI EMA is falling
When BOS occurs, the indicator automatically:
- Places a BOS label at the breakout point
- Projects a support/resistance line forward (20+ bars)
- Creates a shaded zone around the S/R level
- Provides tooltip information with exact S/R values
This gives traders actionable levels where momentum shifts may be defended or rejected.
### **6. Price-RSI Divergence Detection**
Classic divergence analysis identifies conditions where price and momentum disagree:
- **Bullish Divergence**: Price makes lower low, RSI makes higher low (momentum refusing to confirm weakness)
- **Bearish Divergence**: Price makes higher high, RSI makes lower high (momentum weakening despite price strength)
Divergences often precede significant reversals, providing early warning signals before price structure breaks.
### **7. Auto Pivot Horizontal Lines**
The indicator dynamically tracks historical RSI pivot points and plots horizontal lines at these levels, extended forward in time. These act as **momentum support/resistance zones**—levels where RSI has repeatedly turned in the past and may respect again in the future. The system:
- Detects unique pivot levels (filtering duplicates within 2 RSI points)
- Maintains a configurable maximum number of lines per side
- Optionally extends lines infinitely right for persistent reference
- Labels each line with its exact RSI value
By integrating these elements, the indicator provides both micro-level momentum analysis (individual candle strength) and macro-level structural context (swing patterns, BOS events, divergences, key levels), maintaining clarity while revealing momentum dynamics in real time.
---
## **How It Works**
The RSI Candles Pro indicator operates through layered processing stages:
### **Stage 1: RSI OHLC Calculation**
- Four independent RSI calculations are performed for each bar: RSI(open), RSI(high), RSI(low), RSI(close)
- These are combined to form RSI candlesticks:
- **RSI Open/Close**: Determines candle body direction and size
- **RSI High**: Highest value among all four RSI calculations becomes upper wick
- **RSI Low**: Lowest value among all four RSI calculations becomes lower wick
- This creates a complete candlestick representation in RSI space that mirrors price action behavior
### **Stage 2: Strength Score Computation**
For each RSI candle, a composite strength score is calculated:
This score drives **dynamic transparency**: strong moves (score > 70) display with high opacity, weak moves (score < 40) display faded, providing instant visual feedback on momentum quality.
### **Stage 3: RSI EMA Trend Filter**
- An exponential moving average smooths RSI values over a configurable period (default 9)
- The slope is calculated: `rsiEmaSlope = rsiEMA - rsiEMA `
- Dynamic coloring:
- **Positive slope** → Green/Bullish color
- **Negative slope** → Red/Bearish color
- **Flat slope** → Gray/Neutral color
- This provides trend context and filters out noise from raw RSI oscillations
### **Stage 4: Structural Swing Detection**
- Swing highs and lows are identified using pivot detection with configurable lookback (default 5 bars left/right)
- **Cooloff mechanism** prevents redundant signals by requiring minimum bars between swings (default 8)
- When new swings are detected:
- Previous swing values are stored for BOS comparison
- Lines connect consecutive swings to visualize momentum structure
- Shaded boxes (zones) highlight the range between swings as support/resistance regions
### **Stage 5: Break of Structure (BOS) Analysis**
The system monitors RSI behavior relative to previous structural levels:
**Bullish BOS triggers when:**
1. RSI EMA slope is positive (uptrend filter)
2. Current RSI close exceeds previous swing high
3. Previous bar's RSI was below that swing high (confirms break)
4. Cooloff period has elapsed since last bullish BOS (default 10 bars)
**Bearish BOS triggers when:**
1. RSI EMA slope is negative (downtrend filter)
2. Current RSI close breaks below previous swing low
3. Previous bar's RSI was above that swing low (confirms break)
4. Cooloff period has elapsed since last bearish BOS
Upon BOS detection, the indicator automatically:
- Places a labeled marker at the breakout point
- Calculates S/R level with buffer (e.g., RSI low - 0.5 points for bullish BOS)
- Draws a dashed S/R line extending forward (configurable, default 20 bars)
- Creates a shaded S/R zone (±0.5 points from line)
- Adds an "S/R" label at the line's end
### **Stage 6: Auto Pivot Line Management**
- Pivot highs and lows are detected using a separate lookback period (default 5)
- When a new pivot forms:
- System checks if a similar level already exists (within 2 RSI points)
- If unique, adds a horizontal line at that RSI value
- Lines are stored in arrays with configurable maximum capacity (default 4 per side)
- Oldest lines are automatically removed when capacity is exceeded
- Optional labels display exact RSI values at pivot levels
### **Stage 7: Divergence Detection**
The system compares price pivot points with RSI pivot points:
**Bearish Divergence:**
- Price makes higher high compared to previous pivot high
- RSI makes lower high compared to previous RSI pivot high
- RSI must be above 50 (mid-level) to confirm overbought context
- Triangle-down marker placed above candle with "DIV" text
**Bullish Divergence:**
- Price makes lower low compared to previous pivot low
- RSI makes higher low compared to previous RSI pivot low
- RSI must be below 50 to confirm oversold context
- Triangle-up marker placed below candle with "DIV" text
### **Stage 8: Strength Dot Visualization**
Colored dots appear according to Delta Volume strength:
### **Stage 9: Real-Time Info Table**
Through these processes, the indicator creates a living, adaptive representation of RSI behavior that reveals both momentum strength and structural context in real time.
---
## **Interpretation**
The RSI Candles Pro indicator reframes momentum reading from simple overbought/oversold levels to structured awareness of momentum behavior:
### **Candle Patterns**
- **Large-bodied bullish candles (vibrant green)**: Strong, decisive bullish momentum—continuation likely
- **Large-bodied bearish candles (vibrant red)**: Strong, decisive bearish momentum—continuation likely
- **Small-bodied or doji candles (faded/gray)**: Indecision or momentum exhaustion—reversal possible
- **Long upper wicks**: Failed bullish momentum—rejection at resistance
- **Long lower wicks**: Failed bearish momentum—support holding
### **RSI EMA Trend Context**
- **RSI EMA rising (green)**: Momentum uptrend—favor bullish setups
- **RSI EMA falling (red)**: Momentum downtrend—favor bearish setups
- **RSI EMA flat (gray)**: Momentum consolidation—wait for directional clarity
### **Structural Analysis**
- **RSI making higher swing lows with rising EMA**: Bullish structure intact—look for dip-buying opportunities
- **RSI making lower swing highs with falling EMA**: Bearish structure intact—look for rally-selling opportunities
- **Shaded structure zones**: Key support/resistance in momentum space—expect reactions at these levels
### **Break of Structure Signals**
- **Bullish BOS + S/R line**: Momentum confirming upward shift—S/R line becomes support if price dips
- **Bearish BOS + S/R line**: Momentum confirming downward shift—S/R line becomes resistance if price rallies
- **S/R line break**: Momentum structure failing—potential reversal or deeper retracement
### **Pivot Lines**
- **Price approaching RSI pivot high**: Momentum resistance—watch for rejection or breakout
- **Price approaching RSI pivot low**: Momentum support—watch for bounce or breakdown
- **Multiple pivot lines clustered**: Strong momentum support/resistance zone—high-probability reaction area
### **Divergences**
- **Bullish divergence in oversold zone**: Momentum refusing to make new lows despite price weakness—reversal setup
- **Bearish divergence in overbought zone**: Momentum weakening despite price strength—reversal setup
- **Divergence + structure break**: High-conviction reversal signal—combined technical and momentum confirmation
### **Strength Dots**
- **Large dots**: High-conviction moves—reliable trend continuation signals
- **Small dots**: Low-conviction moves—increased reversal risk, avoid chasing
- **Diamond warnings in extremes**: Overextended conditions—prepare for mean reversion
### **Zone Background**
- **Red background (RSI > 70)**: Overbought—watch for bearish divergence or momentum exhaustion
- **Green background (RSI < 30)**: Oversold—watch for bullish divergence or momentum recovery
- **No background (30-70)**: Neutral zone—rely on structure and BOS for directional bias
---
## **Strategy Integration**
RSI Candles Pro integrates seamlessly into momentum-based and reversal trading systems:
### **Trend Continuation Strategies**
- **Entry trigger**: Bullish BOS in rising RSI EMA context with strong candle (large dot)
- **Confirmation**: Price respecting S/R line as support on pullback
- **Exit**: Bearish divergence or RSI candle indecision (doji) at pivot resistance
### **Reversal Strategies**
- **Setup**: Divergence forming in extreme zone (RSI > 70 or < 30)
- **Trigger**: RSI structure break opposite to prevailing trend (bearish BOS in uptrend)
- **Confirmation**: RSI EMA slope change + decisive candle in reversal direction
- **Entry**: On pullback to S/R line or pivot level
### **Momentum Fade Strategies**
- **Signal**: Small strength dots appearing in extreme zones
- **Setup**: RSI touching pivot resistance/support with indecision candle
- **Entry**: Opposite-direction candle with medium/large dot
- **Stop**: Beyond recent RSI structure level
### **Structure-Based Entries**
- **Align higher-timeframe RSI trend** (EMA slope direction)
- **Wait for lower-timeframe BOS** in alignment with higher trend
- **Enter on retest** of S/R line with strength confirmation (large dot)
- **Scale out** at next pivot level or divergence signal
### **Multi-Indicator Confluence**
Combine RSI Candles Pro with:
- **Price structure indicators** (Smart Money Concepts, market structure) for trade direction
- **Volume indicators** to confirm momentum with participation
- **Volatility indicators** (ATR, Bollinger Bands) for position sizing context
- **Institutional Zone Detector** for volume profile alignment—RSI BOS + price at VAL/VAH = high-conviction entry
### **Multi-Timeframe Coordination**
- **Higher timeframe** (4H-Daily): Identify RSI EMA trend direction and major structure
- **Lower timeframe** (15min-1H): Execute entries on BOS signals aligned with higher timeframe
- **Micro timeframe** (1-5min): Fine-tune entries using strength dots and pivot reactions
---
## **Technical Implementation Details**
### **Core Engine**
- **RSI OHLC calculation**: Four independent RSI computations per bar create candlestick representation
- **Strength scoring**: Multi-factor composite algorithm quantifies momentum conviction
- **Dynamic transparency**: Real-time opacity adjustment based on strength score
### **Structural Framework**
- **Pivot-based swing detection**: Configurable left/right bar lookback with cooloff mechanism
- **Line and zone visualization**: Connects consecutive swings with shaded support/resistance regions
- **Array-based storage**: Previous swing values preserved for BOS comparison logic
### **BOS Detection Engine**
- **Dual-condition logic**: Structure break + trend alignment (RSI EMA slope) required
- **Automatic S/R projection**: Lines, zones, and labels generated upon BOS events
- **Cooloff management**: Prevents signal spam during extended directional moves
### **Divergence System**
- **Price-RSI pivot comparison**: Detects higher-high/lower-high and lower-low/higher-low patterns
- **Zone filtering**: Divergences only trigger in appropriate zones (above/below 50)
- **Visual markers**: Triangle shapes with "DIV" text for instant recognition
### **Auto Pivot Management**
- **Dynamic level tracking**: Arrays store lines, values, and labels
- **Duplicate filtering**: Prevents redundant lines within 2 RSI points
- **Capacity control**: Automatic removal of oldest lines when maximum reached
- **Optional extension**: Lines can extend infinitely right for persistent reference
### **Performance Profile**
- **Lightweight computation**: Efficient pivot detection and array management
- **Real-time responsiveness**: Immediate updates on bar close
- **Scalable across timeframes**: Maintains clarity from 1-minute to daily charts
- **Configurable visual elements**: All features can be toggled for custom layouts
---
## **Optimal Application Parameters**
### **Timeframe Guidance**
**1-5 Minute Charts (Scalping):**
- RSI Length: 9-11 (faster response)
- RSI EMA Length: 5-7
- Structure Lookback: 3-4
- Pivot Lookback: 3-4
- Use Case: Micro momentum shifts, quick BOS entries
**15-60 Minute Charts (Intraday Swing):**
- RSI Length: 14 (standard)
- RSI EMA Length: 9
- Structure Lookback: 5
- Pivot Lookback: 5
- Use Case: Intraday structure breaks, divergence reversals
**4 Hour - Daily Charts (Position Trading):**
- RSI Length: 14-21
- RSI EMA Length: 13-21
- Structure Lookback: 7-10
- Pivot Lookback: 7-10
- Use Case: Major momentum shifts, high-timeframe divergences
### **Suggested Configuration (Default)**
- **RSI Length**: 14 (industry standard)
- **RSI EMA Length**: 9 (smooth but responsive)
- **Overbought Level**: 70
- **Oversold Level**: 30
- **Structure Lookback**: 5 bars
- **Structure Cooloff**: 8 bars
- **BOS Cooloff**: 10 bars
- **S/R Extension**: 20 bars
- **S/R Buffer**: 0.5 RSI points
- **Pivot Lookback**: 5 bars
- **Max Pivot Lines**: 4 per side
- **Divergence Lookback**: 5 bars
- Use strength dots as primary filter—require large dots for entries
- Rely heavily on divergences and structure zones
**Trending Markets:**
- Focus on BOS signals aligned with RSI EMA slope
- Use pivot lines as profit targets
- Ignore counter-trend divergences until RSI EMA changes slope
**Ranging Markets:**
- Emphasize divergences at extreme levels
- Trade bounces from pivot lines
- Reduce reliance on BOS signals (more false breaks)
---
## **Performance Characteristics**
### **High Effectiveness:**
- **Trending markets with clear momentum cycles**: RSI structure aligns with price structure for reliable BOS signals
- **Markets with defined swing patterns**: Pivot lines and structure zones provide accurate support/resistance
- **Divergence-prone assets**: Assets that respect momentum/price divergences (equities, major FX pairs)
- **Timeframes with sufficient volatility**: RSI candles show meaningful patterns when price moves decisively
### **Reduced Effectiveness:**
- **Choppy, sideways markets**: RSI oscillates around 50 with no structural pattern, generating false BOS signals
- **Low-liquidity assets**: Erratic price action creates unreliable RSI swings
- **News-driven volatility spikes**: Sudden moves invalidate structure and create whipsaws
- **Extremely low timeframes (< 1 minute)**: Noise overwhelms signal, structure breaks lack follow-through
### **Optimal Market Conditions:**
- **Clear momentum phases** with defined RSI EMA trend
- **Respect for previous swing levels** in RSI space
- **Volume participation** during BOS events (combine with volume indicator)
- **Alignment between RSI structure and price structure**
---
## **Integration Guidelines**
### **Confluence Framework**
Combine RSI Candles Pro with:
1. **Volume analysis** (Institutional Zone Detector, volume profile) to confirm RSI BOS with volume participation
2. **Price structure** (Smart Money Concepts, order blocks) to align RSI momentum with price levels
3. **Trend indicators** (moving averages, Supertrend) for higher-timeframe directional bias
4. **Volatility indicators** (ATR, Bollinger Bands) for stop-loss and profit target placement
### **Directional Control**
- **Never trade against RSI EMA slope** unless high-conviction divergence present
- **Require BOS alignment** with RSI EMA direction for continuation trades
- **Wait for RSI EMA slope change** before taking counter-trend reversals
### **Risk Calibration**
- **Stop-loss placement**: Beyond recent RSI structure swing (converted to price)
- **Position sizing**: Larger positions for strong candles (large dots) at BOS events
- **Profit targets**: Next pivot line level or opposite-zone boundary (70/30)
- **Trail stops**: Use S/R lines as trailing stop levels after BOS
### **Multi-Timeframe Synergy**
1. **Check higher timeframe** (3x-5x current): RSI EMA slope and major structure
2. **Identify current timeframe**: BOS events and divergences
3. **Execute on lower timeframe** (1/3x-1/5x current): Strength-confirmed entries at pivot levels
4. **Align all timeframes**: Only trade when RSI structure agrees across timeframes
### **Alert Strategy**
Enable alerts for:
- **RSI BOS events**: Immediate notification of momentum structure breaks
- **Divergences**: Early warning of potential reversals
- **Extreme zone entries**: RSI crossing 70/30 levels
- **RSI EMA trend changes**: Shifts in momentum trend direction
---
## **Disclaimer**
The RSI Candles Pro indicator is a professional-grade momentum visualization and structural analysis tool. It is not predictive or guaranteed profitable; performance depends on parameter tuning, market regime, and disciplined execution.
**Key Considerations:**
- RSI is a **derivative indicator** (calculated from price), not a leading indicator—it confirms momentum but does not predict future price
- **Divergences can persist** for extended periods; early entries may require multiple attempts
- **BOS signals may fail** in choppy markets; always use stop-losses and risk management
- **Optimal parameters vary** by asset, timeframe, and volatility regime—backtesting recommended
- **No indicator works in isolation**; combine with price action, volume, and market context
**Best Practices:**
- Paper trade new configurations before risking capital
- Maintain a trading journal to identify which signals work best for your style
- Adjust cooloff periods and lookback lengths based on asset characteristics
- Use in conjunction with fundamental analysis and broader market context
- Never risk more than 1-2% of capital per trade, regardless of indicator signals
This indicator is designed to enhance decision-making, not replace it. Traders should integrate RSI Candles Pro into a comprehensive analytical framework that includes price structure, volume analysis, and risk management protocols. Success requires consistent application of tested strategies, emotional discipline, and continuous adaptation to changing market conditions.

Livermore's Pyramiding Trading - 3Commas [SwissAlgo]
📊 J. LIVERMORE'S PYRAMIDING TRADING - 3Commas Integrated
A Trading Approach Inspired by Jesse Livermore's Position Building Principles
━━━━━━━━━━━━━━━━━━━━━━━━━━━━━━━━━━━━━━━━━━━
DISCLAIMER
This indicator is an educational tool based on historical trading principles. Past performance is not indicative of future results. Trading involves substantial risk of loss. Only trade with capital you can afford to lose. You are responsible for all trading decisions.
━━━━━━━━━━━━━━━━━━━━━━━━━━━━━━━━━━━━━━━━━━━
📚 WHO WAS JESSE LIVERMORE?
Jesse Livermore (1877-1940) was one of the greatest traders in history.
His core insight: "Most traders do everything backward."
♦ "They deploy all capital at once" → Livermore entered with a small fraction of his capital (he started with a 'test position' to validate his trade idea and waited for market confirmation to deploy more, building positions in steps = "pyramiding")
♦ "They average down" (DCA) → Livermore added to trades showing good results only, and never to losing trades, as the trend kept aligning with his trade idea
♦ "They use arbitrary % stops" → Livermore exited when structure appeared broken (he trailed his stop loss to try to protect unrealized profit - if any)
♦ "They take profits too early or set arbitrary TP%" → Livermore let trades showing positive results run until proven wrong (trial take profit)
💬 "I always made money when I was sure I was right before I began. What beat me was not having enough brains to stick to my own game."
— Jesse Livermore
This indicator tries to translate his principles into a SYSTEMATIC FRAMEWORK :
BO = Base Order (first order, base of the pyramid)
PO = Pyramid Orders (additional layers of capital deployed as long as the 'tape' does not invalidate the trade idea)
♦ Test First (BO - 20%) - Small entry to test your idea. If wrong, lose small. If right, can consider pyramiding into strength.
♦ Build Position Size (PO1-3 - 80%) - Add only as trend unfolds favorably (the indicator uses specific Fibonacci levels to track milestones - 0.618, 1.0, 1.272 - and looks for strong confluence among price, volume, trend, momentum, break of resistance/support levels to suggest and trigger actions: entries, exit)
♦ Attempt to Protect Capital - Dynamic stops: the indicator trails the stop loss, to try to protect potential gains from previous steps (if any)
♦ Discipline - Trades fire only when ALL conditions align
━━━━━━━━━━━━━━━━━━━━━━━━━━━━━━━━━━━━━━━━━━━
🎯 INDICATOR FEATURES
You map 3 points on the chart → The indicator generates a systematic trading plan structure based on your wave analysis.
✓ Auto-detects trade direction: Uptrend wave (A➚B➘C) = Long signals | Downtrend wave (A➘B➚C) = Short signals
✓ Entry/exit prices: BO, PO1, PO2, PO3, and dynamic EXIT (trailing stop)
✓ Real-time condition monitoring: Live ✓/✗ checks for each order (price closes + volume + trend + pivot breaks + candle quality + sequence)
✓ Visual trade execution: Green labels mark entries (BO/PO1/PO2/PO3), red labels mark EXIT
✓ Optional 3Commas automation: JSON webhooks for hands-free execution via Signal Bots
⏰ Recommended Timeframes: 1H, 4H, Daily
(Lower timeframes like 15m/5m produce excessive noise and false signals)
💬 "Watch the market leaders, the stocks that have led the charge. That is where the action is and where the money is made."
— Jesse Livermore
━━━━━━━━━━━━━━━━━━━━━━━━━━━━━━━━━━━━━━━━━━━
⚙️ SETUP IN 3 STEPS
🟡 STEP 1: Map Your Wave (Points A → B → C)
Identify a completed wave pattern:
For LONGS:
♦ Point A = Swing low (wave start)
♦ Point B = Swing high (impulse end)
♦ Point C = Pullback low (retrace end - where next wave may begin)
For SHORTS:
♦ Point A = Swing high (wave start)
♦ Point B = Swing low (impulse end)
♦ Point C = Pullback high (retrace end - where next wave may begin)
How to set points:
Settings → Enter dates manually OR drag the vertical lines directly on the chart (easier - just click and drag the pre-mapped A/B/C lines)
Requirements (auto-validated by code):
✓ All dates must be in the past (Point C = completed retrace, not forming)
✓ Clear impulse A→B (minimum 5% move)
✓ Clear retrace B→C (minimum 3% pullback)
───────────────────────────────────────────
🟡 STEP 2: Set Budget & Allocation
Settings → "TRADE PARAMETERS"
♦ Total Budget: $10,000 (example - capital for THIS trade only, not your entire account)
♦ Allocation (must total 100%):
BO = 20% ($2,000) - test position
PO1 = 25% ($2,500) @ Fib 0.618
PO2 = 30% ($3,000) @ Fib 1.0
PO3 = 25% ($2,500) @ Fib 1.272
💬 "It was never my thinking that made big money for me. It was always my sitting. Men who can both be right and sit tight are uncommon."
— Jesse Livermore
───────────────────────────────────────────
🟡 STEP 3: Monitor Your Trade Plan Table
The table (top-right corner) has 4 sections that guide your execution:
BUDGET DEPLOYMENT
♦ Trigger prices for each order (BO auto-calculated at 0.5 Fib between B-C)
♦ Dollar amount per entry
♦ Fibonacci level assigned to each PO
ENTRY/EXIT CONDITIONS
Each column (BO, PO1, PO2, PO3) shows live status (✓ or ✗) for:
♦ Price: 2 consecutive closes (BO) | 3 consecutive closes (POs)
♦ Volume: OBV directional alignment OR volume spike above average
♦ Trend: Normal or Strong Bull/Bear (no entries in Uncertain trend)
♦ Pivot: Nearest resistance (longs) or support (shorts) broken
♦ Clean Candle: Momentum without reversal wicks <30% (POs only)
♦ Sequence: Prior order must have fired first (POs only - no skipping levels)
TRIGGERED?
Shows execution status for each order (✓ = fired, ✗ = waiting)
If using 3Commas: ✓ confirms JSON alert was sent to your bot for real execution
VALIDATIONS
✓ Green = All checks passed, setup is valid
⚠️ Yellow = Warning (e.g., budget doesn't equal 100%, deep retrace)
✗ Red = Error (e.g., dates in wrong order, invalid wave structure)
⚠️ Wait for ALL ✓✓✓✓✓ (or ✓✓✓✓✓✓) to align in a column before that order fires at bar close
💬 "The game of speculation is the most uniformly fascinating game in the world. But it is not a game for the stupid, the mentally lazy, the person of inferior emotional balance, or the get-rich-quick adventurer."
— Jesse Livermore
━━━━━━━━━━━━━━━━━━━━━━━━━━━━━━━━━━━━━━━━━━━
📊 CHART VISUALS - READING THE INDICATOR
Fibonacci Extension Lines
After mapping A-B-C, horizontal lines extend to the right:
♦ Solid green/red lines = Active PO entry levels (0.618, 1.0, 1.272)
♦ Dotted gray lines = Reference Fib levels used for exit tracking (2.0, 2.618, 3.0, etc.)
♦ Labels on right = Show level and price: "Fib 0.618 / $67,324 "
Entry/Exit Price Lines
♦ Thick green line (longs) / red line (shorts) = BO entry price with direction label
♦ Dashed red line = Current EXIT price (your trailing stop loss - appears after BO fires and moves as price extends)
Trade Execution Labels
Visual confirmation when orders fire on the chart:
♦ Green labels (below/above candles) = BO, PO1, PO2, PO3 entries executed
♦ Red label = EXIT triggered (position closed)
Trend Strength Indicator (EMA Line)
The thick colored line shows real-time trend status:
♦ Bright lime = Strong bullish trend
♦ Light green = Normal bullish trend
♦ Bright red = Strong bearish trend
♦ Light red = Normal bearish trend
♦ Gray = Uncertain/weak trend (no entries fire in this state)
Entries require at least Normal trend strength aligned with your trade direction.
💬 "I never argue with the tape. Getting sore at the market doesn't get you anywhere."
— Jesse Livermore
━━━━━━━━━━━━━━━━━━━━━━━━━━━━━━━━━━━━━━━━━━━
🔧 ENTRY LOGIC - TECHNICAL DETAILS
💬 "The big money was never made in the buying or the selling. The big money was made in the waiting."
— Jesse Livermore
───────────────────────────────────────────
🟢 BASE ORDER (BO) - TEST POSITION
BO Price Calculation
Auto-calculated at the 0.5 Fibonacci retracement between Point B and Point C
Formula: (Price B + Price C) / 2
Why this level?
♦ Midpoint between impulse end (B) and retrace end (C)
♦ Breakout above/below suggests retrace may be complete
♦ Designed to help position BO below all Fib extensions (to control sequence issues)
───────────────────────────────────────────
BO Entry Conditions - ALL 5 Must Align:
1️⃣ PRICE: 2 Consecutive Closes Beyond BO
♦ Longs: close > BO AND close > BO
♦ Shorts: close < BO AND close < BO
♦ Why: Designed to confirm breakout commitment and filter fakeouts
2️⃣ TREND: Normal OR Strong Trend Aligned
♦ Detection: 18-period EMA + ADX/DMI + higher timeframe slope
♦ States: Strong Bull/Bear (ADX>30), Normal Bull/Bear (price vs EMA), Uncertain
♦ Confirmation: Requires 3 consecutive bars in the same state (to reduce flip-flop)
♦ BO accepts: Normal OR Strong (you're testing early, basic alignment sufficient)
3️⃣ PIVOT: Nearest Resistance/Support Broken
♦ Storage: 60 most recent pivot highs/lows (dynamic lookback per timeframe)
♦ Longs: Nearest pivot HIGH above BO → must break with 2 closes
♦ Shorts: Nearest pivot LOW below BO → must break with 2 closes
♦ Price Discovery: If no pivot exists beyond BO = auto-pass
♦ Why: Aims to confirm momentum has overcome previous rejection zones
4️⃣ VOLUME: OBV Aligned OR Spike
♦ Directional OBV: OBV > 20-EMA (longs) OR OBV < 20-EMA (shorts)
♦ OR Volume Spike: Current volume > 20-period SMA
♦ Why: Checks for institutional participation signals
5️⃣ VALIDATIONS: Setup Valid (✅)
♦ Dates valid (A < B < C, all in past)
♦ Wave structure valid (min 5% impulse, min 3% retrace)
♦ Budget allocation = 100%
♦ Prices detected at all points
⚠️ BO fires once per bar close. Flag set permanently until trade resets.
───────────────────────────────────────────
🔺 PYRAMID ORDERS (PO1-3) - PYRAMIDING INTO STRENGTH
💬 "Never buy a stock because it has had a big decline from its previous high. The big money was never made in the stock market by buying on declines."
— Jesse Livermore
PO Price Calculation
Fixed Fibonacci extensions from Point C:
Formula: Price C ± (Impulse Range × Fib Level)
Where: Impulse Range = |Price B - Price A|
Default Levels:
♦ PO1 @ Fib 0.618 (Golden Ratio)
♦ PO2 @ Fib 1.000 (Full impulse repeat)
♦ PO3 @ Fib 1.272 (Fibonacci sequence extension)
───────────────────────────────────────────
PO Entry Conditions - ALL 6 Must Align (STRICTER):
1️⃣ PRICE: 3 Consecutive Closes Beyond PO
♦ Longs: close > PO AND close > PO AND close > PO
♦ Shorts: close < PO AND close < PO AND close < PO
♦ Why: Higher conviction needed when adding capital (3 vs 2 closes for BO)
2️⃣ TREND: Same as BO
Normal OR Strong trend must remain aligned with trade direction
3️⃣ PIVOT: Per-Level Pivot Break
♦ Each PO checks its OWN nearest pivot (not shared with BO)
♦ Same 2-close break requirement
♦ PO3 Exception: Price discovery allowed (no pivot required if already profitable)
4️⃣ VOLUME: Same as BO
Sustained confirmation required (not weakening)
5️⃣ CLEAN CANDLE: <30% Reversal Wick (NEW)
♦ Filter: Uses ATR(14) - candles < ATR auto-pass (consolidation noise)
♦ Longs: Upper wick < 30% of candle range (no rejection at top)
♦ Shorts: Lower wick < 30% of candle range (no rejection at bottom)
♦ Why: Don't pyramid into weakness/rejection - only add on clean momentum
♦ Not checked for BO: Test position tolerates some wick risk
6️⃣ SEQUENCE: Prior Order Fired
♦ PO1 requires: BO fired
♦ PO2 requires: PO1 fired
♦ PO3 requires: PO2 fired
♦ Why: No skipping levels - disciplined building only
───────────────────────────────────────────
⚙️ KEY DIFFERENCE:
BO (20% capital) = Lighter requirements, testing your idea early
POs (80% capital) = Stricter requirements, adding only to confirmed winners
♦ BO: 2 closes | POs: 3 closes
♦ BO: No candle check | POs: Clean candle required
♦ BO: Independent | POs: Sequential (must follow order)
♦ BO: No price discovery | PO3: Allows price discovery when profitable
💬 "Profits always take care of themselves, but losses never do. The speculator has to ensure himself against considerable losses by taking the first small loss."
— Jesse Livermore
━━━━━━━━━━━━━━━━━━━━━━━━━━━━━━━━━━━━━━━━━━━
🚪 EXIT LOGIC - TECHNICAL DETAILS
🔴 EXIT PHILOSOPHY
The indicator uses TWO INDEPENDENT EXIT TRIGGERS (whichever fires first):
1) Structural Breakdown
Price breaks through the EXIT level with confirmation
2) Trend Reversal
Trend flips against your position AND price breaks EXIT level
Why two methods?
♦ Structure = price-based protection (hard stop)
♦ Trend = momentum-based exit (early warning when market character changes)
♦ Combined: Exit either when proven wrong (structure) or when conditions no longer favor your direction (trend)
───────────────────────────────────────────
🔴 EXIT PRICE CALCULATION
The EXIT price (your stop loss) adjusts dynamically based on position size:
BEFORE PO3 Fires (Fixed Stops):
♦ BO only = Stop at Point C (small position, tight stop near entry)
♦ PO1 fired = Stop at Fib 0.5 (moved to breakeven zone)
♦ PO2 fired = Stop at Fib 0.786 (protecting partial profits)
AFTER PO3 Fires (Trailing Stops):
♦ Tracking: Monitors the highest Fib reached (longs) or the lowest Fib reached (shorts)
♦ Placement: EXIT moves 1-2 Fib levels below the highest (longs) or above the lowest (shorts)
♦ Example: Price reaches Fib 2.618 → EXIT trails up to Fib 2.0
♦ Purpose: Designed to protect accumulated profits while allowing room for normal pullbacks
💬 "It never was my thinking that made the big money for me. It was always my sitting. Men who can both be right and sit tight are uncommon."
— Jesse Livermore
───────────────────────────────────────────
🔴 EXIT CONDITIONS
Exit Speed (Based on Risk Exposure):
♦ Full position (PO3 fired) = 1 close required (fast exit - more capital at risk)
♦ Partial position (BO/PO1/PO2 only) = 2 closes required (confirmation - less urgency)
METHOD 1: Structural Breakdown
Price violates the EXIT level with clean momentum:
For Longs:
♦ Price closes BELOW EXIT level (1 or 2 closes depending on position size)
♦ Clean candle required (lower wick < 50% of range - no false breakdown)
For Shorts:
♦ Price closes ABOVE EXIT level (1 or 2 closes depending on position size)
♦ Clean candle required (upper wick < 50% of range - no false breakout)
Why clean candle check?
Designed to reduce exits on wicks/fakeouts. If there's a large reversal wick (>50%), it suggests buyers/sellers are defending the level - not a true breakdown.
METHOD 2: Trend Reversal
Market character shifts against your position:
For Longs:
♦ Trend shifts from Bull → Normal Bear OR Strong Bear
♦ AND price breaks below EXIT level (same close requirements)
For Shorts:
♦ Trend shifts from Bear → Normal Bull OR Strong Bull
♦ AND price breaks above EXIT level (same close requirements)
Why this matters?
♦ Proactive exit before structural stop is hit
♦ If the trend that confirmed your entries reverses, the setup is invalidated
♦ Livermore principle: Exit when market proves you wrong, don't wait for max pain
───────────────────────────────────────────
⚠️ EXIT BEHAVIOR
♦ Fires once per bar close (same as entries)
♦ Resets all tracking after exit (ready for fresh trade setup)
♦ Clears flags: boSignalFired, po1/po2/po3SignalFired, highestFib/lowestFib tracking
♦ If using 3Commas: Sends exit_long or exit_short JSON (market order closes 100% position)
💬 "I never argue with the tape. Getting sore at the market doesn't get you anywhere."
— Jesse Livermore
━━━━━━━━━━━━━━━━━━━━━━━━━━━━━━━━━━━━━━━━━━━
🤖 3COMMAS AUTOMATION (OPTIONAL)
💬 "There is the plain fool, who does the wrong thing at all times everywhere, but there is also the Wall Street fool, who thinks he must trade all the time."
— Jesse Livermore
Automation designed to help remove emotion and support disciplined execution.
───────────────────────────────────────────
⚡ QUICK SETUP IN 5 STEPS
STEP 1: Create Your Signal Bots
You need 2 SEPARATE BOTS (one for Longs, one for Shorts):
Go to 3Commas → Bots → Create Bot → Select "Signal Bot"
Basic Settings:
♦ Bot Name: "Livermore Long - " (example: "Livermore Long - BTCUSDT")
♦ Exchange: Your connected exchange
♦ Trading Pair: Must match TradingView chart exactly
♦ Strategy: Custom Signal
♦ Direction: LONG (for first bot) or SHORT (for second bot)
♦ Max Active Deals: 1
⚠️ CRITICAL SETTINGS:
Entry Orders:
♦ Toggle ON: "Entry Orders"
♦ Volume per Order: "Send in webhook, quote"
♦ Why: This lets the indicator control exact $ amounts per order (BO=$2K, PO1=$2.5K, etc.)
♦ If you skip this: Orders will use wrong sizes and break your allocation plan
Exit Orders:
♦ Toggle ON: "Exit Orders"
♦ Volume per Order: "100 Position %"
♦ Why: Closes your entire position when EXIT signal fires
♦ Toggle OFF: "Take Profit" (managed by indicator)
♦ Toggle OFF: "Stop Loss" (managed by indicator)
Click "Start Bot" for both Long and Short bots.
───────────────────────────────────────────
STEP 2: Get Your Bot Credentials
For EACH BOT (Long and Short):
♦ Open the bot → Click "Orders" tab
♦ Scroll down to "Webhook Messages" section
♦ Copy these 3 values:
bot_uuid (long string like: a362cbcf-7e68-4379-a83d-ae6e47dba656)
secret (very long token starting with: eyJhbGciOiJ...)
webhook URL (refer to 3commas to get exact webhook - signal bots)
Note: The secret is usually the same for both bots, but the bot_uuid is different.
───────────────────────────────────────────
STEP 3: Enter Credentials in Indicator
Back in TradingView:
♦ Open indicator Settings
♦ Find section: "1️⃣ INTEGRATE 3COMMAS"
♦ Paste:
Long = Your Long bot UUID
Short = Your Short bot UUID
Secret = Your secret token (same for both)
♦ Click "OK"
The indicator now has everything needed to build JSON payloads.
───────────────────────────────────────────
STEP 4: Create TradingView Alert
This alert bridges TradingView → 3Commas. ONE ALERT HANDLES ALL SIGNALS (BO, PO1, PO2, PO3, EXIT).
How to create:
♦ Right-click chart → "Add Alert" (or click clock icon)
♦ Condition: Select this indicator from dropdown
♦ Trigger: "Any alert() function call"
♦ Alert Name: "Livermore Pyramiding - "
♦ Message: Leave default (indicator sends its own JSON)
♦ Webhook URL: Paste your 3Commas webhook URL from Step 2
♦ ⚠️ Alert Frequency: "Once Per Bar Close" (CRITICAL - controls duplicate orders)
♦ Expiration: Open-ended (or set specific date)
♦ Click "Create"
───────────────────────────────────────────
STEP 5: Test Before Going Live
🧪 NEVER TEST WITH REAL CAPITAL FIRST. Use one of these methods:
Test 1: Check Bot Status
♦ 3Commas → Bots → Both bots show "Active" (green)
♦ Click into each bot → Orders tab → Should say "Waiting for signal"
Test 2: Verify Alert Active
♦ TradingView → Alerts panel (bell icon)
♦ Your alert should show "Active" status
Test 3: Paper Trade / Tiny Position
♦ Use 3Commas paper mode if available, OR
♦ Set Total Budget to $10-50 for first real test
♦ Map a wave that's about to trigger
♦ Watch if orders actually appear on 3Commas
Test 4: Check JSON Format
♦ When alert fires → TradingView Alerts → Click your alert
♦ Look at "History" or "Log"
♦ Verify JSON has: bot_uuid, secret, action, price, amount
───────────────────────────────────────────
🛠️ COMMON ISSUES & SOLUTIONS
✗ Problem: Orders not appearing on 3Commas
Possible causes:
♦ Wrong webhook URL → Must be exact 3Commas URL (check for typos)
♦ Bot paused → Check bot status must be "Active" (green)
♦ Wrong bot UUID → Verify you copied Long UUID for longs, Short UUID for shorts
♦ Secret mismatch → Double-check secret is correct
♦ Exchange API issues → Verify exchange connection in 3Commas settings
How to debug:
♦ 3Commas → Your Signal Bot → Orders tab
♦ Look for "Rejected Signals" section
♦ Should show error messages if webhook failed
───────────────────────────────────────────
✗ Problem: Orders executing at wrong prices
Possible causes:
♦ Limit order not filled → Price gapped through your level before order filled
♦ Slippage on exits → Exits use market orders (intentional - speed over exact price)
♦ Exchange minimums → Some exchanges have minimum order sizes
Solution:
♦ Entries use limit orders (wait for exact price - may not fill if price gaps)
♦ Exits use market orders (prioritize fast execution when structure breaks)
♦ This is INTENTIONAL DESIGN following Livermore's principle: exit when proven wrong
───────────────────────────────────────────
✗ Problem: PO orders firing out of sequence or skipping
Possible causes:
♦ Alert not set to "Once Per Bar Close" → Change alert frequency setting
♦ Multiple alerts running → Delete old/duplicate alerts for this indicator
♦ Conditions changed mid-bar → Indicator only fires at bar close (protective feature)
Solution:
♦ Keep only 1 active alert per indicator instance
♦ Always use "Once Per Bar Close" frequency
♦ Wait for full bar to close before signals can fire
───────────────────────────────────────────
✗ Problem: Bot not closing position on EXIT
Possible causes:
♦ Exit order setting wrong → Check bot settings
♦ Wrong JSON action → Should be "exit_long" or "exit_short"
♦ No position open → Can't close what doesn't exist
Solution:
♦ Verify: Bot Settings → Exit Orders → Volume per Order = "100 Position %"
♦ Check alert history for correct JSON payload
♦ If stuck: Manually close position in 3Commas, then fix settings
♦ Delete and recreate alert if JSON format is wrong
───────────────────────────────────────────
🔒 SECURITY BEST PRACTICES
♦ Never share bot UUID or Secret - Treat them like passwords
♦ Use restricted API keys - Limit to specific pairs, disable withdrawals
♦ Start small - Test with $10-50 first, scale up only after success
♦ Monitor first trades - Don't set-and-forget immediately
♦ Delete old alerts - If you change A/B/C points, delete old alert and create new one
───────────────────────────────────────────
📊 PREFER MANUAL TRADING?
Skip 3Commas entirely and use the indicator for planning only:
♦ Watch Trade Plan table for ✓✓✓✓✓ alignment
♦ Manually place limit orders at displayed prices
♦ Manually move stop loss as EXIT price updates
♦ Manually close when EXIT signal fires
Benefits: Full control, no API concerns, can override based on context
Drawbacks: Must watch chart constantly, emotions can interfere, may miss signals
───────────────────────────────────────────
✅ FINAL CHECKLIST BEFORE LIVE TRADING
✓ Both Signal Bots created (Long + Short)
✓ Entry Orders: Volume = "Send in webhook, quote"
✓ Exit Orders: Volume = "100 Position %"
✓ Take Profit and Stop Loss disabled in bots
✓ Bot UUIDs and Secret entered in indicator
✓ TradingView alert created with correct webhook
✓ Alert frequency = "Once Per Bar Close"
✓ Alert status shows "Active"
✓ Tested with small amounts successfully
✓ Trade Plan table shows ✅ (no validation errors)
✓ Understand your risk per trade
Once all checked: You're ready for automated pyramiding execution.
━━━━━━━━━━━━━━━━━━━━━━━━━━━━━━━━━━━━━━━━━━━
💡 KEY REMINDERS - BEFORE YOU TRADE
💬 "The speculator's chief enemies are always boring from within. It is inseparable from human nature to hope and to fear."
— Jesse Livermore
───────────────────────────────────────────
⚠️ COMMON MISTAKES (AVOID THESE)
Mapping Incomplete Waves
♦ Point C must be in the PAST (completed retrace, not currently forming)
♦ Don't map a wave that's still developing - wait for confirmation
♦ Minimum requirements: 5% impulse (A→B), 3% retrace (B→C)
Ignoring Validation Warnings
♦ Never create alerts when status shows ✗ (red) or ⚠️ (yellow)
♦ Fix all errors first: dates in order, budget = 100%, valid wave structure
♦ Common issues: dates in future, Point C above B (longs) or below B (shorts)
Premature Manual Entries
♦ Don't enter just because price touched the level
♦ Wait for ALL ✓✓✓✓✓ (or ✓✓✓✓✓✓) to align in Trade Plan table
♦ Patience pays - partial confluence = partial edge = higher risk of losing trades
Wrong Timeframe Selection
♦ Avoid: 15m, 5m, 1m (too much noise, false signals)
♦ Use: 1H, 4H, Daily (cleaner structure, better confluence)
♦ Lower timeframes require faster decisions and produce more whipsaws
Over-Risking Capital
♦ Trade budget ≠ Account size
♦ Never risk capital you can't afford to lose
♦ One bad trade should NOT destroy your account
───────────────────────────────────────────
✅ LIVERMORE PRINCIPLES IN ACTION
Confirmation > Prediction
♦ Don't predict where price will go
♦ Wait for price to INDICATE direction via pivots + volume + trend
♦ Test first (BO 20%), build only when confirmed (POs 80%)
💬 "A man must believe in himself and his judgment if he expects to make a living at this game."
Pyramid on Strength, Never Weakness
♦ Add only when: 3 closes + clean candles + volume + pivot breaks
♦ Never average down (DCA into losers)
♦ If BO wrong, take small loss fast - don't hope and add more
💬 "Never buy a stock because it has had a big decline from its previous high."
Respect Market Structure
♦ Pivots = where smart money previously acted (support/resistance)
♦ Breaking them = momentum overcoming barriers
♦ Entering before pivot break = entering into known rejection zones
Trend is Your Friend
♦ Never pyramid against the trend
♦ If trend shifts to Uncertain or reverses → no new entries
♦ Exit when trend proves you wrong (don't fight it)
💬 "I never argue with the tape. Getting sore at the market doesn't get you anywhere."
Discipline > Emotion
♦ Can't "almost" have all conditions met
♦ Either 100% aligned (all ✓) or you wait
♦ No exceptions, no "this time is different"
♦ Automation designed to help remove emotion - consider using 3Commas
💬 "It never was my thinking that made the big money for me. It always was my sitting."
───────────────────────────────────────────
🎯 FINAL THOUGHT
This indicator is a SYSTEMATIC FRAMEWORK, not a magic solution. It translates Livermore's century-old principles into actionable rules:
♦ Test small, build big
♦ Add to winners, cut losers fast
♦ Let structure guide exits
♦ Stay disciplined when emotions scream
The market will test your patience, discipline, and conviction. The indicator aims to reduce guesswork - but YOU still need to:
♦ Find valid wave structures
♦ Choose appropriate market conditions
♦ Size positions properly
♦ Accept losses as part of the game
💬 "The game of speculation is the most uniformly fascinating game in the world. But it is not a game for the stupid, the mentally lazy, the person of inferior emotional balance, or the get-rich-quick adventurer."
— Jesse Livermore

TrendPredator PROThe TrendPredator PRO
Stacey Burke, a seasoned trader and mentor, developed his trading system over the years, drawing insights from influential figures such as George Douglas Taylor, Tony Crabel, Steve Mauro, and Robert Schabacker. His popular system integrates select concepts from these experts into a consistent framework. While powerful, it remains highly discretionary, requiring significant real-time analysis, which can be challenging for novice traders.
The TrendPredator indicators support this approach by automating the essential analysis required to trade the system effectively and incorporating mechanical bias and a multi-timeframe concept. They provide value to traders by significantly reducing the time needed for session preparation, offering all relevant chart analysis and signals for live trading in real-time.
The PRO version offers an advanced pattern identification logic that highlights developing context as well as setups related to the constellation of the signals provided. It provides real-time interpretation of the multi-timeframe analysis table, following an extensive underlying logic with more than 150 different setup variations specifically developed for the system and indicator. These setups are constantly back- and forward-tested and updated according to the results. This version is tailored to traders primarily trading this system and following the related setups in detail.
The former TrendPredator ES version does not provide that option. It is significantly leaner and is designed for traders who want to use the multi-timeframe logic as additional confluence for their trading style. It is very well suited to support many other trading styles, including SMC and ICT.
The Multi-timeframe Master Pattern
Inspired by Taylor’s 3-day cycle and Steve Mauro’s work with “Beat the Market Maker,” Burke’s system views markets as cyclical, driven by the manipulative patterns of market makers. These patterns often trap traders at the extremes of moves above or below significant levels with peak formations, then reverse to utilize their liquidity, initiating the next phase. Breakouts away from these traps often lead to range expansions, as described by Tony Crabel and Robert Schabacker. After multiple consecutive breakouts, especially after the psychological number three, overextension might develop. A break in structure may then lead to reversals or pullbacks. The TrendPredator Indicator and the related multi-timeframe trading system are designed to track these cycles on the daily timeframe and provide signals and trade setups to navigate them.
Bias Logic and Multi-Timeframe Concept
The indicator covers the basic signals of Stacey Burke's system:
- First Red Day (FRD): Bearish break in structure, signalling weak longs in the market.
- First Green Day (FGD): Bullish break in structure signalling weak shorts in the markt.
- Three Days of Longs (3DL): Overextension signalling potential weak longs in the market.
- Three Days of Shorts (3DS): Overextension signalling potential weak shorts in the market.
- Inside Day (ID): Contraction, signalling potential impulsive reversal or range expansion move.
It enhances the original system by introducing:
Structured Bias Logic:
Tracks bias by following how price trades concerning the last previous candle high or low that was hit. For example if the high was hit, we are bullish above and bearish below.
- Bullish state: Breakout (BO), Fakeout Low (FOL)
- Bearish state: Breakdown (BD), Fakeout High (FOH)
Multi-Timeframe Perspective:
- Tracks all signals across H4, H8, D, W, and M timeframes, to look for alignment and follow trends and momentum in a mechanical way.
Developing Context:
- Identifies specific predefined context states based on the monthly, weekly and daily bias.
Developing Setups:
- Identifies specific predefined setups based on context and H8 bias as well as SB signals.
The indicator monitors the bias and signals of the system across all relevant timeframes and automates the related graphical chart analysis as well as context and setup zone identification. In addition to the master pattern, the system helps to identify the higher timeframe situation and follow the moves driven by other timeframe traders to then identify favourable context and setup situations for the trader.
Example: Full Bullish Cycle on the Daily Timeframe with Multi-Timeframe Signals
- The Trap/Peak Formation
The market breaks down from a previous day’s and maybe week’s low—potentially after multiple breakdowns—but fails to move lower and pulls back up to form a peak formation low and closes as a first green day.
MTF Signals: Bullish daily and weekly fakeout low; three consecutive breakdown days (1W Curr FOL, 1D Curr FOL, BO 3S).
Context: Reversal (REV)
Setup: Fakeout low continuation low of day (FOL Cont LOD)
- Pullback and Consolidation
The next day pulls further up after first green day signal, potentially consolidates inside the previous day’s range.
MTF Signals: Fakeout low and first green day closing as an inside day (1D Curr IS, Prev FOL, First G).
Context: Reversal continuation (REV Cont)
Setup: Previous fakeout low continuation low handing fruit (Prev FOL Cont LHF)
- Range Expansion/Trend
The following day breaks up through the previous day’s high, launching a range expansion away from the trap.
MTF Signals: Bullish daily breakout of an inside day (1D Curr BO, Prev IS).
Context: Uptrend healthy (UT)
Setup: Breakout continuation low hanging fruit (BO Cont LHF)
- Overextension
After multiple consecutive breakouts, the market reaches a state of overextension, signalling a possible reversal or pullback.
MTF Signals: Three days of breakout longs (1D Curr BO, Prev BO, BO 3L).
Context: Uptrend extended (UT)
- Reversal
After a breakout of previous days high that fails, price pulls away from the high showing a rollover of momentum across all timeframes and a potential short setup.
MTF Signals: Three days of breakout longs, daily fakeout high (1D 3L, FOH)
Context: Reversal countertrend (REV)
Setup: Fakeout high continuation high of day (FOH Cont HOD)
Note: This is only one possible illustrative scenario; there are many variations and combinations.
Example Chart: Full Bullish Cycle with Correlated Signals
Multi-Timeframe Signals examples:
Context and Setups examples:
Note: The signals shown along the move are manually added illustrations. The indicator shows these in realtime in the table at top and bottom right. This is only one possible scenario; there are many variations and combinations.
Due to the fractal nature of markets, this cycle can be observed across all timeframes. The strongest setups occur when there is multi-timeframe alignment. For example, a peak formation and potential reversal on the daily timeframe have higher probability and follow-through when they align with bearish signals on higher timeframes (e.g., weekly/monthly BD/FOH) and confirmation on lower timeframes (H4/H8 FOH/BD). With this perspective, the system enables the trader to follow the trend and momentum while identifying rollover points in a highly differentiated and precise way.
Using the Indicator for Trading
The automated analysis provided by the indicator can be used for thesis generation in preparation for a session as well as for live trading, leveraging the real-time updates as well as the context and setup indicated or alerted. It is recommended to customize the settings deeply, such as hiding the lower timeframes for thesis generation or the specific alert time window and settings to the specific trading schedule and playbook of the trader.
1. Context Assessment:
Evaluate alignment of higher timeframes (e.g., Month/Week, Week/Day). More alignment → Stronger setups.
- The context table offers an interpretation of the higher timeframe automatically. See below for further details.
2. Setup Identification:
Follow the bias of daily and H8 timeframes. A setup mostly requires alignment of these.
Setup Types:
- Trend Trade: Trade in alignment with the previous day’s trend.
Example: Price above the previous day’s high → Focus on long setups (dBO, H8 FOL) until overextension or reversal signs appear (H8 BO 3L, First R).
- Reversal Trade: Identify reversal setups when lower timeframes show rollovers after higher timeframe weakness.
Example: Price below the previous day’s high → Look for reversal signals at the current high of day (H8 FOH, BO 3L, First R).
- The setup table shows potential setups for the specific price zone in the table automatically. See below for further details.
3. Entry Confirmation:
Confirm entries based on H8 and H4 alignment, candle closes and lower timeframe fakeouts.
- H8 and H4 should always align for a final confirmation, meaning the breach lines should be both in the back of a potential trade setup.
- M15/ 5 candle close can be seen as acceptance beyond a level or within the setup zone.
- M15/5 FOH/ FOL signals lower timeframe traps potentially indicating further confirmation.
Example Chart Reversal Trade:
Context: REV (yellow), Reversal counter trend, Month in FOL with bearish First R, Week in BO but bearishly overextended with BO 3L, Day in Fakeout high reversing bearishly.
Setup: FOH Cont HOD (red), Day in Fakeout high after BO 3L overextension, confirmed by H8 FOH high of day, First R as further confluence. Two star quality and countertrend.
Entry: H4 BD, M15 close below followed by M15 FOH.
Detailed Features and Options
1. Context and Setup table
The Context and Setup Table is the core feature of the TrendPredator PRO indicator. It delivers real-time interpretation of the multi-timeframe analysis based on an extensive underlying logic table with over 150 variations, specifically developed for this system and indicator. This logic is continuously updated and optimized to ensure accuracy and performance.
1.1. Developing Context
States for developing higher timeframe context are determined based on signals from the monthly, weekly, and daily timeframes.
- Green and Red indicate alignment and potentially interesting developing setups.
- Yellow signals a mixed or conflicting bias, suggesting caution when taking trades.
The specific states are:
- UT (yellow): Uptrend extended
- UT (green): Uptrend healthy
- REV (yellow): Reversal day counter trend
- REV (green): Reversal day mixed trend
- REV Cont (green): Reversal continuation mixed trend
- REV Cont (yellow): Reversal continuation counter trend
- REV into UT (green): Reversal day into uptrend
- REV Cont into UT (green): Reversal continuation into uptrend
- UT Pullback (yellow): Counter uptrend breakdown day
- Conflicting (yellow): Conflicting signals
- Consolidating (yellow): Consolidating sideways
- Inside (yellow): Trading inside after an inside week
- DT Pullback (yellow): Counter downtrend breakout day
- REV Cont into DT (red): Reversal continuation into downtrend
- REV into DT (red): Reversal day into downtrend
- REV Cont (yellow): Reversal continuation counter trend
- REV Cont (red): Reversal continuation mixed trend
- REV (red): Reversal day mixed trend
- REV (yellow): Reversal day countertrend
- DT (red): Downtrend healthy
- DT (yellow): Downtrend extended
Example: Uptrend
The Uptrend Context (UT, green) indicates a healthy uptrend with all timeframes aligning bullishly. In this case, the monthly is in a Fakeout Low (FOL) and currently inside the range, while the weekly and daily are both in Breakout (BO) states. This context is favorable for developing long setups in the direction of the trend.
Example: Uptrend pullback
The Uptrend Pullback Context (UT Pullback, yellow) indicates a Breakdown (BD) on the daily timeframe against a higher timeframe uptrend. In this case, the monthly is in a Fakeout Low (FOL) and currently inside its range, the weekly is in Breakout (BO) and also currently inside, while the daily is in Breakdown (BD). This context reflects a conflicting situation—potentially signaling either an early reversal back into the uptrend or, if the breakdown extends, the beginning of a possible trend change.
Example: Reversal into Uptrend
The Reversal into Uptrend Context (REV into UT, green) indicates a lower timeframe reversal aligning with a higher timeframe uptrend. In this case, the monthly is in Breakout (BO), the weekly is in Breakout (BO) and currently inside its range, while the daily is showing a bullish Fakeout Low (FOL) reversal. This context is potentially very favorable for long setups, as it signals a strong continuation of the uptrend supported across multiple timeframes.
Example: Reversal
The Bearish Reversal Context indicates a lower timeframe rollover within an ongoing higher timeframe uptrend. In this case, the monthly remains in Breakout (BO), the weekly has shifted into a Fakeout High (FOH) after three weeks of breakout longs, and the daily is already in Breakdown (BD). This context suggests a potentially favorable developing short setup, as early signs of weakness appear across timeframes.
1.2. Developing Setup
The states for specific setups are based on the context and the signals from the daily timeframe and H8, indicating that price is in the zone of alignment. The setup description refers to the state of the daily timeframe, while the suffix relates to the H8 timeframe. For example, "prev FOH Cont LHF" means that the previous day is in FOH (Fakeout High) relative to yesterday's breakout level, currently trading inside, and we are in an H8 breakdown, indicating a potential LHF (Lower High Formation) short trade if the entry confirms. The suffix HOD means that H8 is in FOH or BO (Breakout).
The specific states are:
- REV HOD (red): Reversal high of day
- REV Cont LHF (red): Reversal continuation low hanging fruit
- BO Cont LHF (green): Breakout continuation low hanging fruit
- BO Cont LOD (green): Breakout continuation low of day
- FOH Cont HOD (red): Fakeout high continuation high of day
- FOH Cont LHF ((red): Fakeout high continuation low hanging fruit
- prev BD Cont HOD (red): Previous breakdown continuation high of day
- prev BD Cont LHF (red): Previous breakdown continuation low hanging fruit
- prev FOH Cont HOD (red): Previous fakeout high continuation high of day
- prev FOH Cont LHF (red): Previous fakeout high continuation low hanging fruit
- prev FOL Cont LOD (green): Previous fakeout low continuation low of day
- prev FOL Cont LHF (green): Previous fakeout low continuation low hanging fruit
- prev BO Cont LOD (green): Previous breakout continuation low of day
- prev BO Cont LHF (green): Previous breakout continuation low hanging fruit
- FOL Cont LHF (green): Fakeout low continuation low hanging fruit
- FOL Cont LOD (green): Fakeout low continuation low of day
- BD Cont LHF (red): BD continuation low hanging fruit
- BD Cont LOD (red): Breakdown continuation low of day
- REV Cont LHF (green): Reversal continuation low hanging fruit
- REV LOD (green): Reversal low of day
- Inside: Trading inside after an inside day
Type: Indicates the situation of the indicated setup concerning:
- Trend: Following higher timeframe trend
- Mixed: Mixed higher timeframe signals
- Counter: Against higher timeframe bias
Quality: Indicates the quality of the indicated setup according to the specified logic table
No star: Very low quality
* One star: Low quality
** Two star: Medium quality
*** Three star: High quality
Example: Breakout Continuation Trend Setup
This setup highlights a healthy uptrend where the month is in a breakout, the week is in a fakeout low, and the day is in a breakout after a first green day. As the H8 breaks out to the upside, a long setup zone is triggered, presenting a breakout continuation low-hanging fruit trade. This is a trend trade in an overextended situation on the H8, with an H8 3L, resulting in an overall quality rating of one star.
Example: Fakeout Low Continuation Trend Setup
This setup shows a reversal into uptrend, with the month in a breakout, the week in a breakout, and the day in a fakeout low after breaking down the previous day and now reversing back up. As H8 breaks out to the upside, a long setup zone is triggered, presenting a previous fakeout low continuation, low-hanging fruit trade. This is a medium-quality trend trade.
Example: Reversal Setup - Mixed Trend
This setup shows a reversal setup in line with the weekly trend, with the month in a fakeout low, the week in a fakeout high, and the day in a fakeout high after breaking out earlier in the day and now reversing back down. As H8 loses the previous breakout level after 3 breakouts (with H8 3L), a short setup zone is triggered, presenting a fakeout high continuation at the high of the day. This is a high-quality trade in a mixed trend situation.
Setup Alerts:
Alerts can be activated for setups freshly triggered on the chart within your trading window.
Detailed filter logic for setup alerts:
- Setup quality: 1-3 star
- Setup type: Counter, Mixed and Trend
- Setup category: e.g. Reversal Bearish, Breakout, Previous Fakeout High
- 1D BO and First signals: 3DS, 3DL, FRD, FGD, ID
Options:
- Alerts on/ off
- Alert time window (from/ to)
- Alert filter customization
Note: To activate alerts from a script in TradingView, some settings need to be adjusted. Open the "Create Alert" dialog and select the option "Any alert() function call" in the "Condition" section. Choose "TrendPredator PRO" to ensure that alerts trigger properly from the code. Alerts can be activated for entire watchlists or individual pairs. Once activated, the alerts run in the background and notify the user whenever a setup is freshly triggered according to the filter settings.
2. Multi-Timeframe Table
Provides a real-time view of system signals, including:
Current Timeframe (Curr): Bias states.
- Breakout (green BO): Bullish after breaking above the previous high.
- Fakeout High (red FOH): Bearish after breaking above the previous high but pulling back down.
- Breakdown (red BD): Bearish after breaking below the previous low.
- Fakeout Low (green FOL): Bullish after breaking below the previous low but pulling back up.
- Inside (IS): Price trading neutral inside the previous range, taking the previous bias (color indicates the previous bias).
Previous Timeframe (Prev): Tracks last candle bias state and transitions dynamically.
- Bias for last candle: BO, FOH, BD, FOL in respective colors.
- Inside bar (yellow IS): Indicated as standalone signal.
Note: Also previous timeframes get constantly updated in real time to track the bias state in relation to the level that was hit. This means a BO can still lose the level and become a FOH, and vice versa, and a BD can still become a FOL, and vice versa. This is critical to see for example if traders that are trapped in that timeframe with a FOH or FOL are released. An inside bar stays fixed, though, since no level was hit in that timeframe.
Breakouts (BO): Breakout count 3 longs and 3 shorts.
- 3 Longs (red 3L): Bearish after three breakouts without hitting a previous low.
- 3 Shorts (green 3S): Bullish after three breakdowns without hitting a previous high.
First Countertrend Close (First): Tracks First Red or Green Day.
- First Green (G): After two consecutive red closes.
- First Red (R): After two consecutive green closes.
Options: Customizable font size and label colors.
3. Historic Highs and Lows
Displays historic highs and lows per timeframe for added context, enabling users to track sequences over time.
Timeframes: H4, H8, D, W, M
Options: Customize for timeframes shown, number of historic candles per timeframe, colors, formats, and labels.
4. Previous High and Low Extensions
Displays extended previous levels (high, low, and close) for each timeframe to assess how price trades relative to these levels.
H4: P4H, P4L, P4C
H8: P8H, P8L, P8C
Daily: PDH, PDL, PDC
Weekly: PWH, PWL, PWC
Monthly: PMH, PML, PMC
Options: Fully customizable for timeframes shown, colors, formats, and labels.
5. Breach Lines
Tracks live market reactions (e.g., breakouts or fakeouts) per timeframe for the last previous high or low that was hit, highlighting these levels originating at the breached candle to indicate bias (color-coded).
Red: Bearish below
Green: Bullish above
H4: 4FOL, 4FOH, 4BO, 4BD
H8: 8FOL, 8FOH, 8BO, 8BD
D: dFOL, dFOH, dBO, dBD
W: wFOL, wFOH, wBO, wBD
M: mFOL, mFOH, mBO, mBD
Options: Fully customizable for timeframes shown, colors, formats, and labels.
Overall Options:
Toggle single feature groups on/off.
Customize H8 open/close time as an offset to UTC to be provider independent.
Colour settings con be adjusted for dark or bright backgrounds.
Higher Timeframe Use Case Examples
Example Use Case: Weekly Template Analysis
The Weekly Template is a core concept in Stacey Burke’s trading style. The analysis is conducted on the daily timeframe, focusing on the higher timeframe bias and identifying overextended conditions within the week—such as multiple breakouts and peak formations signaling potential reversals.
In this example, the candles are colored by the TrendPredator FO indicator, which highlights the state of individual candles. This allows for precise evaluation of both the trend state and the developing weekly template. It is a valuable tool for thesis generation before a trading session and for backtesting purposes.
Example Use Case: High Timeframe 5-Star Setup Analysis (Stacey Burke "ain't coming back" ACB Template)
This analysis identifies high-probability trade opportunities when daily breakout or breakdown closes occur near key monthly levels mid-week, signaling overextensions and potentially large parabolic moves. The key signal to look for is a breakout or breakdown close on a Wednesday. This is useful for thesis generation before a session and also for backtesting.
In this example, the TrendPredator FO indicator colors the candles to highlight individual candle states, particularly those that close in breakout or breakdown. Additionally, an indicator is shown on the chart shading every Wednesday, making it easier to visually identify the signals.
5 Star Alerts:
Alerts can be activated for this potential 5-Star setup constellation. The alert is triggered when there is a breakout or breakdown close on a Wednesday.
Further recommendations:
- Higher timeframe context: TPO or volume profile indicators can be used to gain an even better overview.
- Late session trading: Entries later in the session, such as during the 3rd hour of the NY session, offer better analysis and follow-through on setups.
- Entry confirmation: Momentum indicators like VWAP, Supertrend, or EMA are helpful for increasing precision. Additionally, tracking lower timeframe fakeouts can provide powerful confluence. To track those the TrendPredator Fakeout Highlighter (FO), that has been specifically developed for this can be of great help:
Limitations:
Data availability using TradingView has its limitations. The indicator leverages only the real-time data available for the specific timeframe being used. This means it cannot access data from timeframes lower than the one displayed on the chart. For example, if you are on a daily chart, it cannot use H8 data. Additionally, on very low timeframes, the historical availability of data might be limited, making higher timeframe signals unreliable.
To address this, the indicator automatically hides the affected columns in these specific situations, preventing false signals.
Disclaimer
This indicator is for educational purposes only and does not guarantee profits.
None of the information provided shall be considered financial advice.
The indicator does not provide final buy or sell signals but highlights zones for potential setups.
Users are fully responsible for their trading decisions and outcomes.

[TehThomas] - Market Structure Shift (MSS)
- Market Structure Shift (MSS) Script Overview
This TradingView script is designed to help traders identify Market Structure Shifts (MSS) and Breaks of Structure (BOS), which are key concepts in ICT (Inner Circle Trader) and Smart Money Concepts (SMC) trading. By detecting significant shifts in price action, the script provides visual cues and alerts to help traders spot potential trend changes and continuation patterns.
How the Script Works
1. Identifying Swing Highs & Lows
The script detects swing highs and swing lows based on a pivot strength setting (default: 3).
A swing high forms when a candle’s high is higher than the highs of a set number of candles on both sides.
A swing low forms when a candle’s low is lower than the lows of the surrounding candles.
2. Market Structure Shift (MSS) Detection
A bullish MSS occurs when price closes above the most recent swing high after previously being in a bearish trend.
A bearish MSS occurs when price closes below the most recent swing low after being in a bullish trend.
This signals a potential trend reversal and is often a key area for liquidity grabs and smart money entry points.
3. Break of Structure (BOS) Detection (Optional - Can be enabled/disabled in settings)
A BOS is detected when price continues in the direction of the trend, confirming a structural break rather than a shift.
Bullish BOS: Price breaks a swing high but does not reverse (confirms trend continuation).
Bearish BOS: Price breaks a swing low but continues downward.
BOS levels help traders confirm trend strength and potential trade continuation setups.
4. Drawing Structure Lines & Labels
The script plots horizontal lines at the detected MSS and BOS levels.
Labels such as "MSS" or "BOS" appear at the breakout points.
Traders can customize the line style, color, and text size for better visibility.
5. Alert System for MSS & BOS
The script includes alert conditions that notify traders when an MSS or BOS occurs.
Alerts can be set for:
Any MSS / Any BOS
Bullish MSS / Bullish BOS
Bearish MSS / Bearish BOS
Settings You Can Change
The script allows for full customization through the following input parameters:
Pivot Strength (pivot_strength)
Default: 4
Adjusts how many candles must be considered to form a valid swing high or low.
Higher values result in stronger structure points, while lower values detect short-term movements.
Color Settings
Highs Color (highs) → Default: Blue (for bullish structure)
Lows Color (lows) → Default: Red (for bearish structure)
Toggle Display Options
Show BOS (show_bos) → Enables/disables BOS detection.
Show MSS (show_mss) → Enables/disables MSS detection.
Line & Label Customization
BOS Line Style (bos_style) → Options: Solid, Dashed, Dotted
MSS Line Style (mss_style) → Options: Solid, Dashed, Dotted
BOS & MSS Line Width → Adjustable from 1 to 4 pixels
BOS & MSS Text Size → Options: Tiny, Small, Normal, Large, Huge
BOS & MSS Text Position → Options: Left, Center, Right
Why This Script is Useful
✔ Detects Key Market Structure Changes
MSS and BOS are critical for identifying trend reversals and trend continuations.
Helps traders avoid false breakouts by distinguishing between structural shifts and simple breakouts.
✔ Enhances Smart Money Trading Strategies
MSS often aligns with liquidity grabs before price reverses.
BOS confirms continuation trades in strong trends.
Works well with Fair Value Gaps (FVGs), Order Blocks (OBs), and Liquidity Zones.
✔ Customizable Alerts & Visuals
Traders can enable alerts for MSS and BOS to receive notifications when price shifts.
Adjustable styling ensures clarity across different trading setups.
✔ Works on Any Asset & Timeframe
Suitable for Forex, Crypto, Stocks, and Indices.
Can be used on lower timeframes (scalping) or higher timeframes (swing trading).
How to Use the Market Structure Shift Concept in Trading
1️⃣ Identify Market Conditions
Apply the script and check if price is forming Higher Highs (HH), Higher Lows (HL), Lower Highs (LH), or Lower Lows (LL).
Determine if the market is trending or ranging.
2️⃣ Watch for MSS (Reversal Signals)
Bullish MSS: Price closes above a key swing high → potential bullish reversal.
Bearish MSS: Price closes below a swing low → potential bearish reversal.
3️⃣ Confirm BOS (Trend Continuation Signals)
Bullish BOS: Price continues breaking highs, confirming an uptrend.
Bearish BOS: Price continues breaking lows, confirming a downtrend.
4️⃣ Combine with Other ICT & SMC Concepts
Look for Order Blocks (OBs) and Fair Value Gaps (FVGs) near MSS/BOS levels for better trade entries.
Wait for liquidity grabs before entering trades (avoid stop hunts).
Use higher timeframe MSS/BOS zones as key support & resistance areas.
Final Thoughts
This script is a must-have tool for traders using ICT & SMC trading strategies. It helps identify trend shifts, liquidity grabs, and continuation moves by marking Market Structure Shifts (MSS) and Breaks of Structure (BOS) on the chart.

SMC Structures and FVGสวัสดีครับ! ผมจะอธิบายอินดิเคเตอร์ "SMC Structures and FVG + MACD" ที่คุณให้มาอย่างละเอียดในแต่ละส่วน เพื่อให้คุณเข้าใจการทำงานของมันอย่างถ่องแท้ครับ
อินดิเคเตอร์นี้เป็นการผสมผสานแนวคิดของ Smart Money Concept (SMC) ซึ่งเน้นการวิเคราะห์โครงสร้างตลาด (Market Structure) และ Fair Value Gap (FVG) เข้ากับอินดิเคเตอร์ MACD เพื่อใช้เป็นตัวกรองหรือตัวยืนยันสัญญาณ Choch/BoS (Change of Character / Break of Structure)
1. ภาพรวมอินดิเคเตอร์ (Overall Purpose)
อินดิเคเตอร์นี้มีจุดประสงค์หลักคือ:
ระบุโครงสร้างตลาด: ตีเส้นและป้ายกำกับ Choch (Change of Character) และ BoS (Break of Structure) บนกราฟโดยอัตโนมัติ
ผสานการยืนยันด้วย MACD: สัญญาณ Choch/BoS จะถูกพิจารณาก็ต่อเมื่อ MACD Histogram เกิดการตัดขึ้นหรือลง (Zero Cross) ในทิศทางที่สอดคล้องกัน
แสดง Fair Value Gap (FVG): หากเปิดใช้งาน จะมีการตีกล่อง FVG บนกราฟ
แสดงระดับ Fibonacci: คำนวณและแสดงระดับ Fibonacci ที่สำคัญตามโครงสร้างตลาดปัจจุบัน
ปรับตาม Timeframe: การคำนวณและการแสดงผลทั้งหมดจะปรับตาม Timeframe ที่คุณกำลังใช้งานอยู่โดยอัตโนมัติ
2. ส่วนประกอบหลักของโค้ด (Code Breakdown)
โค้ดนี้สามารถแบ่งออกเป็นส่วนหลัก ๆ ได้ดังนี้:
2.1 Inputs (การตั้งค่า)
ส่วนนี้คือตัวแปรที่คุณสามารถปรับแต่งได้ในหน้าต่างการตั้งค่าของอินดิเคเตอร์ (คลิกที่รูปฟันเฟืองข้างชื่ออินดิเคเตอร์บนกราฟ)
MACD Settings (ตั้งค่า MACD):
fast_len: ความยาวของ Fast EMA สำหรับ MACD (ค่าเริ่มต้น 12)
slow_len: ความยาวของ Slow EMA สำหรับ MACD (ค่าเริ่มต้น 26)
signal_len: ความยาวของ Signal Line สำหรับ MACD (ค่าเริ่มต้น 9)
= ta.macd(close, fast_len, slow_len, signal_len): คำนวณค่า MACD Line, Signal Line และ Histogram โดยใช้ราคาปิด (close) และค่าความยาวที่กำหนด
is_bullish_macd_cross: ตรวจสอบว่า MACD Histogram ตัดขึ้นเหนือเส้น 0 (จากค่าลบเป็นบวก)
is_bearish_macd_cross: ตรวจสอบว่า MACD Histogram ตัดลงใต้เส้น 0 (จากค่าบวกเป็นลบ)
Fear Value Gap (FVG) Settings:
isFvgToShow: (Boolean) เปิด/ปิดการแสดง FVG บนกราฟ
bullishFvgColor: สีสำหรับ Bullish FVG
bearishFvgColor: สีสำหรับ Bearish FVG
mitigatedFvgColor: สีสำหรับ FVG ที่ถูก Mitigate (ลดทอน) แล้ว
fvgHistoryNbr: จำนวน FVG ย้อนหลังที่จะแสดง
isMitigatedFvgToReduce: (Boolean) เปิด/ปิดการลดขนาด FVG เมื่อถูก Mitigate
Structures (โครงสร้างตลาด) Settings:
isStructBodyCandleBreak: (Boolean) หากเป็น true การ Break จะต้องเกิดขึ้นด้วย เนื้อเทียน ที่ปิดเหนือ/ใต้ Swing High/Low หากเป็น false แค่ไส้เทียนทะลุก็ถือว่า Break
isCurrentStructToShow: (Boolean) เปิด/ปิดการแสดงเส้นโครงสร้างตลาดปัจจุบัน (เส้นสีน้ำเงินในภาพตัวอย่าง)
pivot_len: ความยาวของแท่งเทียนที่ใช้ในการมองหาจุด Pivot (Swing High/Low) ยิ่งค่าน้อยยิ่งจับ Swing เล็กๆ ได้, ยิ่งค่ามากยิ่งจับ Swing ใหญ่ๆ ได้
bullishBosColor, bearishBosColor: สีสำหรับเส้นและป้าย BOS ขาขึ้น/ขาลง
bosLineStyleOption, bosLineWidth: สไตล์ (Solid, Dotted, Dashed) และความหนาของเส้น BOS
bullishChochColor, bearishChochColor: สีสำหรับเส้นและป้าย CHoCH ขาขึ้น/ขาลง
chochLineStyleOption, chochLineWidth: สไตล์ (Solid, Dotted, Dashed) และความหนาของเส้น CHoCH
currentStructColor, currentStructLineStyleOption, currentStructLineWidth: สี, สไตล์ และความหนาของเส้นโครงสร้างตลาดปัจจุบัน
structHistoryNbr: จำนวนการ Break (Choch/BoS) ย้อนหลังที่จะแสดง
Structure Fibonacci (จากโค้ดต้นฉบับ):
เป็นชุด Input สำหรับเปิด/ปิด, กำหนดค่า, สี, สไตล์ และความหนาของเส้น Fibonacci Levels ต่างๆ (0.786, 0.705, 0.618, 0.5, 0.382) ที่จะถูกคำนวณจากโครงสร้างตลาดปัจจุบัน
2.2 Helper Functions (ฟังก์ชันช่วยทำงาน)
getLineStyle(lineOption): ฟังก์ชันนี้ใช้แปลงค่า String ที่เลือกจาก Input (เช่น "─", "┈", "╌") ให้เป็นรูปแบบ line.style_ ที่ Pine Script เข้าใจ
get_structure_highest_bar(lookback): ฟังก์ชันนี้พยายามหา Bar Index ของแท่งเทียนที่ทำ Swing High ภายในช่วง lookback ที่กำหนด
get_structure_lowest_bar(lookback): ฟังก์ชันนี้พยายามหา Bar Index ของแท่งเทียนที่ทำ Swing Low ภายในช่วง lookback ที่กำหนด
is_structure_high_broken(...): ฟังก์ชันนี้ตรวจสอบว่าราคาปัจจุบันได้ Break เหนือ _structureHigh (Swing High) หรือไม่ โดยพิจารณาจาก _highStructBreakPrice (ราคาปิดหรือราคา High ขึ้นอยู่กับการตั้งค่า isStructBodyCandleBreak)
FVGDraw(...): ฟังก์ชันนี้รับ Arrays ของ FVG Boxes, Types, Mitigation Status และ Labels มาประมวลผล เพื่ออัปเดตสถานะของ FVG (เช่น ถูก Mitigate หรือไม่) และปรับขนาด/ตำแหน่งของ FVG Box และ Label บนกราฟ
2.3 Global Variables (ตัวแปรทั่วทั้งอินดิเคเตอร์)
เป็นตัวแปรที่ประกาศด้วย var ซึ่งหมายความว่าค่าของมันจะถูกเก็บไว้และอัปเดตในแต่ละแท่งเทียน (persists across bars)
structureLines, structureLabels: Arrays สำหรับเก็บอ็อบเจกต์ line และ label ของเส้น Choch/BoS ที่วาดบนกราฟ
fvgBoxes, fvgTypes, fvgLabels, isFvgMitigated: Arrays สำหรับเก็บข้อมูลของ FVG Boxes และสถานะต่างๆ
structureHigh, structureLow: เก็บราคาของ Swing High/Low ที่สำคัญของโครงสร้างตลาดปัจจุบัน
structureHighStartIndex, structureLowStartIndex: เก็บ Bar Index ของจุดเริ่มต้นของ Swing High/Low ที่สำคัญ
structureDirection: เก็บสถานะของทิศทางโครงสร้างตลาด (1 = Bullish, 2 = Bearish, 0 = Undefined)
fiboXPrice, fiboXStartIndex, fiboXLine, fiboXLabel: ตัวแปรสำหรับเก็บข้อมูลและอ็อบเจกต์ของเส้น Fibonacci Levels
isBOSAlert, isCHOCHAlert: (Boolean) ใช้สำหรับส่งสัญญาณ Alert (หากมีการตั้งค่า Alert ไว้)
2.4 FVG Processing (การประมวลผล FVG)
ส่วนนี้จะตรวจสอบเงื่อนไขการเกิด FVG (Bullish FVG: high < low , Bearish FVG: low > high )
หากเกิด FVG และ isFvgToShow เป็น true จะมีการสร้าง box และ label ใหม่เพื่อแสดง FVG บนกราฟ
มีการจัดการ fvgBoxes และ fvgLabels เพื่อจำกัดจำนวน FVG ที่แสดงตาม fvgHistoryNbr และลบ FVG เก่าออก
ฟังก์ชัน FVGDraw จะถูกเรียกเพื่ออัปเดตสถานะของ FVG (เช่น การถูก Mitigate) และปรับการแสดงผล
2.5 Structures Processing (การประมวลผลโครงสร้างตลาด)
Initialization: ที่ bar_index == 0 (แท่งเทียนแรกของกราฟ) จะมีการกำหนดค่าเริ่มต้นให้กับ structureHigh, structureLow, structureHighStartIndex, structureLowStartIndex
Finding Current High/Low: highest, highestBar, lowest, lowestBar ถูกใช้เพื่อหา High/Low ที่สุดและ Bar Index ของมันใน 10 แท่งล่าสุด (หรือทั้งหมดหากกราฟสั้นกว่า 10 แท่ง)
Calculating Structure Max/Min Bar: structureMaxBar และ structureMinBar ใช้ฟังก์ชัน get_structure_highest_bar และ get_structure_lowest_bar เพื่อหา Bar Index ของ Swing High/Low ที่แท้จริง (ไม่ใช่แค่ High/Low ที่สุดใน lookback แต่เป็นจุด Pivot ที่สมบูรณ์)
Break Price: lowStructBreakPrice และ highStructBreakPrice จะเป็นราคาปิด (close) หรือราคา Low/High ขึ้นอยู่กับ isStructBodyCandleBreak
isStuctureLowBroken / isStructureHighBroken: เงื่อนไขเหล่านี้ตรวจสอบว่าราคาได้ทำลาย structureLow หรือ structureHigh หรือไม่ โดยพิจารณาจากราคา Break, ราคาแท่งก่อนหน้า และ Bar Index ของจุดเริ่มต้นโครงสร้าง
Choch/BoS Logic (ส่วนสำคัญที่ถูกผสานกับ MACD):
if(isStuctureLowBroken and is_bearish_macd_cross): นี่คือจุดที่ MACD เข้ามามีบทบาท หากราคาทำลาย structureLow (สัญญาณขาลง) และ MACD Histogram เกิด Bearish Zero Cross (is_bearish_macd_cross เป็น true) อินดิเคเตอร์จะพิจารณาว่าเป็น Choch หรือ BoS
หาก structureDirection == 1 (เดิมเป็นขาขึ้น) หรือ 0 (ยังไม่กำหนด) จะตีเป็น "CHoCH" (เปลี่ยนทิศทางโครงสร้างเป็นขาลง)
หาก structureDirection == 2 (เดิมเป็นขาลง) จะตีเป็น "BOS" (ยืนยันโครงสร้างขาลง)
มีการสร้าง line.new และ label.new เพื่อวาดเส้นและป้ายกำกับ
structureDirection จะถูกอัปเดตเป็น 1 (Bullish)
structureHighStartIndex, structureLowStartIndex, structureHigh, structureLow จะถูกอัปเดตเพื่อกำหนดโครงสร้างใหม่
else if(isStructureHighBroken and is_bullish_macd_cross): เช่นกันสำหรับขาขึ้น หากราคาทำลาย structureHigh (สัญญาณขาขึ้น) และ MACD Histogram เกิด Bullish Zero Cross (is_bullish_macd_cross เป็น true) อินดิเคเตอร์จะพิจารณาว่าเป็น Choch หรือ BoS
หาก structureDirection == 2 (เดิมเป็นขาลง) หรือ 0 (ยังไม่กำหนด) จะตีเป็น "CHoCH" (เปลี่ยนทิศทางโครงสร้างเป็นขาขึ้น)
หาก structureDirection == 1 (เดิมเป็นขาขึ้น) จะตีเป็น "BOS" (ยืนยันโครงสร้างขาขึ้น)
มีการสร้าง line.new และ label.new เพื่อวาดเส้นและป้ายกำกับ
structureDirection จะถูกอัปเดตเป็น 2 (Bearish)
structureHighStartIndex, structureLowStartIndex, structureHigh, structureLow จะถูกอัปเดตเพื่อกำหนดโครงสร้างใหม่
การลบเส้นเก่า: d.delete_line (หากไลบรารีทำงาน) จะถูกเรียกเพื่อลบเส้นและป้ายกำกับเก่าออกเมื่อจำนวนเกิน structHistoryNbr
Updating Structure High/Low (else block): หากไม่มีการ Break เกิดขึ้น แต่ราคาปัจจุบันสูงกว่า structureHigh หรือต่ำกว่า structureLow ในทิศทางที่สอดคล้องกัน (เช่น ยังคงเป็นขาขึ้นและทำ High ใหม่) structureHigh หรือ structureLow จะถูกอัปเดตเพื่อติดตาม High/Low ที่สุดของโครงสร้างปัจจุบัน
Current Structure Display:
หาก isCurrentStructToShow เป็น true อินดิเคเตอร์จะวาดเส้น structureHighLine และ structureLowLine เพื่อแสดงขอบเขตของโครงสร้างตลาดปัจจุบัน
Fibonacci Display:
หาก isFiboXToShow เป็น true อินดิเคเตอร์จะคำนวณและวาดเส้น Fibonacci Levels ต่างๆ (0.786, 0.705, 0.618, 0.5, 0.382) โดยอิงจาก structureHigh และ structureLow ของโครงสร้างตลาดปัจจุบัน
Alerts:
alertcondition: ใช้สำหรับตั้งค่า Alert ใน TradingView เมื่อเกิดสัญญาณ BOS หรือ CHOCH
plot(na):
plot(na) เป็นคำสั่งที่สำคัญในอินดิเคเตอร์ที่ไม่ได้ต้องการพล็อต Series ของข้อมูลบนกราฟ (เช่น ไม่ได้พล็อตเส้น EMA หรือ RSI) แต่ใช้วาดอ็อบเจกต์ (Line, Label, Box) โดยตรง
การมี plot(na) ช่วยให้ Pine Script รู้ว่าอินดิเคเตอร์นี้มีเอาต์พุตที่แสดงผลบนกราฟ แม้ว่าจะไม่ได้เป็น Series ที่พล็อตตามปกติก็ตาม
3. วิธีใช้งาน
คัดลอกโค้ดทั้งหมด ที่อยู่ในบล็อก immersive ด้านบน
ไปที่ TradingView และเปิดกราฟที่คุณต้องการ
คลิกที่เมนู "Pine Editor" ที่อยู่ด้านล่างของหน้าจอ
ลบโค้ดเดิมที่มีอยู่ และ วางโค้ดที่คัดลอกมา ลงไปแทน
คลิกที่ปุ่ม "Add to Chart"
อินดิเคเตอร์จะถูกเพิ่มลงในกราฟของคุณโดยอัตโนมัติ คุณสามารถคลิกที่รูปฟันเฟืองข้างชื่ออินดิเคเตอร์บนกราฟเพื่อเข้าถึงหน้าต่างการตั้งค่าและปรับแต่งตามความต้องการของคุณได้
Hello! I will explain the "SMC Structures and FVG + MACD" indicator you provided in detail, section by section, so you can fully understand how it works.This indicator combines the concepts of Smart Money Concept (SMC), which focuses on analyzing Market Structure and Fair Value Gaps (FVG), with the MACD indicator to serve as a filter or confirmation for Choch (Change of Character) and BoS (Break of Structure) signals.1. Overall PurposeThe main purposes of this indicator are:Identify Market Structure: Automatically draw lines and label Choch (Change of Character) and BoS (Break of Structure) on the chart.Integrate MACD Confirmation: Choch/BoS signals will only be considered when the MACD Histogram performs a cross (Zero Cross) in the corresponding direction.Display Fair Value Gap (FVG): If enabled, FVG boxes will be drawn on the chart.Display Fibonacci Levels: Calculate and display important Fibonacci levels based on the current market structure.Adapt to Timeframe: All calculations and displays will automatically adjust to the timeframe you are currently using.2. Code BreakdownThis code can be divided into the following main sections:2.1 Inputs (Settings)This section contains variables that you can adjust in the indicator's settings window (click the gear icon next to the indicator's name on the chart).MACD Settings:fast_len: Length of the Fast EMA for MACD (default 12)slow_len: Length of the Slow EMA for MACD (default 26)signal_len: Length of the Signal Line for MACD (default 9) = ta.macd(close, fast_len, slow_len, signal_len): Calculates the MACD Line, Signal Line, and Histogram using the closing price (close) and the specified lengths.is_bullish_macd_cross: Checks if the MACD Histogram crosses above the 0 line (from negative to positive).is_bearish_macd_cross: Checks if the MACD Histogram crosses below the 0 line (from positive to negative).Fear Value Gap (FVG) Settings:isFvgToShow: (Boolean) Enables/disables the display of FVG on the chart.bullishFvgColor: Color for Bullish FVG.bearishFvgColor: Color for Bearish FVG.mitigatedFvgColor: Color for FVG that has been mitigated.fvgHistoryNbr: Number of historical FVG to display.isMitigatedFvgToReduce: (Boolean) Enables/disables reducing the size of FVG when mitigated.Structures (โครงสร้างตลาด) Settings:isStructBodyCandleBreak: (Boolean) If true, the break must occur with the candle body closing above/below the Swing High/Low. If false, a wick break is sufficient.isCurrentStructToShow: (Boolean) Enables/disables the display of the current market structure lines (blue lines in the example image).pivot_len: Lookback length for identifying Pivot points (Swing High/Low). A smaller value captures smaller, more frequent swings; a larger value captures larger, more significant swings.bullishBosColor, bearishBosColor: Colors for bullish/bearish BOS lines and labels.bosLineStyleOption, bosLineWidth: Style (Solid, Dotted, Dashed) and width of BOS lines.bullishChochColor, bearishChochColor: Colors for bullish/bearish CHoCH lines and labels.chochLineStyleOption, chochLineWidth: Style (Solid, Dotted, Dashed) and width of CHoCH lines.currentStructColor, currentStructLineStyleOption, currentStructLineWidth: Color, style, and width of the current market structure lines.structHistoryNbr: Number of historical breaks (Choch/BoS) to display.Structure Fibonacci (from original code):A set of inputs to enable/disable, define values, colors, styles, and widths for various Fibonacci Levels (0.786, 0.705, 0.618, 0.5, 0.382) that will be calculated from the current market structure.2.2 Helper FunctionsgetLineStyle(lineOption): This function converts the selected string input (e.g., "─", "┈", "╌") into a line.style_ format understood by Pine Script.get_structure_highest_bar(lookback): This function attempts to find the Bar Index of the Swing High within the specified lookback period.get_structure_lowest_bar(lookback): This function attempts to find the Bar Index of the Swing Low within the specified lookback period.is_structure_high_broken(...): This function checks if the current price has broken above _structureHigh (Swing High), considering _highStructBreakPrice (closing price or high price depending on isStructBodyCandleBreak setting).FVGDraw(...): This function takes arrays of FVG Boxes, Types, Mitigation Status, and Labels to process and update the status of FVG (e.g., whether it's mitigated) and adjust the size/position of FVG Boxes and Labels on the chart.2.3 Global VariablesThese are variables declared with var, meaning their values are stored and updated on each bar (persists across bars).structureLines, structureLabels: Arrays to store line and label objects for Choch/BoS lines drawn on the chart.fvgBoxes, fvgTypes, fvgLabels, isFvgMitigated: Arrays to store FVG box data and their respective statuses.structureHigh, structureLow: Stores the price of the significant Swing High/Low of the current market structure.structureHighStartIndex, structureLowStartIndex: Stores the Bar Index of the start point of the significant Swing High/Low.structureDirection: Stores the status of the market structure direction (1 = Bullish, 2 = Bearish, 0 = Undefined).fiboXPrice, fiboXStartIndex, fiboXLine, fiboXLabel: Variables to store data and objects for Fibonacci Levels.isBOSAlert, isCHOCHAlert: (Boolean) Used to trigger alerts in TradingView (if alerts are configured).2.4 FVG ProcessingThis section checks the conditions for FVG formation (Bullish FVG: high < low , Bearish FVG: low > high ).If FVG occurs and isFvgToShow is true, a new box and label are created to display the FVG on the chart.fvgBoxes and fvgLabels are managed to limit the number of FVG displayed according to fvgHistoryNbr and remove older FVG.The FVGDraw function is called to update the FVG status (e.g., whether it's mitigated) and adjust its display.2.5 Structures ProcessingInitialization: At bar_index == 0 (the first bar of the chart), structureHigh, structureLow, structureHighStartIndex, and structureLowStartIndex are initialized.Finding Current High/Low: highest, highestBar, lowest, lowestBar are used to find the highest/lowest price and its Bar Index of it in the last 10 bars (or all bars if the chart is shorter than 10 bars).Calculating Structure Max/Min Bar: structureMaxBar and structureMinBar use get_structure_highest_bar and get_structure_lowest_bar functions to find the Bar Index of the true Swing High/Low (not just the highest/lowest in the lookback but a complete Pivot point).Break Price: lowStructBreakPrice and highStructBreakPrice will be the closing price (close) or the Low/High price, depending on the isStructBodyCandleBreak setting.isStuctureLowBroken / isStructureHighBroken: These conditions check if the price has broken structureLow or structureHigh, considering the break price, previous bar prices, and the Bar Index of the structure's starting point.Choch/BoS Logic (Key Integration with MACD):if(isStuctureLowBroken and is_bearish_macd_cross): This is where MACD plays a role. If the price breaks structureLow (bearish signal) AND the MACD Histogram performs a Bearish Zero Cross (is_bearish_macd_cross is true), the indicator will consider it a Choch or BoS.If structureDirection == 1 (previously bullish) or 0 (undefined), it will be labeled "CHoCH" (changing structure direction to bearish).If structureDirection == 2 (already bearish), it will be labeled "BOS" (confirming bearish structure).line.new and label.new are used to draw the line and label.structureDirection will be updated to 1 (Bullish).structureHighStartIndex, structureLowStartIndex, structureHigh, structureLow will be updated to define the new structure.else if(isStructureHighBroken and is_bullish_macd_cross): Similarly for bullish breaks. If the price breaks structureHigh (bullish signal) AND the MACD Histogram performs a Bullish Zero Cross (is_bullish_macd_cross is true), the indicator will consider it a Choch or BoS.If structureDirection == 2 (previously bearish) or 0 (undefined), it will be labeled "CHoCH" (changing structure direction to bullish).If structureDirection == 1 (already bullish), it will be labeled "BOS" (confirming bullish structure).line.new and label.new are used to draw the line and label.structureDirection will be updated to 2 (Bearish).structureHighStartIndex, structureLowStartIndex, structureHigh, structureLow will be updated to define the new structure.Deleting Old Lines: d.delete_line (if the library works) will be called to delete old lines and labels when their number exceeds structHistoryNbr.Updating Structure High/Low (else block): If no break occurs, but the current price is higher than structureHigh or lower than structureLow in the corresponding direction (e.g., still bullish and making a new high), structureHigh or structureLow will be updated to track the highest/lowest point of the current structure.Current Structure Display:If isCurrentStructToShow is true, the indicator draws structureHighLine and structureLowLine to show the boundaries of the current market structure.Fibonacci Display:If isFiboXToShow is true, the indicator calculates and draws various Fibonacci Levels (0.786, 0.705, 0.618, 0.5, 0.382) based on the structureHigh and structureLow of the current market structure.Alerts:alertcondition: Used to set up alerts in TradingView when BOS or CHOCH signals occur.plot(na):plot(na) is an important statement in indicators that do not plot data series directly on the chart (e.g., not plotting EMA or RSI lines) but instead draw objects (Line, Label, Box).Having plot(na) helps Pine Script recognize that this indicator has an output displayed on the chart, even if it's not a regularly plotted series.3. How to UseCopy all the code in the immersive block above.Go to TradingView and open your desired chart.Click on the "Pine Editor" menu at the bottom of the screen.Delete any existing code and paste the copied code in its place.Click the "Add to Chart" button.The indicator will be added to your chart automatically. You can click the gear icon next to the indicator's name on the chart to access the settings window and customize it to your needs.I hope this explanation helps you understand this indicator in detail. If anything is unclear, or you need further adjustments, please let me know.

ENIGMA 369 ENIGMA 369 is a unique Pine Script indicator that combines two complementary trading systems: Break of Structure (BOS) Detection and Session-Based Sniper Signals.
Designed to help traders identify market structure shifts and potential intraday setups, it overlays on the chart to highlight key levels and momentum-driven opportunities. The indicator’s originality lies in its integration of pattern-based BOS analysis (inspired by Smart Money concepts) with time- and trend-filtered Sniper signals, creating a cohesive tool for both swing and intraday trading.
Unlike standalone breakout or scalping indicators, ENIGMA 369 uses:
BOS Logic: A specific two-candle pattern sequence to detect structural shifts, filtered by ATR for significance.
Sniper Logic: Momentum-based signals during high-volatility sessions, optionally aligned with EMA trends.
This synergy allows traders to assess market direction strategically (via BOS) and time entries tactically (via Sniper), all within one indicator.
What It Does
ENIGMA 369 performs two distinct functions:
Break of Structure (BOS) Detection:
Identifies potential support/resistance levels using BullBear (bullish candle followed by bearish) and BearBull (bearish followed by bullish) candle pairs.
Confirms breakouts when price sustains above (bullish) or below (bearish) these levels for a set number of bars.
Draws horizontal lines at confirmed breakout levels, which persist until price crosses a user-defined buffer zone.
Sniper Momentum Signals:
Detects buy/sell setups during user-specified trading sessions (e.g., London/US), based on candle momentum (close relative to midpoint, higher highs/lower lows).
Optionally filters signals with an EMA to align with the broader trend.
Plots lines at the candle’s high/low and 50% wick levels, serving as reference points for entries or stops, removed when price crosses them.
How It Works
ENIGMA 369 relies on price action, market timing, and trend context to generate signals. Here’s how each component operates:
BOS Logic:
Pattern Detection: Scans for two-candle patterns where the first candle is significant (size exceeds an ATR-based threshold) and the second opposes it. For example, a BullBear pair marks the first candle’s high as a potential resistance.
ATR Filter: Uses the Average True Range (default: 14 periods) to ensure the first candle’s range or body is substantial, reducing noise. Users can adjust the ATR multiplier (default: 0.5).
Confirmation: Requires price to close above/below the stored level for a user-defined number of bars (default: 1) to confirm a breakout.
Line Management: Plots green (bullish) or red (bearish) lines at confirmed levels, extending for a set number of bars (default: 10). Lines are deleted if price crosses a buffer (percentage of price or ATR-based, default: 0.1).
Visualization: Optionally highlights pattern candles with transparent green/red backgrounds.
Sniper Logic:
Momentum Signals: Identifies buy signals when a candle closes above its midpoint (high+low)/2 and has a lower low than the prior candle, indicating potential bullish momentum. Sell signals require a close below the midpoint and a higher high.
Session Filter: Limits signals to user-defined London/US session hours (default: 1-23 UTC, adjustable to specific hours like 7-11 UTC for London).
EMA Filter: Optionally uses a 50-period EMA (adjustable) to ensure buy signals occur in uptrends (rising EMA) and sell signals in downtrends (falling EMA).
Line Plotting: Draws blue lines for buy signals (at the low and 50% of the lower wick) and orange lines for sell signals (at the high and 50% of the upper wick). Lines extend right until price crosses them, managed via arrays for efficiency.
Dynamic Removal: Lines are automatically deleted when price breaches them, reflecting changing market conditions.
Why Combine BOS and Sniper?
The integration of BOS and Sniper logic is purposeful and synergistic:
BOS provides a strategic view by identifying structural shifts, helping traders understand the market’s directional bias (e.g., bullish after a confirmed high breakout).
Sniper offers tactical entry points within these trends, focusing on high-volatility sessions where momentum is likely to drive clear moves.
Together, they enable traders to align short-term trades with long-term structure, reducing the risk of trading against the trend. For example, a trader can wait for a bullish BOS confirmation before taking Sniper buy signals, enhancing setup reliability.
This combination is original because it merges Smart Money-inspired BOS detection with a session-based momentum system, a pairing not commonly found in single indicators. It avoids redundant mashups by ensuring each component serves a distinct yet complementary role.
How to Use It
Setup:
Apply ENIGMA 369 to a TradingView chart (Pine Script v5). The chart shown here uses a clean H1 candlestick setup to highlight BOS and Sniper outputs clearly.
Customize settings:
BOS:
ATR Period (default: 14), Min Candle Size (default: 0.5x ATR): Adjust for pattern sensitivity.
Confirmation Bars (default: 1): Set for faster/slower breakouts.
Buffer Type (Percentage/ATR), Buffer Zone Value (default: 0.1): Control line deletion.
Show Lines (default: true), Highlight Candle Pairs (default: false): Enable visuals.
Customize line colors (green/red) and width/length.
Sniper:
London/US Start/End Hours: Set to match your asset’s volatility (e.g., 7-11 UTC for London forex).
EMA Filter (default: true), EMA Period (default: 50): Enable for trend alignment.
Customize line styles (Solid/Dotted/Dashed) and colors (blue/orange) to distinguish from BOS.
Suggested timeframes: H1-H4 for BOS (swing trading), M5-M15 for Sniper (intraday).
Trading with BOS:
Monitor for green (bullish) or red (bearish) lines indicating confirmed breakouts.
Use lines as support/resistance:
Bullish BOS: Consider longs above the line, with stops below the line or buffer.
Bearish BOS: Consider shorts below the line, with stops above the line or buffer.
Line deletion signals a potential reversal or level invalidation.
Trading with Sniper:
Look for blue (buy) or orange (sell) lines during active sessions:
Buy: Enter long at the low or 50% wick line, with stops below the low and targets at resistance.
Sell: Enter short at the high or 50% wick line, with stops above the high and targets at support.
Use EMA filter to avoid counter-trend signals.
Lines disappear when crossed, indicating the setup’s completion or invalidation.
Alerts:
Set alerts for:
“Bullish/Bearish BOS Confirmed” for structural shifts.
“Sniper Buy/Sell Alert” for intraday setups.
Combine with volume, key levels, or news for confirmation.
Best Practices:
Use BOS to confirm trend direction before taking Sniper signals.
Test settings on your asset/timeframe via backtesting.
Apply stop-losses and risk-reward ratios (e.g., 1:2) for discipline.
The chart example shows BOS lines (green/red) and Sniper lines (blue/orange) on an H1 chart, ensuring clarity.
Underlying Concepts
Market Structure (BOS): Identifies turning points where supply/demand shifts, using two-candle patterns to mark significant levels, similar to order block concepts.
Momentum and Timing (Sniper): Targets entries during high-liquidity sessions, using candle midpoint and wick analysis to capture momentum-driven moves.
Trend Context: EMA ensures signals align with the market’s direction, reducing false positives.
Price Action: Both systems rely on raw price behavior, avoiding lagging oscillators for timely signals.
Limitations
BOS may lag in fast markets; reduce confirmation bars for scalping.
Sniper signals depend on session settings; ensure alignment with your asset’s volatility.
Multiple lines may clutter charts; adjust colors/styles for clarity.
Not a standalone system; combine with other analysis for best results.
Disclaimer
ENIGMA 369 is a tool to identify potential trading setups, not a guaranteed profit system. Past performance does not predict future results. Backtest thoroughly and use with proper risk management.
Conclusion
ENIGMA 369 offers a structured approach to trading by combining BOS’s structural insights with Sniper’s precise, session-based entries. Its unique integration makes it suitable for traders seeking to align strategic and tactical decisions. Customize it to your style, test it rigorously, and use it to enhance your market analysis.

Smart Money Concept [TradingFinder] Major OB + FVG + Liquidity🔵 Introduction
"Smart Money" refers to funds under the control of institutional investors, central banks, funds, market makers, and other financial entities. Ordinary people recognize investments made by those who have a deep understanding of market performance and possess information typically inaccessible to regular investors as "Smart Money".
Consequently, when market movements often diverge from expectations, traders identify the footprints of smart money. For example, when a classic pattern forms in the market, traders take short positions. However, the market might move upward instead. They attribute this contradiction to smart money and seek to capitalize on such inconsistencies in their trades.
The "Smart Money Concept" (SMC) is one of the primary styles of technical analysis that falls under the subset of "Price Action". Price action encompasses various subcategories, with one of the most significant being "Supply and Demand", in which SMC is categorized.
The SMC method aims to identify trading opportunities by emphasizing the impact of large traders (Smart Money) on the market, offering specific patterns, techniques, and trading strategies.
🟣 Key Terms of Smart Money Concept (SMC)
• Market Structure (Trend)
• Change of Character (ChoCh)
• Break of Structure (BoS)
• Order Blocks (Supply and Demand)
• Imbalance (IMB)
• Inefficiency (IFC)
• Fair Value Gap (FVG)
• Liquidity
• Premium and Discount
🔵 How Does the "Smart Money Concept Indicator" Work?
🟣 Market Structure
a. Accumulation
b. Market-Up
c. Distribution
d. Market-Down
a) Accumulation Phase : During the accumulation period, typically following a downtrend, smart money enters the market without significantly affecting the pricing trend.
b) Market-Up Phase : In this phase, the price of an asset moves upward from the accumulation range and begins to rise. Usually, the buying by retail investors is the main driver of this trend, and due to positive market sentiment, it continues.
c) Distribution Phase : The distribution phase, unlike the accumulation stage, occurs after an uptrend. In this phase, smart money attempts to exit the market without causing significant price fluctuations.
d) Market-Down Phase : In this stage, the price of an asset moves downward from the distribution phase, initiating a prolonged downtrend. Smart money liquidates all its positions by creating selling pressure, trapping latecomer investors.
The result of these four phases in the market becomes the market trend.
Types of Trends in Financial Markets :
a. Up-Trend
b. Down Trend
c. Range (No Trend)
a) Up-Trend : The market breaks consecutive highs.
b) Down Trend : The market breaks consecutive lows.
c) No Trend or Range : The market oscillates within a range without breaking either highs or lows.
🟣 Change of Character (ChoCh)
The "ChoCh" or "Change of Character" pattern indicates an initial change in order flow in financial markets. This structural change occurs when a major pivot in the opposite direction of the market trend fails. It signals a potential change in the market trend and can serve as a signal for short-term or long-term trend changes in a trading symbol.
🟣 Break of Structure (BoS)
The "BoS" or "Break of Structure" pattern indicates the continuation of the trend in financial markets. This structure forms when, in an uptrend, the price breaks its ceiling or, in a downtrend, the price breaks its floor.
🟣 Order Blocks (Supply and Demand)
Order blocks consist of supply and demand areas where the likelihood of price reversal is higher. There are six order blocks in this indicator, categorized based on their origin and formation reasons.
a. Demand Main Zone, "ChoCh" Origin.
b. Demand Sub Zone, "ChoCh" Origin.
c. Demand All Zone, "BoS" Origin.
d. Supply Main Zone, "ChoCh" Origin.
e. Supply Sub Zone, "ChoCh" Origin.
f. Supply All Zone, "BoS" Origin.
🟣 FVG | Inefficiency | Imbalance
These three terms are almost synonymous. They describe the presence of gaps between consecutive candle shadows. This inefficiency occurs when the market moves rapidly. Primarily, imbalances and these rapid movements stem from the entry of smart money and the imbalance between buyer and seller power. Therefore, identifying these movements is crucial for traders.
These areas are significant because prices often return to fill these gaps or even before they occur to fill price gaps.
🟣 Liquidity
Liquidity zones are areas where there is a likelihood of congestion of stop-loss orders. Liquidity is considered the driving force of the entire market, and market makers may manipulate the market using these zones. However, in many cases, this does not happen because there is insufficient liquidity in some areas.
Types of Liquidity in Financial Markets :
a. Trend Lines
b. Double Tops | Double Bottoms
c. Triple Tops | Triple Bottoms
d. Support Lines | Resistance Lines
All four types of liquidity in this indicator are automatically identified.
🟣 Premium and Discount
Premium and discount zones can assist traders in making better decisions. For instance, they may sell positions in expensive ranges and buy in cheaper ranges. The closer the price is to the major resistance, the more expensive it is, and the closer it is to the major support, the cheaper it is.
🔵 How to Use
🟣 Change of Character (ChoCh) and Break of Structure (BoS)
This indicator detects "ChoCh" and "BoS" in both Minor and Major states. You can turn on the display of these lines by referring to the last part of the settings.
🟣 Order Blocks (Supply and Demand)
Order blocks are Zones where the probability of price reversal is higher. In demand Zones you can buy opportunities and in supply Zones you can check sell opportunities.
The "Refinement" feature allows you to adjust the width of the order block according to your strategy. There are two modes, "Aggressive" and "Defensive," in the "Order Block Refine". The difference between "Aggressive" and "Defensive" lies in the width of the order block.
For risk-averse traders, the "Defensive" mode is suitable as it provides a lower loss limit and a greater reward-to-risk ratio. For risk-taking traders, the "Aggressive" mode is more appropriate. These traders prefer to enter trades at higher prices, and this mode, which has a wider order block width, is more suitable for this group of individuals.
🟣 Fair Value Gap (FVG) | Imbalance (IMB) | Inefficiency (IFC)
In order to identify the "fair value gap" on the chart, it must be analyzed candle by candle. In this process, it is important to pay attention to candles with a large size, and a candle and a candle should be examined before that.
Candles before and after this central candle should have long shadows and their bodies should not overlap with the central candle body. The distance between the shadows of the first and third candles is known as the FVG range.
These areas work in two ways :
• Supply and demand area : In this case, the price reacts to these areas and the trend is reversed.
• Liquidity zone : In this scenario, the price "fills" the zone and then reaches the order block.
Important note : In most cases, the FVG zone of very small width acts as a supply and demand zone, while the zone of significant width acts as a liquidity zone and absorbs price.
When the FVG filter is activated, the FVG regions are filtered based on the specified algorithm.
FVG filter types include the following :
1. Very Aggressive Mode : In addition to the initial condition, an additional condition is considered. For bullish FVG, the maximum price of the last candle must be greater than the maximum price of the middle candle.
Similarly, for a bearish FVG, the minimum price of the last candle must be lower than the minimum price of the middle candle. This mode removes the minimum number of FVGs.
2. Aggressive : In addition to the very aggressive condition, the size of the middle candle is also considered. The size of the center candle should not be small and therefore more FVGs are removed in this case.
3. Defensive : In addition to the conditions of the very aggressive mode, this mode also considers the size of the middle pile, which should be relatively large and make up the majority of the body.
Also, to identify bullish FVGs, the second and third candles must be positive, while for bearish FVGs, the second and third candles must be negative. This mode filters out a significant number of FVGs and keeps only those of good quality.
4. Very Defensive : In addition to the conditions of the defensive mode, in this mode the first and third candles should not be very small-bodied doji candles. This mode filters out most FVGs and only the best quality ones remain.
🟣 Liquidity
These levels are where traders intend to exit their trades. "Market makers" or smart money usually accumulate or distribute their trading positions near these levels, where many retail traders have placed their "stop loss" orders. When liquidity is collected from these losses, the price often reverses.
A "Stop hunt" is a move designed to offset liquidity generated by established stop losses. Banks often use major news events to trigger stop hunts and capture liquidity released into the market. For example, if they intend to execute heavy buy orders, they encourage others to sell through stop-hots.
Consequently, if there is liquidity in the market before reaching the order block area, the validity of that order block is higher. Conversely, if the liquidity is close to the order block, that is, the price reaches the order block before reaching the liquidity limit, the validity of that order block is lower.
🟣 Alert
With the new alert functionality in this indicator, you won't miss any important trading signals. Alerts are activated when the price hits the last order block.
1. It is possible to set alerts for each "symbol" and "time frame". The system will automatically detect both and include them in the warning message.
2. Each alert provides the exact date and time it was triggered. This helps you measure the timeliness of the signal and evaluate its relevance.
3. Alerts include target order block price ranges. The "Proximal" level represents the initial price level strike, while the "Distal" level represents the maximum price gap in the block. These details are included in the warning message.
4. You can customize the alert name through the "Alert Name" entry.
5. Create custom messages for "long" and "short" alerts to be sent with notifications.
🔵 Setting
a. Pivot Period of Order Blocks Detector :
Using this parameter, you can set the zigzag period that is formed based on the pivots.
b. Order Blocks Validity Period (Bar) :
You can set the validity period of each Order Block based on the number of candles that have passed since the origin of the Order Block.
c. Demand Main Zone, "ChoCh" Origin :
You can control the display or not display as well as the color of Demand Main Zone, "ChoCh" Origin.
d. Demand Sub Zone, "ChoCh" Origin :
You can control the display or not display as well as the color of Demand Sub Zone, "ChoCh" Origin.
e. Demand All Zone, "BoS" Origin :
You can control the display or not display as well as the color of Demand All Zone, "BoS" Origin.
f. Supply Main Zone, "ChoCh" Origin :
You can control the display or not display as well as the color of Supply Main Zone, "ChoCh" Origin.
g. Supply Sub Zone, "ChoCh" Origin :
You can control the display or not display as well as the color of Supply Sub Zone, "ChoCh" Origin.
h. Supply All Zone, "BoS" Origin :
You can control the display or not display as well as the color of Supply All Zone, "BoS" Origin.
i. Refine Demand Main : You can choose to be refined or not and also the type of refining.
j. Refine Demand Sub : You can choose to be refined or not and also the type of refining.
k. Refine Demand BoS : You can choose to be refined or not and also the type of refining.
l. Refine Supply Main : You can choose to be refined or not and also the type of refining.
m. Refine Supply Sub : You can choose to be refined or not and also the type of refining.
n. Refine Supply BoS : You can choose to be refined or not and also the type of refining.
o. Show Demand FVG : You can choose to show or not show Demand FVG.
p. Show Supply FVG : You can choose to show or not show Supply FVG
q. FVG Filter : You can choose whether FVG is filtered or not. Also specify the type of filter you want to use.
r. Show Statics High Liquidity Line : Show or not show Statics High Liquidity Line.
s. Show Statics Low Liquidity Line : Show or not show Statics Low Liquidity Line.
t. Show Dynamics High Liquidity Line : Show or not show Dynamics High Liquidity Line.
u. Show Dynamics Low Liquidity Line : Show or not show Dynamics Low Liquidity Line.
v. Statics Period Pivot :
Using this parameter, you can set the Swing period that is formed based on Static Liquidity Lines.
w. Dynamics Period Pivot :
Using this parameter, you can set the Swing period that is formed based Dynamics Liquidity Lines.
x. Statics Liquidity Line Sensitivity :
is a number between 0 and 0.4. Increasing this number decreases the sensitivity of the "Statics Liquidity Line Detection" function and increases the number of lines identified. The default value is 0.3.
y. Dynamics Liquidity Line Sensitivity :
is a number between 0.4 and 1.95. Increasing this number increases the sensitivity of the "Dynamics Liquidity Line Detection" function and decreases the number of lines identified. The default value is 1.
z. Alerts Name : You can customize the alert name using this input and set it to your desired name.
aa. Alert Demand Main Mitigation :
If you want to receive the alert about Demand Main 's mitigation after setting the alerts, leave this tick on. Otherwise, turn it off.
bb. Alert Demand Sub Mitigation :
If you want to receive the alert about Demand Sub's mitigation after setting the alerts, leave this tick on. Otherwise, turn it off.
cc. Alert Demand BoS Mitigation :
If you want to receive the alert about Demand BoS's mitigation after setting the alerts, leave this tick on. Otherwise, turn it off.
dd. Alert Supply Main Mitigation :
If you want to receive the alert about Supply Main's mitigation after setting the alerts, leave this tick on. Otherwise, turn it off.
ee. Alert Supply Sub Mitigation :
If you want to receive the alert about Supply Sub's mitigation after setting the alerts, leave this tick on. Otherwise, turn it off.
ff. Alert Supply BoS Mitigation :
If you want to receive the alert about Supply BoS's mitigation after setting the alerts, leave this tick on. Otherwise, turn it off.
gg. Message Frequency :
This parameter, represented as a string, determines the frequency of announcements. Options include: 'All' (triggers the alert every time the function is called), 'Once Per Bar' (triggers the alert only on the first call within the bar), and 'Once Per Bar Close' (activates the alert only during the final script execution of the real-time bar upon closure). The default setting is 'Once per Bar'.
hh. Show Alert time by Time Zone :
The date, hour, and minute displayed in alert messages can be configured to reflect any chosen time zone. For instance, if you prefer London time, you should input 'UTC+1'. By default, this input is configured to the 'UTC' time zone.
ii. Display More Info : The 'Display More Info' option provides details regarding the price range of the order blocks (Zone Price), along with the date, hour, and minute. If you prefer not to include this information in the alert message, you should set it to 'Off'.
You also have access to display or not to display, choose the Style and Color of all the lines below :
a. Major Bullish "BoS" Lines
b. Major Bearish "BoS" Lines
c. Minor Bullish "BoS" Lines
d. Minor Bearish "BoS" Lines
e. Major Bullish "ChoCh" Lines
f. Major Bearish "ChoCh" Lines
g. Minor Bullish "ChoCh" Lines
h. Minor Bearish "ChoCh" Lines
i. Last Major Support Line
j. Last Major Resistance Line
k. Last Minor Support Line
l. Last Minor Resistance Line

Smart Structure Breaks & Order BlocksOverview (What it does)
The indicator “Smart Structure Breaks & Order Blocks” detects market structure using swing highs and lows, identifies Break of Structure (BOS) events, and automatically draws order blocks (OBs) from the origin candle. These zones extend to the right and change color/outline when mitigated or invalidated. By formalizing and automating part of discretionary analysis, it provides consistent zone recognition.
Main Components
Swing Detection: ta.pivothigh/ta.pivotlow identify confirmed swing points.
BOS Detection: Determines if the recent swing high/low is broken by close (strict mode) or crossover.
OB Creation: After a BOS, the opposite candle (bearish for bullish BOS, bullish for bearish BOS) is used to generate an order block zone.
Zone Management: Limits the number of zones, extends them to the right, and tracks tagged (mitigated) or invalidated states.
Input Parameters
Left/Right Pivot (default 6/6): Number of bars required on each side to confirm a swing. Higher values = smoother swings.
Max Zones (default 4): Maximum zones stored per direction (bull/bear). Oldest zones are overwritten.
Zone Confirmation Lookback (default 3): Ensures OB origin candle validity by checking recent highs/lows.
Show Swing Points (default ON): Displays triangles on swing highs/lows.
Require close for BOS? (default ON): Strict BOS (close required) vs loose BOS (line crossover).
Use candle body for zones (default OFF): Zones drawn from candle body (ON) or wick (OFF).
Signal Definition & Logic
Swing Updates: Latest confirmed pivots update lastHighLevel / lastLowLevel.
BOS (Break of Structure):
Bullish – close breaks last swing high.
Bearish – close breaks last swing low.
Only one valid BOS per swing (avoids duplicates).
OB Detection:
Bullish BOS → previous bearish candle with lowest low forms the OB.
Bearish BOS → previous bullish candle with highest high forms the OB.
Zones: Bull = green, Bear = red, semi-transparent, extended to the right.
Zone States:
Mitigated: Price touches the zone → border highlighted.
Invalidated:
Bull zone → close below → turns red.
Bear zone → close above → turns green.
Chart Appearance
Swing High: red triangle above bar
Swing Low: green triangle below bar
Bull OB: green zone (border highlighted on touch)
Bear OB: red zone (border highlighted on touch)
Invalid Zones: Bull zones turn reddish, Bear zones turn greenish
Practical Use (Trading Assistance)
Trend Following Entries: Buy pullbacks into green OBs in uptrends, sell rallies into red OBs in downtrends.
Focus on First Touch: First mitigation after BOS often has higher reaction probability.
Confluence: Combine with higher timeframe trend, volume, session levels, key price levels (previous highs/lows, VWAP, etc.).
Stops/Targets:
Bull – stop below zone, partial take profit at swing high or resistance.
Bear – stop above zone, partial take profit at swing low or support.
Parameter Tuning (per market/timeframe)
Pivot (6/6 → 4/4/8/8): Lower for scalping (3–5), medium for day trading (5–8), higher for swing trading (8–14). Increase to reduce noise.
Strict Break: ON to reduce false breaks in ranging markets; OFF for earlier signals.
Body Zones: ON for assets with long wicks, OFF for cleaner OBs in liquid instruments.
Zone Confirmation (default 3): Increase for stricter OB origin, fewer zones.
Max Zones (default 4 → 6–10): Increase for higher volatility, decrease to avoid clutter.
Strengths
Standardizes BOS and OB detection that is usually subjective.
Tracks mitigation and invalidation automatically.
Adaptable: allows body/wick zone switching for different instruments.
Limitations
Pivot-based: Signals appear only after pivots confirm (slight lag).
Zones reflect past balance: Can fail after new events (news, earnings, macro data).
Range-heavy markets: More false BOS; consider stricter settings.
Backtesting: This script is for drawing/visual aid; trading rules must be defined separately.
Workflow Example
Identify higher timeframe trend (4H/Daily).
On lower TF (15–60m), wait for BOS and new OB.
Enter on first mitigation with confirmation candle.
Stop beyond zone; targets based on R multiples and swing points.
FAQ
Q: Why are zones invalidated quickly?
A: Flow reversal after BOS. Adjust pivots higher, enable Strict mode, or switch to Body zones to reduce noise.
Q: What does “tagged” mean?
A: Price touched the zone once = mitigated. Implies some orders in that zone may have been filled.
Q: Body or Wick zones?
A: Wick zones are fine in clean markets. For volatile pairs with long wicks, body zones provide more realistic areas.
Customization Tips (Code perspective)
Zone storage: Currently ring buffer ((idx+1) % zoneLimit). Could prioritize keeping unmitigated zones.
Automated testing: Add strategy.entry/exit for rule-based backtests.
Multi-timeframe: Use request.security() for higher timeframe swings/BOS.
Visualization: Add labels for BOS bars, tag zones with IDs, count touches.
Summary
This indicator formalizes the cycle Swing → BOS → OB creation → Mitigation/Invalidation, providing consistent structure analysis and zone tracking. By tuning sensitivity and strictness, and combining with higher timeframe context, it enhances pullback/continuation trading setups. Always combine with proper risk management.

FVG Radar [Mr_Rakun]The FVG Radar indicator is designed to automatically detect Fair Value Gaps (FVG) on your TradingView chart. It visually highlights bullish and bearish gaps with colored boxes and provides alerts when specific conditions are met.
How It Works
Fair Value Gap (FVG) Detection:
The script identifies gaps based on previous price action. A bullish FVG is recognized when there is a gap below a higher low candle, and a bearish FVG when there is a gap above a lower high candle.
Radar Area:
A yellow “Radar Area” box is drawn on the chart using upper and lower bands defined as a percentage above and below the current price. This area helps you visualize where the price is relative to these bands.
Alerts:
Alerts are triggered based on user-defined conditions:
When price crosses half of the gap (if the "Clear FVG When Price Reaches Half" option is enabled).
When price fully fills the gap (if the option is disabled).
The alert will only be activated after waiting a specified number of bars post-gap formation (as set by the "Wait X Bars After FVG Formation" parameter).
Input Parameters
Radar Upper Band (%):
Sets the upper threshold percentage relative to the current price for the radar area.
Radar Lower Band (%):
Sets the lower threshold percentage relative to the current price for the radar area.
Minimum FVG Size (%):
Determines the minimum size (as a percentage) for a gap to be recognized as a valid FVG.
Clear FVG When Price Reaches Half:
If enabled, the FVG will be cleared when the price reaches the midpoint of the gap. If disabled, the entire gap must be filled before it is cleared.
Wait X Bars After FVG Formation:
Specifies the number of bars to wait after an FVG is detected before triggering an alert. This delay helps to avoid premature alerts.
Bullish and Bearish FVG Colors and Opacity:
Customize the appearance of the FVG boxes for bullish (green) and bearish (red) gaps, including the opacity of these visual elements.
How to Use
Add the Indicator:
Load the FVG Radar indicator on your TradingView chart.
Customize Settings:
Adjust the input parameters based on your trading style and the market’s volatility. The radar area settings help you set your own visual reference for price deviations.
Monitor the Chart:
Watch for the colored boxes that represent FVGs. The boxes will display the size of the gap as a percentage.
Respond to Alerts:
When an alert is triggered after the specified number of bars, it indicates that the price has interacted with the gap. Use this information to guide your trading decisions.
Türkçe --------------------------------------------
FVG Radar göstergesi, TradingView grafiğinizde Fair Value Gap (FVG) – yani adil değer boşluklarını – otomatik olarak tespit etmek için tasarlanmıştır. Bu boşluklar, yükseliş ve düşüş boşluklarını farklı renkli kutularla vurgular ve belirli koşullar sağlandığında uyarılar verir.
Nasıl Çalışır
Fair Value Gap (FVG) Tespiti:
Gösterge, önceki fiyat hareketlerine dayalı olarak boşlukları belirler. Yükseliş boşluğu, düşük seviyenin yukarıdaki mumun altındaki boşlukla oluştuğu durumlarda; düşüş boşluğu ise, yüksek seviyenin aşağıdaki mumun üstünde boşluk oluştuğunda tespit edilir.
Radar Alanı:
Grafikte, mevcut fiyata göre belirlenen üst ve alt yüzde bantlarına dayalı olarak sarı renkte “Radar Alanı” kutusu çizilir. Bu alan, fiyatın bu bantlara göre nerede olduğunu görsel olarak anlamanıza yardımcı olur.
Uyarılar:
Kullanıcının belirlediği koşullara göre uyarılar verilir:
Fiyat, boşluğun yarısına ulaştığında (eğer "FVG'nin yarısına ulaştığında temizle" seçeneği etkinse).
Fiyat boşluğu tamamen doldurduğunda (seçenek devre dışı bırakıldığında).
Uyarı, boşluk oluşumundan sonra belirlenen bar sayısı kadar bekledikten sonra tetiklenir ("FVG Oluşumundan Sonra X Bar Bekle" parametresi).
Giriş Parametreleri
Radar Upper Band (%):
Mevcut fiyata göre radar alanı için üst eşik yüzdesini ayarlar.
Radar Lower Band (%):
Mevcut fiyata göre radar alanı için alt eşik yüzdesini ayarlar.
Minimum FVG Size (%):
Bir boşluğun geçerli bir FVG olarak tanınabilmesi için gereken minimum boyutu (yüzde olarak) belirler.
FVG'nin yarısına ulaştığında temizle:
Etkinse, fiyat boşluğun orta noktasına ulaştığında boşluk temizlenir. Devre dışı bırakılırsa, boşluğun tamamen doldurulması gerekir.
FVG Oluşumundan Sonra X Bar Bekle:
Bir FVG tespit edildikten sonra uyarı tetiklenmeden önce beklenmesi gereken bar sayısını belirler. Bu gecikme, erken uyarıların önüne geçmeyi amaçlar.
Yükseliş ve Düşüş FVG Renkleri ve Opaklık:
Yükseliş boşlukları (yeşil) ve düşüş boşlukları (kırmızı) için kutuların görünümünü ve opaklığını özelleştirmenize olanak tanır.
Nasıl Kullanılır
Göstergeyi Ekleyin:
FVG Radar göstergesini TradingView grafiğinize ekleyin.
Ayarları Özelleştirin:
Ticaret tarzınıza ve piyasanın oynaklığına göre giriş parametrelerini ayarlayın. Radar alanı ayarları, fiyat sapmalarını kendi görsel referansınızla tanımlamanıza yardımcı olur.
Grafiği İzleyin:
FVG’leri temsil eden renkli kutuları takip edin. Kutular, boşluğun yüzdelik büyüklüğünü gösterecektir.
Uyarılara Tepki Verin:
Belirlenen bar sayısı sonrasında tetiklenen uyarı, fiyatın boşluk ile etkileşime girdiğini gösterir. Bu bilgiyi, ticaret kararlarınızı yönlendirmek için kullanın.

Market RhythmMarket Rhythm
Overview
If you’re a price-action enthusiast who loves to stay on top of structural shifts in the market, Market Rhythm is here to supercharge your charting experience! This script automatically identifies swing points (HH, LH, HL, LL), detects breaks of structure (BOS), flags changes of character (CHoCH), and offers an optional Trade Tip to guide your next move. It also provides a sleek table summarizing the latest signals so you can confirm momentum or pivot-based ideas at a glance.
What It Does
Swing Detection
Spots the last few pivot highs and lows on your chart.
Labels them as HH (Higher High), LH (Lower High), HL (Higher Low), or LL (Lower Low).
You can display all identified swings or only the most recent ones.
Adaptive Swing Logic
Optionally invert your swing lengths when the script detects a bearish trend, allowing it to adapt pivot detection automatically.
This means if the market flips to a downtrend, pivot detection reconfigures itself in real time.
Break of Structure (BOS)
If price breaks above the previous swing high or below the previous swing low, the script prints a BOS line on the chart.
You can choose whether to confirm breakouts via candle closes or wicks.
CHoCH (Change of Character)
When a BOS flips from bullish to bearish (or vice versa) against the prior direction, it’s renamed CHoCH for added clarity.
Color-coded lines and labels let you instantly see if the market’s “character” is reversing.
Optional Trade Tip
The script can suggest “Look for Long” or “Look for Short” based on your last pivot type and overall trend direction.
This “Trade Tip” is completely optional: enable or disable it in the settings, and the table reconfigures itself automatically.
Information Table
A compact on-chart table gives you an at-a-glance summary of:
Trend – Are we bullish, bearish, or uncertain?
Last BOS – If there’s a recent break of structure, how many bars ago did it happen?
Last CHoCH – If the market made a sudden reversal, how many bars back?
Trade Tip (Optional) – Summarizes whether conditions favor a long or short setup, or if it’s best to wait.
Alerts
Built-in alert conditions let you know when a BOS or CHoCH happens (bullish or bearish).
Turn them on to receive notifications without staring at the screen all day.
Chart Elements
Swing Labels: “HH,” “LH,” “HL,” “LL” near the pivot bars.
BOS & CHoCH Lines: Solid/dashed/dotted lines drawn across your chart, marking the level of structure that got broken.
Color Codes: Bullish signals are tinted in blue-ish tones, bearish signals in pink/purple-ish tones, making it easy to parse your chart visually.
Trade Tip Row: If enabled, instantly highlights “Look for Long” or “Look for Short” in a color-coded cell (blue for long, purple for short, gray if none).
Key Settings
Swing Points
Swing Points Display: Show all pivots, only the last set, or no pivots at all.
Invert Right Swing in Bearish Trend: Automatically swap your “Right Swing Length (High)” and “Right Swing Length (Low)” once the script detects a bearish trend (signaled by the most recent CHoCH).
Left Swing Length / Right Swing Length High/Low: Control how sensitive pivot detection is for highs vs. lows.
Pivot Source: Decide if your pivots are based on candle closes or wicks.
BOS Settings
Show BOS: Hide or reveal the Break of Structure lines entirely.
BOS Confirmation: Candle closes or wicks needed for a “true” breakout.
Line Style / Width / Color: Customize the BOS lines to your liking.
Show Only Last BOS: Show only the freshest BOS or keep historical ones on the chart.
CHoCH Settings
Show CHoCH: Rename the first opposite BOS to CHoCH if desired.
Bullish/Bearish Colors: Pick your favorite color theme for CHoCH lines.
Line Style / Width / Show Only Last CHoCH: Similar customizing options as BOS lines.
Table Settings
Show Table: Toggle the entire summary table on/off.
Position & Text Size: Choose table location (top-left, bottom-right, etc.) and text size (small to huge).
Show 'Trade Tip' row: Decide whether to add a fourth row that suggests potential trade direction. If disabled, the table has only three rows (Trend, Last BOS, and Last CHoCH).
Alerts
Several alert conditions are built in (e.g., “Bullish BOS Alert,” “Bearish BOS Alert,” “CHoCH Alert,” etc.), so you can set notifications for real-time structural shifts.
Why You’ll Love It
Visual Clarity: No more guesswork on which pivot was broken or whether a CHoCH just took place—color-coded lines and labels handle it.
Flexible Pivot Logic: Candle closes vs. wicks, separate right swing lengths for highs and lows, and an adaptive approach if the market goes bearish.
Quick Glance Table: Summaries of the latest signals keep you in the loop without cluttering your chart.
Trade Tip Option: Let the script gently nudge you toward potential bullish or bearish setups—only if you want it to!
Alerts for Everything: BOS and CHoCH can trigger alerts so you never miss a key structural change.
Give Market Rhythm a go, and watch your chart transform into a dynamic story of structure breaks, pivot swings, and potential trade cues. Whether you’re a short-term scalper or a higher-timeframe swing trader, this tool aims to simplify your analysis and keep you laser-focused on what matters.
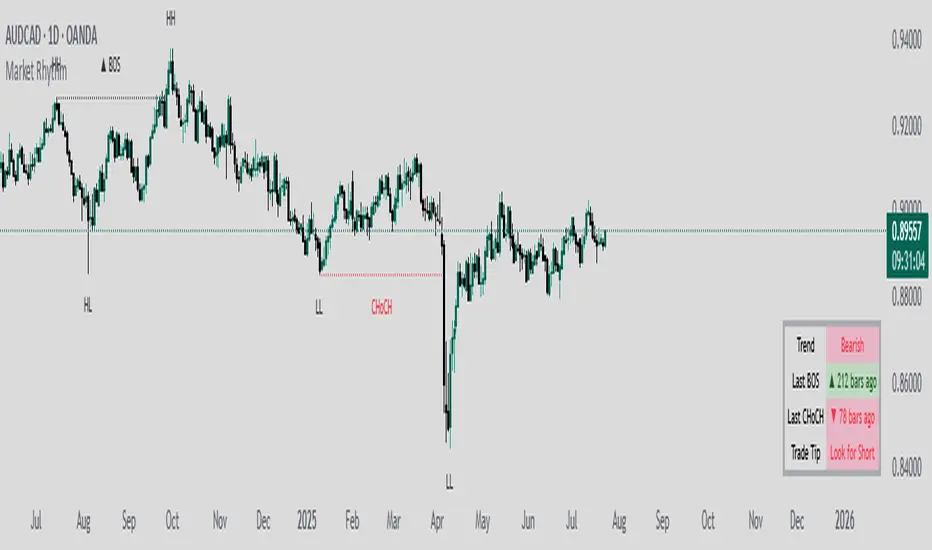
MARKET Structure + MTF DashboardThis script automatically detects market structure shifts and visualizes:
Bullish BOS (Break of Structure)
Bearish BOS
Bullish CHoCH (Change of Character)
Bearish CHoCH
On top of that, it shows a multi-timeframe dashboard in the top-right corner of the chart, so you can instantly see the latest structure event on:
1m
6m
36m
216m
1D
regardless of which timeframe you are currently viewing.
Core Logic
The script is built around swing highs / swing lows using ta.pivothigh and ta.pivotlow.
Pivot Definition
A swing high / low is defined by:
lb = left bars
rb = right bars
A pivot high is a bar whose high is higher than the previous lb bars and the next rb bars.
A pivot low is a bar whose low is lower than the previous lb bars and the next rb bars.
Break Conditions
After a pivot is confirmed, the script waits at least N bars (minBarsAfterPivot) before accepting any break of that pivot level as a valid structure event.
You can choose how to define the break:
Close-based (닫기) – use candle close
Wick-based (없음 or 꼬리) – use high/low (full wick)
BOS vs CHoCH Classification
For each timeframe, the script tracks structure breaks and classifies them:
A move breaking above the last swing high → upward break
A move breaking below the last swing low → downward break
Then:
If the current break direction is the same as the previous break
→ it is classified as BOS (trend continuation)
If the current break direction is the opposite of the previous break
→ it is classified as CHoCH (trend reversal / change of character)
Return codes (internally):
1 = Bullish BOS
2 = Bullish CHoCH
-1 = Bearish BOS
-2 = Bearish CHoCH
0 = no event
Chart Annotations
On the active chart timeframe, the script can optionally show:
Structure lines:
Horizontal lines at the price level where BOS / CHoCH occurred
Lines extend to the left until the first candle that previously touched that price zone
Labels:
“Bull BOS”, “Bear BOS”, “Bull CHoCH”, “Bear CHoCH”
Fully color-customizable (line color, label background, text color, transparency)
You can also enable/disable pivot labels (HH, HL, LL, LH) for swing highs and lows, with separate toggles for:
HH / LL
HL / LH
Multi-Timeframe Dashboard
The dashboard in the top-right corner shows, for each timeframe:
1m / 6m / 36m / 216m / 1D
The last structure event (Bull BOS, Bull CHoCH, Bear BOS, Bear CHoCH, or None)
Colored background by event type:
Strong green / red for CHoCH
Softer green / red for BOS
Gray for None
The important part:
Each timeframe’s state is calculated inside that timeframe itself and then pulled via request.security().
That means:
No matter which chart timeframe you are currently on,
the dashboard always shows the same last event for each TF.
Inputs
Pivot lb / Pivot rb
Control how “wide” a swing must be to be accepted as a pivot.
Breakout 기준 (Confirm type)
Close-based or wick-based break logic.
피봇 이후 최소 대기 캔들 수 (Min bars after pivot)
Minimum number of bars that must pass after a pivot forms before a break can count as BOS / CHoCH.
This filters out very early / noisy breaks.
Toggles:
Show pivot balloons (HH/HL/LL/LH)
Show BOS
Show CHoCH
Visual:
Line colors for each event type
Line transparency
Label background transparency
Label text color
Alerts
The script defines alert conditions for:
Bullish BOS
Bearish BOS
Bullish CHoCH
Bearish CHoCH
You can use them to trigger notifications when a new structure event occurs on the active timeframe.
Notes & Usage
This is a market structure helper, not a complete trading system.
BOS / CHoCH should be used together with:
Liquidity zones
Volume / delta
Orderflow or higher-timeframe context
Parameters like lb, rb, and minBarsAfterPivot are intentionally exposed so you can tune:
Sensitivity vs. reliability
Scalping vs. swing-structure
This script is for educational purposes only and does not constitute financial advice.
Always backtest and combine with your own trading plan and risk management.

Ultimate Market Structure + MTF Dashboard [FIXED]Ultimate Market Structure + MTF Dashboard — Indicator Description
🔶 Overview
Ultimate Market Structure + MTF Dashboard is a fully-automated Smart Money Concepts (SMC) market-structure indicator designed to give traders extremely clean and accurate structural mapping on any timeframe.
It intelligently detects:
External (Swing) Structure
Internal Structure
BOS / CHoCH (Break of Structure / Change of Character)
HH/HL/LH/LL swing labels
Strong/Weak Highs & Lows
Equal Highs (EQH) & Equal Lows (EQL)
Internal BOS/CHoCH (micro-structure)
Multi-Timeframe Structure Dashboard (D, H4, H1, M15, M5)
This indicator eliminates clutter, repaints nothing, and provides crystal-clear visual understanding of market direction.
🎯 What This Indicator Solves
Most structure indicators fail because they:
✔ spam BOS/CHoCH everywhere
✔ repaint pivots
✔ mix internal and external structure
✔ draw messy lines
✔ ignore confluence
✔ don’t show higher timeframe structure
This script solves all of that by using:
Gap-proof pivot detection
Strict internal/external structure separation
Proper BOS/CHoCH logic using previous break
“LastBreak memory” system (no double BOS on same leg)
ATR-filtered internal pivots
Candle-context confluence filter
User-controlled filters for BOS/CHoCH only
Everything is designed for clean, reliable structure.
🧠 How It Works (Logic Explained Clearly)
1️⃣ Swing Structure – External
Based on user-defined swing length (default: 50).
Detects major turning points and evaluates:
HH / HL → Bullish structure
LH / LL → Bearish structure
Once a swing high/low is confirmed, the indicator tracks:
Has price crossed that pivot?
If yes → BOS or CHoCH depending on previous break direction.
2️⃣ Internal Structure – Micro Trend
A second layer using small length pivots (default: 5).
Useful for:
Entries
Scalp-level reversals
Early CHoCH detection
Internal structure uses ATR distance from swing pivots to avoid overlap.
3️⃣ BOS / CHoCH Logic
The script uses a very strict rule:
If previous break direction was opposite → CHoCH
If previous break direction was same → BOS
This eliminates false CHoCH spam and improves trend clarity.
4️⃣ Strong & Weak High/Low Detection
Each time a BOS occurs:
In bearish trend → last swing high = Strong High
In bullish trend → last swing low = Strong Low
Opposite becomes Weak High/Weak Low
These are important Smart Money Concepts levels for:
Premium/discount zones
Liquidity targets
Stop hunts
5️⃣ Equal Highs & Equal Lows (EQH/EQL)
The script automatically identifies EQH/EQL using:
Percentage threshold
Confirmation bar count
Useful for:
Liquidity sweep setups
Inducement
Stop runs
6️⃣ Multi-Timeframe Dashboard
Displays Internal & External structure for:
D (Daily)
H4
H1
M15
M5
Each cell is color-coded:
🟢 Bullish
🔴 Bearish
⚪ Neutral
This gives you instant top-down analysis without switching charts.
📌 What You Can Use This Indicator For
✔ Trend Trading
Keep trades aligned with:
Higher timeframe external trend
Lower timeframe internal entries
For example:
Daily → Bullish
H1 → Bullish
M5 → CHoCH bullish
Entry → Pullback to strong low
✔ Scalping
Internal structure (i-BOS, i-CHoCH) gives:
Fast reversals
Micro CHoCH entries
High-frequency trend shifts
Works extremely well on 1M–5M.
✔ Smart Money Concepts Trading
This indicator gives every SMC component you need:
Liquidity (EQH/EQL)
Swing structure
Internal structure
BOS/CHoCH
Strong/Weak High/Low
Multi-TF context
Perfect for ICT/SMC trading style.
✔ Institutional Order Flow Mapping
Using strong/weak highs/lows and BOS, you can easily determine:
Where smart money targets your stops
Where displacement started
Where structure shifted
Where mitigation may occur
✔ High-Timeframe Confirmation
The dashboard prevents you from trading against:
Daily trend
H4 liquidity levels
H1 structure direction
📈 Who Is This Indicator For?
Beginners
Learn structure visually instead of guessing.
Advanced Traders
Combine structure with:
Liquidity sweeps
FVG
OB
Breaker blocks
Momentum shifts
Scalpers
Use internal BOS/CHoCH for sniper entries.
Swing Traders
Use swing BOS to hold trades for large R:R moves.
ICT / SMC Traders
Perfect for order-block & FVG models.
📌 Recommended Settings
Swing Structure
Length: 50–100
Best for BTC, FX, XAU
Internal Structure
Length: 3–7
Best for scalping
EQ Threshold
FX: 0.10% – 0.25%
Crypto: 0.35% – 0.5%
Confirm Method
Close = safer
Wick = aggressive (scalping)
🧩 Unique Features (Compared to Other Indicators)
✔ Advanced gap-proof pivot engine
✔ Proper historical vs. present structure mode
✔ ATR-filtered internal pivots
✔ Smart confluence filter (detect candle context)
✔ Chart remains clean & minimal
✔ Works on all timeframes including 1-second
✔ No repaint structure
✔ Optimised for high-volatility assets like XAUUSD
🔚 Final Notes
This indicator was engineered to give traders a complete structure toolkit with professional-grade accuracy normally found only in premium paid tools.
With:
Clean BOS/CHoCH
Perfect swing tracking
Full multi-TF dashboard
Smart liquidity detection
Strong/weak level mapping
You can analyse any market with clarity and confidence.

[GetSparx] Lacuna Pro⚡ Lacuna Pro – Institutional Liquidity Framework
This indicator is a premium Smart Money Concepts (SMC) trading toolkit designed to help traders identify high-probability entry and exit zones by visualizing real-time market inefficiencies. It combines Fair Value Gaps (FVGs), Break of Structure (BOS), Change of Character (CHoCH), and Supply & Demand Zones into a unified, configurable framework.
Unlike many public indicators that simply "overlay concepts", this indicator implements strict internal validation to filter out noise and provide only institutional-grade levels — making it a valuable execution layer for SMC-based strategies.
🧠 What the Script Does – and Why the Combination Matters
This is more than just a combination of known SMC tools — it's a complete workflow assistant:
-FVGs highlight where liquidity is likely resting due to institutional imbalance.
-BOS & CHoCH define structural context: whether the market is trending or shifting.
-Supply & Demand Zones show where institutions are likely to react.
-Each component works together to create a layered confluence system:
-FVG inside a Demand Zone after a Bullish CHoCH → High-probability Long Setup
-Bearish BOS into a Supply Zone + fresh Bearish FVG → High-probability Short Setup
📘 Core Concepts Explained
Fair Value Gap (FVG)
FVGs occur when price moves with strong momentum and leaves a gap between candles — suggesting inefficiency. Bullish FVGs lie below price; bearish ones above. Price often returns to these levels before continuing.
An FVG is detected when a three-candle sequence reveals a price imbalance:
- Bullish : Candle 2’s low is higher than Candle 1’s high
- Bearish : Candle 2’s high is lower than Candle 1’s low
These setups indicate a sudden burst of institutional momentum, often causing price to revisit the gap for rebalancing.
Break of Structure (BOS)
A BOS signals trend continuation when price breaks the previous swing high or low in the direction of the current trend.
The script uses a 3-bar pivot system to detect local swing highs and lows — a swing high forms when the highest candle is flanked by two lower highs on each side (and vice versa for swing lows).
A BOS is confirmed when price closes beyond the most recent swing point in alignment with the current trend direction.
Change of Character (CHoCH)
A CHoCH signals a potential trend reversal by breaking a structure level in the opposite direction of the prevailing trend.
It is detected when price breaks the most recent opposing swing and simultaneously flips the internal trend state.
CHoCH events always take precedence over BOS to avoid conflicting signals.
The internal trend engine ensures that these structural shifts are valid and not caused by random volatility.
Supply & Demand Zones
These zones mark institutional interest and are formed using precise price action rules — not arbitrary support/resistance.
A valid zone begins when a small-bodied base candle (such as a star or doji) appears at a local swing point. This candle must be followed by a strong impulse candle — either a bullish engulfing (for demand) or bearish breakout (for supply).
- Demand Zone : From the base candle's low to the impulse candle's high
- Supply Zone : From the base candle's high to the impulse candle's low
These zones represent likely institutional entries or exits, often acting as magnets or rejection areas. Once price decisively breaks through a zone, it is automatically removed — keeping the chart clean and relevant.
Zone Detection Logic – When a Zone Is Drawn or Skipped
Below are the precise rules used to determine whether a Supply or Demand Zone is valid and shown on the chart
A Supply or Demand Zone is only drawn if all of the following conditions are met:
-A small-bodied base candle forms at a local high or low (body size below threshold)
-The base candle is followed by a strong impulse candle (engulfing or breakout)
-The impulse direction matches the expected context (e.g., bearish impulse from swing high = Supply)
-The candle wicks do not invalidate the structure (e.g., no long opposing wick that retraces the move)
-The zone meets the minimum size threshold based on % or ATR filter
If any of these criteria are not satisfied, the zone is skipped to avoid false or weak levels.
This ensures only clean, institutional-grade Supply & Demand Zones are shown on the chart.
(e.g. small-bodied star + bullish engulfing at swing low = Demand Zone, or bearish breakout at swing high = Supply Zone).
🔍 Core Functionality & Original Features
1. 📉 Fair Value Gaps (FVGs) – Dynamic, Validated, and Clean
Unlike scripts that draw every gap, this script applies strict quality control to ensure only meaningful FVGs appear:
Minimum Threshold Filtering
Filters out small or noisy gaps by requiring each FVG to exceed a % or ATR-based size threshold. Prevents micro-gap clutter on lower timeframes.
Momentum Candle Verification
Requires a strong middle candle (candle 2) between two extremes. Large opposing wicks invalidate the setup.
Partial Fill Adjustment
When price partially fills a gap, the FVG box automatically shrinks to show only the remaining imbalance. If fully filled, the box is removed.
Multi-Timeframe Overlays
View institutional gaps from 15m, 1H, 4H, or Daily overlaid onto any chart for top-down analysis and entry refinement.
2. 🧱 Structural Shifts – BOS & CHoCH
Structural logic is built around pivot detection with real-time trend state awareness:
Pivot Logic (Customizable Strength)
Local highs/lows are detected using pivot length (default: 3 bars left/right). Breaks are only confirmed if they align with the internal trend state.
BOS = Continuation
Breaks a swing in trend direction (e.g., HL → HH → BOS at previous HH)
CHoCH = Reversal
Breaks a structure against trend (e.g., HH → HL → break of HL = Bearish CHoCH)
Conflict Resolution
If both BOS and CHoCH could trigger, CHoCH takes priority. This avoids false positives and ensures a single, clear structure signal per swing.
Styling & Visibility
All structure lines and labels are customizable — colors, line style (solid/dashed), and which signals to display (BOS/CHoCH/both).
3. 🧠 Supply & Demand Zones – Smart Detection & Maintenance
These zones are generated using strict price action logic, not arbitrary support/resistance lines:
-Formation Conditions
-Small-bodied "base candle" at a local high/low
-Followed by an impulse candle (bullish/bearish engulfing or breakout)
-Zone Bounds
- Demand : From base candle low to impulse high
- Supply : From base candle high to impulse low
Automatic Cleanup
Once price decisively pierces a zone, it’s automatically removed from the chart. This keeps the display relevant and clutter-free.
Multi-Timeframe Zones
Toggle zones from your current timeframe or overlay from 1H, 4H, and Daily — ideal for confluence stacking.
Zone Compression Filtering
Optional compression % ensures overlapping zones are combined logically to reduce redundancy.
🧩 How It Works Together – Practical Usage Flow
This indicator is designed to follow a structured workflow used by institutional-style traders:
Trend Structure
Identify trend using BOS and CHoCH on your timeframe.
Liquidity Zones
Look for supply/demand zones aligning with the structural bias.
Execution Areas
Wait for an unfilled FVG in confluence with the above conditions.
📸 Screenshot Captions
Screenshot 1: CHoCH + Demand Zone + Bullish FVG
📌 Reversal Setup with Confluence
A Bullish CHoCH confirms a structural shift. Price enters a Demand Zone and reacts from an unfilled Bullish FVG, creating a high-probability long opportunity.
Screenshot 2: Bearish BOS + FVG Fill
📌 Trend Continuation Confirmation
Price breaks a swing low, triggering a Bearish BOS. A Bearish FVG forms and price returns to fill it before continuing lower — validating the trend and the gap.
Screenshot 3: Multi-Timeframe Overlay (FVGs from 1H and 4H)
📌 Top-Down Liquidity Mapping
Overlaid 1H and 4H FVGs provide institutional-level insight on lower timeframes. Combined with structure signals, this supports precise entry alignment across timeframes.
As price partially fills a bullish gap, the FVG box auto-adjusts to show only the remaining imbalance. Fully filled zones are automatically removed, keeping the chart clean.
Screenshot 4: Supply Zone Rejection
📌 Institutional Supply in Action
Price enters a Supply Zone formed from a base candle + bearish impulse. A sharp rejection confirms active sell-side interest at this level. Zone opgevuld box verdwijnt
Screenshot 5: Bullish BOS + Internal Trend Logic
📌 Trend Continuation with Structure Awareness
A Higher Low forms, followed by a Higher High, triggering a Bullish BOS. The internal trend engine confirms direction and filters false reversals.
Screenshot 6: Zone Compression Logic
📌 Smart Zone Consolidation
Closely overlapping supply zones are merged using compression logic to prevent clutter. Only the strongest institutional levels remain visible.
⚙ Full Customization Panel
You can configure:
-FVG display per timeframe + color scheme
-BOS/CHoCH styling, label text, and detection toggles
-Zone settings: visibility, compression %, length
-Auto-cleanup behavior for FVGs and zones
🔐 Why Invite-Only?
This indicator contains original logic not available in public indicators, including:
-Momentum-candle verified FVGs
-Real-time partial fill trimming
-Auto-removal of invalidated structure/zones
-Conflict-aware BOS/CHoCH logic
-Multi-timeframe overlays with internal state tracking
-Proprietary compression-based zone filtering
This script is part of a private paid offering. It is not based on reused or repackaged educational code. The logic and structure management are exclusive to this implementation.
⚠ Disclaimer
This tool is for educational and analytical use only. It does not provide financial advice or trading signals. Always use proper risk management and do your own due diligence.

Radi IQ [TradingIQ]Introducing "Radi IQ".
Radi IQ is a comprehensive market structure indicator designed to provide traders with a detailed view of key price levels and market behavior. It combines several analytical methods—including internal and external structure analysis, fair value gaps, order blocks, breaker blocks, rejection blocks, premium discount zones, equal levels, directional liquidity grabs, and trend meters —to help users better understand areas of support and resistance, potential turning points, and liquidity events in the market.
Key Components and Their Functions
Market Structure Analysis
Internal and External Structure : The indicator evaluates market structure on two levels. The internal analysis focuses on immediate price action (e.g., recent support/resistance and swing points), while the external analysis uses a higher timeframe to provide context. This dual approach helps to confirm the strength of key levels by comparing short-term moves with the broader market trend.
Break of Structure (BoS) and Change of Character (CHoCH) : These signals highlight moments when the market shifts its behavior. A BoS indicates that a previous level of support or resistance has been overcome, while a CHoCH signals a change in the market’s character. Both are marked clearly on the chart using distinct color codes.
Break of Structure + (BoS+) and Change of Character + (CHoCH+) : These signals highlight moments when the market shifts its behavior and is confirmed by prior price action. A BoS + indicates that a previous level of support or resistance has been overcome, while price action achieves higher highs and higher lows (resistance break) or lower highs and lower lows (support break). CHoCH + signals a change in the market’s character when supported by prior price action - lower highs for a support break and higher lows for a resistance break.
BoS and CHoCH
The image above shows BoS and CHoCH identified on the price chart, and explains what each signifies.
A Break Of Structure (BoS) occurs when price decisively moves beyond a previously established support or resistance level. It indicates that the current trend or market pattern is being challenged, and the market may be ready to change direction.
A Change of Character (CHoCH) describes a shift in how the market behaves. A CHoCH occurs when, in an uptrend, a previously established support level breaks, or in a downtrend, a previously established resistance level breaks.
This break indicates that the market's typical structure is shifting, suggesting that the current trend may be losing its strength and that a reversal or a new trend could be developing.
CHoCH+
The image above explains CHoCH+ and how it forms, while highlighting an instance where a downside CHoCH+ formed following lower highs.
A Change of Character + (CHoCH+) describes a shift in how the market behaves that is supported by prior price action. For support breaks, price must form lower highs before breaking support.
The image above explains CHoCH+ for resistance breaks, while highlighting an instance where a resistance point broke that was supported by prior price action.
BoS+
The image above explains BoS+ and how it forms, while highlighting an instance where an upside BoS+ formed following higher highs and higher lows.
A BoS+ resistance break requires higher highs and higher lows prior to the resistance point being closed over.
The image above explains BoS+ support break, while highlighting an instance where a downside BoS+ formed following lower highs and lower lows.
A BoS+ support break requires lower highs and lower lows prior to the support point being closed under.
Future BoS and CHoCH
Radi IQ also displays where the next BoS and CHoCH points are located.
The image above shows the feature in action. With this, traders will always know where the next key support/resistance breakpoints are before they actually occur.
Fair Value Gaps (FVG)
The indicator identifies gaps in the price where little or no trading occurred—known as fair value gaps. These gaps can act as temporary support or resistance and may indicate areas where the market is likely to correct. FVGs are displayed with clear color gradients that differentiate between upward and downward gaps.
The image above shows an identified upside FVG. In the image, the identified upside FVG acted as a support point for price.
The image above shows an identified downside FVG. In the image, the identified downside FVG acted as a resistance point for price.
Low Volume FVG
In addition to identifying trading FVGs - Radi IQ can also specifically detect low volume fair value gaps. Ideally, these fair value gaps will form inside a low volume node on a volume profile.
Low volume node FVGs are important because these are areas where very little trading occurred and is confirmable, indicating an imbalance in supply and demand. Since few trades took place there, the market often moves quickly through these zones when revisited, which can lead to rapid price changes. This "gap" in trading activity can serve as a signal for potential reversals or fast moves, offering opportunities to enter or exit positions based on expected market behavior.
The image above shows identified FVGs that formed on low volume.
Large Area FVGs
Radi IQ is also capable of filtering out “inconsequential” FVGs. With this, Radi IQ can be enabled to only mark FVGs that cover a wide price range.
The image above shows the feature enabled, and all identified FVGs formed with a wide price range.
Large Area FVGs and Low Volume FVGs Combined
Traders can also enable Radi IQ to only mark FVGs that form on low volume and have a wide price range - allowing traders to only identify the highest quality FVGs on the chart.
Order Blocks and Premium Discount Zones
Order Blocks: Radi IQ detects areas where large orders have previously been placed by institutional traders. These blocks can act as strong levels of support or resistance, and the indicator marks bullish and bearish order blocks with dedicated colors.
What is an order block?
Order blocks are clusters of orders that institutions have executed to enter or exit a market position. They typically form when there is a period of consolidation before a significant move. For example, the last bullish candle before a strong down move may indicate a supply order block, while the last bearish candle before a sharp rally might be considered a demand order block.
Why They Form:
Institutions don’t trade in small, sporadic amounts; they accumulate or distribute large volumes of an asset. To avoid slippage and minimize market impact, they execute these orders over a zone rather than at a single price point. This creates a recognizable “block” on the chart.
Order Block Identification Types
Strength Score
The “Strength Score” order block detection mode is a TradingIQ proprietary ranking system for identified order blocks.
Purpose
The purpose of the “Strength Score” ranking system is to determine the “strength” or significance of an order block and rate the zone’s likelihood to act as support/resistance when retested in the future.
The scoring system ranks from 0 - 10, with “0” indicating a “weak” score or low likelihood of acting as a key support/resistance level when retested in the future.
A rating of “5” indicates a “moderate” score, indicating that the order block has a moderate likelihood of acting as a key support/resistance level when retested in the future.
A rating of “10” indicates a “strong” score, indicating that the order block has a strong likelihood of acting as a key support/resistance level when retested in the future.
How It Works
The score is calculated by examining the price move following the formation of an order block. The stronger the price move after an order block forms - the higher the Strength Score.
The image above shows a bearish order block with a score of “5” identified on the chart. The order block successfully operates as a resistance point when retested.
The image above shows a bullish order block with a score of “5” identified on the chart. The order block successfully operates as a resistance point when retested.
Volume-Based
The volume-based order block detection method detects traditional order blocks, but goes one step further by identifying the highest concentration point of volume for the bar and drawing the order block around this concentration point.
Key features when using the volume-based order block detection method:
The top of the order block is anchored to the top of the highest volume concentration point of the bar
The bottom of the order block is anchored to the bottom of the highest volume concentration point of the bar
The total volume that went into creation of the order block is displayed on the chart
The total volume of the order block is recorded as a percentage relative to the total volume for all order blocks on the chart
The image above shows the detection method in action.
Breaker Blocks
A breaker block is a specific type of order block that gains significance when price breaks through it and then often retests the level as a new area of support or resistance. Essentially, it’s a zone where, after the initial break, the previous level (which once acted as strong support or resistance) flips roles. For example, in an uptrend, if the price falls below a key support level, that level can become a breaker block and act as resistance if the price tries to move back up. Conversely, in a downtrend, a broken resistance level can serve as new support. Traders monitor breaker blocks because they often mark a shift in market sentiment and can provide potential entry or exit points once the market re-engages with these levels.
The image above shows a breaker block above price acting as resistance.
The image above shows a breaker block below price acting as support.
Rejection Blocks
A rejection block is a price area where the market shows a strong unwillingness to move beyond a certain level. This typically happens when price approaches a specific level but then is quickly rejected, leading to a bounce in the opposite direction. In other words, a rejection block forms when traders' orders create a barrier, causing the price to reverse rather than break through. Traders watch these areas closely, as they often signal a strong concentration of supply or demand that could provide potential entry or exit points for trades.
The image above shows both a verified upside rejection block acting as resistance, and an untested downside rejection block.
Rejection blocks are expected to function as strong support/resistance points when retested in the future.
Premium Discount Zones
Premium Discount Zones : These zones reflect areas where price is trading above (premium) or below (discount) a fair value range. They help traders gauge whether the current market price is relatively high or low compared to historical averages.
Premium Discount Zones account for recent swing highs and lows to calculate a fair value along with discount and premium prices over an intermediate time window.
The image above shows the premium and discount price zones in action.
Equal Levels
The indicator also tracks and highlights equal levels, which occur when the market repeatedly tests the same price levels. Equal levels can reinforce the significance of a support or resistance area and are represented by their own set of color markers.
The image above shows Radi IQ distinguishing equal highs and equal lows.
Equal Highs
When you see two or more highs that are approximately the same, it suggests that the market is repeatedly rejecting attempts to push higher. This signals a strong resistance level where sellers (or stop-hunters) are active.
Equal Lows
Similarly, consecutive lows at the same level indicate strong support, where buyers step in consistently, preventing further decline.
Strong Highs and Lows
Strong High
A strong high is a price level where the market repeatedly fails to push higher. Typically, it’s characterized by:
Rejection: Price approaches the high but then reverses sharply, often leaving long upper wicks on the candlestick chart.
Consolidation: Multiple bars might show highs that are very close in value (often termed "equal highs"), indicating a well-established resistance zone.
Market Sentiment: This pattern suggests that sellers are actively defending that level, preventing further upward movement.
Strong Lows
Conversely, a strong low is a price level where the market repeatedly fails to break lower. It is identified by:
Bounce Back: Price touches the low and then rebounds sharply, often leaving long lower wicks.
Consistency: Multiple lows occur around the same level (sometimes referred to as "equal lows"), marking a solid support area.
Market Sentiment: This indicates that buyers are stepping in at that level, absorbing selling pressure and supporting the price.
The image above shows Radi IQ detecting both a strong high and strong low, while the detected strong low acts as support when retested.
Liquidity Grabs
Liquidity grabs occur when the market temporarily moves to absorb liquidity, often triggering stop-loss orders and leading to rapid price movements. Radi IQ flags these events by identifying conditions where price moves against recent pivots, helping traders spot potential liquidity-related reversals or breakouts.
The image above shows Radi IQ identifying both an upside liquidity grab and a downside liquidity grab.
Upside Liquidity Grab (Bearish)
An upside liquidity grab happens when the price moves above a well-known resistance area or recent high. This move is often short-lived.
Many traders place stop-loss orders or pending buy orders just above resistance levels. Institutional players may intentionally push price upward to trigger these orders, thereby “grabbing” the liquidity available at that level.
Downside Liquidity Grab (Bullish)
A downside liquidity grab is the mirror image: the price briefly dips below a key support level or recent low.
Traders often place stop-loss orders or pending sell orders just below support levels. An intentional drop below this support can trigger these stops, allowing institutional players to capture liquidity.
Multi-Timeframe Analysis and Swings
By using data from different timeframes, Radi IQ offers a broader perspective on market trends. It highlights significant swing highs and swing lows, providing visual cues that indicate the market’s directional bias. This feature assists traders in identifying both short-term opportunities and long-term trends.
The image above shows Radi IQ detecting higher swings and lower swings.
IQ Meters / Fibometer
IQ Meters (Fibometers) are a proprietary TradingIQ tool that allows traders to easily identify the highs and lows of the current trend and where current price is relative to these points.
The image above depicts the IQ Meters—an exclusive TradingIQ tool designed to help traders evaluate trend strength and retracement opportunities.
When the lower timeframe Zig Zag IQ and the higher timeframe Zig Zag IQ are out of sync (i.e., one is uptrending while the other is downtrending, with no active positions), the meters display a neutral color as shown in the image.
The key to using these meters is to identify trend unison and pinpoint key trend retracement entry opportunities. Fibonacci retracement levels for the current trend are interlaced along each meter, and the current price is converted to a retracement ratio of the trend.
These meters can mathematically determine where price stands relative to the larger and smaller trends, aiding in identifying entry opportunities.
The top of each meter indicates the highest price achieved during the current price move.
The bottom of each meter indicates the lowest price achieved during the current price move.
When both the larger and smaller trends are in sync and uptrending, or when a long position is active, the IQ meters turn green, indicating uptrend strength.
When both meters are green, it indicates uptrend strength as both the higher timeframe trend and lower timeframe trend are in unison. Look for price to retrace to key fibonacci retracement levels during this time period.
When both trends are in sync and downtrending, or when a short position is active, the IQ meters turn red, indicating downtrend strength.
When both meters are red, it indicates downtrend strength as both the higher timeframe trend and lower timeframe trend are in unison. Look for price to retrace to key fibonacci retracement levels during this time period.
Summary
Radi IQ serves as a robust, data-driven tool for traders who seek a deeper understanding of market structure. By integrating internal and external analysis, fair value gap detection, order block identification, premium discount zoning, equal level tracking, liquidity grabs and much more into one indicator, it offers a multi-layered view of the market. This helps traders not only recognize potential turning points and areas of market stress but also manage risk more effectively and plan their trades with greater precision. The indicator’s clear visual representation and dynamic updates make it a practical addition to any trader’s toolkit.
Paid script
TrendPredator ESThe TrendPredator Essential (ES)
Stacey Burke, a seasoned trader and mentor, developed his trading system over the years, drawing insights from influential figures such as George Douglas Taylor, Tony Crabel, Steve Mauro, and Robert Schabacker. His popular system integrates select concepts from these experts into a consistent framework. While powerful, it is highly discretionary, requiring significant real-time analysis, which can be challenging for novice traders.
The TrendPredator ES indicator supports this approach by automating the essential analysis required to trade the system effectively and incorporating a mechanical bias and multi-timeframe concept.
It provides value to traders by significantly reducing the time needed for session preparation and offering relevant chart analysis and signals for live trading through real-time updates and a unique consolidated table format.
The Stacey Burke Master Pattern
Inspired by Taylor’s 3-day cycle and Steve Mauro’s work with “Beat the Market Maker,” Burke’s system views markets as cyclical, driven by the manipulative patterns of market makers. These patterns often trap traders at the extremes of moves above or below significant levels with peak formations, then reverse to utilize their liquidity, initiating the next phase. Breakouts away from these traps often lead to range expansions, as described by Tony Crabel and Robert Schabacker. After multiple consecutive breakouts, especially after the psychological number three, overextension might develop. A break in structure may then lead to reversals or pullbacks. Burke’s system is designed to track these cycles on the daily timeframe and provides signals and trade setups to navigate along them.
Bias Logic and Multi-Timeframe Concept
The indicator covers the basic signals of his system:
- First Red Day (FRD): Bearish break in structure, signalling weak longs in the market.
- First Green Day (FGD): Bullish break in structure signalling weak shorts in the markt.
- Three Days of Longs (3DL): Overextension signalling potential weak longs in the market.
- Three Days of Shorts (3DS): Overextension signalling potential weak shorts in the market.
- Inside Day (ID): Contraction, signalling potential impulsive reversal or range expansion move.
It enhances the original system by introducing:
Structured Bias Logic:
Tracks bias by following how price trades concerning the last previous candle high or low that was hit. For example if the high was hit, we are bullish above and bearish below.
- Bullish state: Breakout (BO), Fakeout Low (FOL)
- Bearish state: Breakdown (BD), Fakeout High (FOH)
Multi-Timeframe Perspective:
- Tracks all signals across H4, H8, D, W, and M timeframes, to look for alignment and follow trends and momentum in a mechanical way.
The indicator monitors the bias and signals of the system across all relevant timeframes and automates the related graphical chart analysis to generate the information needed for the trader to identify key setups. Additional to the SB pattern, the system helps to identify the higher timeframe situation and follow the moves driven by other timeframe traders.
Example: Full Bullish Cycle on the Daily Timeframe with Signals
- The Trap/Peak Formation
The market breaks down from a previous day’s and maybe week’s low—potentially after multiple breakdowns—but fails to move lower and pulls back up to form a peak formation low and closes as a first green day.
Signal: Bullish daily and weekly fakeout low; three consecutive breakdown days (1W Curr FOL, 1D Curr FOL, BO 3S).
- Pullback and Consolidation
The next day pulls further up after first green day signal, potentially consolidates inside the previous day’s range.
Signal: Fakeout low and first green day closing as an inside day (1D Curr IS, Prev FOL, First G).
- Range Expansion/Trend
The following day breaks up through the previous day’s high, launching a range expansion away from the trap.
Signal: Bullish daily breakout of an inside day (1D Curr BO, Prev IS).
- Overextension
After multiple consecutive breakouts, the market reaches a state of overextension, signalling a possible reversal or pullback.
Signal: Three days of breakout longs (1D Curr BO, Prev BO, BO 3L).
Note: This is only one possible scenario; there are many variations and combinations.
Example Chart: Full Bullish Cycle with Correlated Signals
Note: The signals shown along the move are manually added illustrations. The indicator shows these in realtime in the table at the bottom right. This is only one possible scenario; there are many variations and combinations.
Due to the fractal nature of markets, this cycle can be observed across timeframes. The strongest setups show multi-timeframe alignment. For example, a peak formation and potential reversal on the daily timeframe has high probability and follow-through if it also aligns with bearish signals on higher timeframes (e.g., weekly/monthly BD/FOH) and confirmation on lower timeframes (H4/H8 FOH/BD). With this perspective the system enables the trader to follow the trend and momentum and identify rollover points in a very differentiated way.
Detailed Features and Options
1. Historic Highs and Lows
Displays historic highs and lows per timeframe for added context, enabling users to track sequences over time.
Timeframes: H4, H8, D, W, M
Options: Customize for timeframes shown, number of historic candles per timeframe, colors, formats, and labels.
2. Previous High and Low Extensions
Displays extended previous levels (high, low, and close) for each timeframe to assess how price trades relative to these levels.
H4: P4H, P4L, P4C
H8: P8H, P8L, P8C
Daily: PDH, PDL, PDC
Weekly: PWH, PWL, PWC
Monthly: PMH, PML, PMC
Options: Fully customizable for timeframes shown, colors, formats, and labels.
3. Breach Lines
Tracks live market reactions (e.g., breakouts or fakeouts) per timeframe for the last previous high or low that was hit, highlighting these levels originating at the breached candle to indicate bias (color-coded).
Red: Bearish below
Green: Bullish above
H4: 4FOL, 4FOH, 4BO, 4BD
H8: 8FOL, 8FOH, 8BO, 8BD
D: dFOL, dFOH, dBO, dBD
W: wFOL, wFOH, wBO, wBD
M: mFOL, mFOH, mBO, mBD
Options: Fully customizable for timeframes shown, colors, formats, and labels.
4. Multi-Timeframe Table
Provides a real-time view of system signals, including:
Current Timeframe (Curr): Bias states.
- Breakout (green BO): Bullish after breaking above the previous high.
- Fakeout High (red FOH): Bearish after breaking above the previous high but pulling back down.
- Breakdown (red BD): Bearish after breaking below the previous low.
- Fakeout Low (green FOL): Bullish after breaking below the previous low but pulling back up.
- Inside (IS): Price trading neutral inside the previous range, taking the previous bias (color indicates the previous bias).
Previous Timeframe (Prev): Tracks last candle bias state and transitions dynamically.
- Bias for last candle: BO, FOH, BD, FOL in respective colors.
- Inside bar (yellow IS): Indicated as standalone signal.
Note: Also previous timeframes get constantly updated in real time to track the bias state in relation to the level that was hit. This means a BO can still lose the level and become a FOH, and vice versa, and a BD can still become a FOL, and vice versa. This is critical to see for example if traders that are trapped in that timeframe with a FOH or FOL are released. An inside bar stays fixed, though, since no level was hit in that timeframe.
Breakouts (BO): Breakout count 3 longs and 3 shorts.
- 3 Longs (red 3L): Bearish after three breakouts without hitting a previous low.
- 3 Shorts (green 3S): Bullish after three breakdowns without hitting a previous high.
First Countertrend Close (First): Tracks First Red or Green Day.
- First Green (G): After two consecutive red closes.
- First Red (R): After two consecutive green closes.
Options: Customizable font size and label colors.
Overall Options:
Toggle single feature groups on/off.
Customize H8 open/close time as an offset to UTC to be provider independent.
Colour settings for dark or bright backgrounds.
Using the Indicator for Trading
The automated analysis provided by the indicator can be used for thesis generation in preparation for a session as well as for live trading, leveraging the real-time updates. It is recommended to customize the settings accordingly, such as hiding the lower timeframes for thesis generation to keep the charts clean.
1. Setup Identification:
Follow the bias of daily and H8 timeframes. A setup always requires alignment of these.
Setup Types:
- Trend Trade: Trade in alignment with the previous day’s trend.
Example: Price above the previous day’s high → Focus on long setups (dBO, H8 FOL) until overextension or reversal signs appear (H8 BO 3L, First R).
- Reversal Trade: Identify reversal setups when lower timeframes show rollovers after higher timeframe weakness.
Example: Price below the previous day’s high after FOH → Look for reversal signals at the current high of day (H8 FOH, BO 3L, First R).
2. Context Assessment:
Evaluate alignment of higher timeframes (e.g., Month/Week, Week/Day). More alignment → Stronger setups. Conflicting situations → Setups invalidated.
3. Entry Confirmation:
Confirm entries based on H8 and H4 alignment and candle closes (e.g., M15 or M5 close after entering setup zone as confirmation).
Example Chart for Reversal Trade:
1. Setup Identification: FOH continuation after BO 3L overextension, confirmed by H8 FOH, First R.
2. Context Assessment: Month in FOL with bearish First R; Week in BO but bearishly overextended with BO 3L.
3. Entry Confirmation: H4 BD, M5 close.
Further recommendations:
- Higher timeframe context: TPO or volume profile indicators can be used to gain an even better overview.
- Entry confirmation: Momentum indicators like VWAP, Supertrend, or EMA are helpful for increasing precision. Additionally, tracking lower timeframe fakeouts can provide powerful confluence.
- Late session trading: Entries later in the session, such as during the 3rd hour of the NY session, offer better analysis and follow-through on setups.
Limitations:
Data availability using TradingView has its limitations. The indicator leverages only the real-time data available for the specific timeframe being used. This means it cannot access data from timeframes lower than the one displayed on the chart. For example, if you are on a daily chart, it cannot use H8 data. Additionally, on very low timeframes, the historical availability of data might be limited, making higher timeframe signals unreliable.
To address this, the indicator automatically hides the affected columns in these specific situations, preventing false signals.
Disclaimer
This indicator is for educational purposes only and does not guarantee profits.
None of the information provided shall be considered financial advice.
The indicator does not provide final buy or sell signals but highlights zones for potential setups.
Users are fully responsible for their trading decisions and outcomes.

Market Structure Overlay🚀 Market Structure Overlay Indicator 🚀
🔍 Overview
The Market Structure Overlay (MSO) is a sophisticated technical analysis tool created to analyze price action and understand market structure in a more precise way. It identifies Break of Structure (BOS), Market Structure Breaks (MSBs), Equal Highs (EQH), and Equal Lows (EQL) with meticulous precision by utilizing both wicks and closing prices for better accuracy. The MSO is suitable for all trading timeframes, providing traders with the flexibility to observe and trade on any scale, from intraday to long-term trends.
⚙️ How It Works
The MSO uses advanced logic to detect critical price levels that highlight structural changes in the market. It calculates swing highs and lows using user-defined settings, allowing for customization in market structure analysis. The indicator further highlights BOS and MSB levels by leveraging supply and demand detection, offering a comprehensive understanding of trend reversals and continuation points.
✨ Key features include:
📈 Bullish and Bearish BOS/MSB Lines: MSO differentiates between bullish and bearish structural events, which helps traders understand the prevailing trend and identify key pivot points.
🎨 Customizable Appearance: Traders can personalize line styles and colors for BOS/MSB, trendlines and EQH/EQL, making the tool integrate seamlessly into any chart setup.
🔄 Swing Length and Demand Memory Settings: MSO allows users to specify the swing length for BOS lookback and how many historical zones should be stored on the chart, enhancing control over how much data is analyzed visually.
📊 Market Structure Elements Explained
Break of Structure (BOS): A BOS occurs when the price breaks through a previous Higher High (HH) or Lower Low (LL), indicating a continuation of the current trend. It helps confirm the prevailing market direction.
Market Structure Break (MSB): occurs when a Higher Low (HL) or Lower High (LH) is broken, signaling a potential shift in the market trend. This typically marks the beginning of a trend reversal.
Equal Highs (EQH) and Equal Lows (EQL): These levels are areas of liquidity where previous highs or lows are tested again by the market, often signifying areas of accumulation or distribution. EQH and EQL are crucial for recognizing potential liquidity traps.
Trendlines: Trendlines are used to connect successive highs or lows, providing a visual representation of the current direction of the market. They help traders understand trend momentum and potential breakouts.
🔥 Key Features and Benefits
✅ Accurate Market Structure Detection
The Market Structure Overlay identifies Break of Structure (BOS) and Market Structure Breaks (MSB) events that indicate potential trend changes or continuations. The indicator also distinguishes between bullish and bearish market structures using color-coded lines and custom labels, which helps in immediately identifying market dynamics.
📊 Supply and Demand Zones for BOS/MSB Detection
The MSO uses Supply and Demand Zones as part of the detection logic for BOS and MSB. Although these zones are not directly plotted, they play a key role in determining when a significant structural break occurs. This unique approach enhances the accuracy of BOS and MSB identification, as it takes into account areas of accumulation or distribution that often serve as precursors to trend shifts.
🔍 Equal Highs and Lows Detection
The MSO features Equal Highs (EQH) and Equal Lows (EQL) detection, which is a significant indicator for liquidity zones where potential orders might be resting. These areas often trigger key price actions as they get tested or broken.
⚙️ Customizable Settings
Users can customize the indicator’s behavior, including choosing whether to use candle wicks or closing prices, setting swing lengths for identifying key levels, and specifying memory for storing past zones. This flexibility allows traders to adjust the indicator to suit their personal trading strategy and preferences.
⏱️ Multi-Timeframe Highs and Lows
The indicator includes multi-timeframe support for significant highs and lows (daily, weekly, monthly, yearly). This helps traders understand where they are in the larger market context, especially when making decisions during intra-session trading.
🔎 Precise Detection Approach
Unlike traditional market structure indicators that rely heavily on simple pivot points, the MSO employs a more advanced and precise detection mechanism for BOS and MSB. Traditional pivot points typically use a lookback function to identify highs and lows over a fixed period, which can lead to false signals due to market noise or temporary price fluctuations. In contrast, the MSO records and checks swing and interim points against stored memory, only signaling structural breaks after a thorough evaluation. This results in a non-repainting and highly accurate depiction of market structure, minimizing false alerts and providing traders with reliable insights based on price action that remains consistent once confirmed.
🎨 Visualization Options
The MSO uses color-coded BOS and MSB lines to easily differentiate between bullish and bearish scenarios. Users also have options to visualize equal highs/lows (EQH/EQL) to recognize potential liquidity points. A detailed breakdown of Supply and Demand Zones helps traders identify high-probability areas for entries and exits. Additionally, the indicator allows traders to toggle visibility of key elements, including trend lines, labels, and multi-timeframe levels.
📝 Summary
The Market Structure Overlay is an essential tool for understanding price behavior and structural shifts in any financial market. Its use of sophisticated logic to detect structural breaks, coupled with customizable visualizations, allows traders to gain a nuanced view of market dynamics. The supply and demand zones, together with the BOS, MSB, EQH, and EQL labels, provide a strong foundation for both trend-following and reversal trading strategies.
MSO is not just a tool for understanding market direction—it's designed to enhance decision-making by delivering reliable and actionable insights into market structure. This indicator provides a seamless blend of market theory with advanced technical features, making it a valuable asset for serious traders.
📊 Key Visual Examples:
📈 Bullish and Bearish BOS/MSB Lines
📸
🌀 Trendlines
📸
⚠️ Note:
This indicator should be used as part of a broader trading strategy. Always confirm your entries and exits with additional tools and analysis methods. 💡

ICT Smart Money Trading Suite PRO [SwissAlgo]ICT SMC Trading Suite Pro
Structure Detection. Imbalance Tracking. Trade Planning. Contextual Alerts.
Why This Integrated System Was Built
The ICT/SMC methodology requires tracking multiple analytical components simultaneously - a process prone to manual errors, time inefficiency, and visual clutter . This indicator consolidates these elements into a single, unified system , providing rules-based validation for experienced ICT traders who may struggle with execution speed, consistency, and manual calculations.
-----------------------------------------------------------------
What This Indicator Does
ICT/SMC methodology involves tracking multiple analytical components simultaneously. This indicator consolidates them into a single system.
Common challenges when applying ICT manually:
1️⃣ Structure Identification
Determining which pivots qualify as external (macro) structure versus internal (micro) structure requires consistent rules. Inconsistent structure identification affects the detection of the relevant trading range for entries , Change of Character (ChoCH) , and Break of Structure (BoS) . Accurate structure identification is paramount ; a faulty reading invalidates the entire ICT thesis for the current swing. While no automated system can replace human judgment, the indicator provides you with a rules-based starting point for structural analysis. The key goal is to help you find and map the relevant structural leg to focus on.
2️⃣ Chart Organization
Drawing Fibonacci retracements, Fair Value Gaps, Order Blocks, and other imbalances manually creates visual complexity that can obscure the analysis. The indicator addresses this by striving to show all imbalances in a consistent, unified, and understandable visual way , using color coding and z-order layering to maintain clarity even when multiple components are active.
3️⃣ Imbalance Tracking
ICT methodology requires monitoring a vast array of institutional footprints : Fair Value Gaps (FVG), Order Blocks (OB), Breaker Blocks (BB), Liquidity Pools (LP), Volume Imbalances, Wick Imbalances, and Kill Zone ranges. Tracking all these simultaneously and manually monitoring their mitigation status is highly time-intensive and prone to oversight . The indicator constantly scans and tracks all key imbalance types for you, automatically updating their status and creating a dynamic, real-time visual heatmap of unmitigated institutional inefficiency.
4️⃣ Trade Calculation
Determining structure-based Stop Loss (SL) placement, calculating multiple Take Profit (TP) levels with accurate position-sizing splits, and computing the final blended Risk-to-Reward (R:R) ratio involves multiple time-sensitive, manual calculations per setup . The indicator automates this entire trade calculation process for you, instantly providing the necessary pricing (entry, SL, TP), sizing, and performance projections, and mitigating the risk of execution error .
5️⃣ Condition Monitoring
ICT setups often require specific technical conditions to align: price reaching discount Fibonacci levels (0.618-0.882 for shorts, 0.118-0.382 for longs), EMA crossovers confirming momentum, or structural shifts (ChoCH/BoS). Identifying these moments requires continuous chart observation across multiple assets and timeframes.
This indicator includes an alert system that monitors these technical conditions and sends notifications when they occur (real-time). The alert system is designed to minimize spam. This allows traders to review potential setups on demand rather than through continuous observation - particularly relevant for those monitoring multiple instruments or trading sessions outside their local timezone.
-----------------------------------------------------------------
Intended Use
This indicator is designed for traders who:
♦ Apply ICT/SMC methodology - Familiarity with concepts such as Fair Value Gaps, Order Blocks, Liquidity Pools, market structure, and discount/premium zones is assumed. The indicator does not teach these concepts but provides tools to apply them.
♦ Trade on intraday to swing timeframes - The structure detection and Fibonacci zone mapping work across multiple timeframes. Recommended primary timeframe: 1H (adjustable based on trading approach).
♦ Prefer systematic entry planning - The trade calculation feature computes stop loss, take profit levels, and risk-to-reward ratios based on structure and Fibonacci positioning. Suitable for traders who use defined entry criteria.
♦ Monitor multiple instruments or sessions - The alert functionality notifies when specific technical conditions occur (discount zone entries, EMA crossovers, structure changes), reducing the need for continuous manual monitoring.
♦ Use trade execution platforms - The trade summary table displays pre-formatted values (entry, SL, TP levels with quantity splits) that can be manually input into trading platforms or bot services like 3Commas.
-----------------------------------------------------------------
How To Use
Step 1: Structure Analysis
The indicator automatically detects external and internal market structure using pivot analysis. Structure lines are color-coded: red for bearish structure, green for bullish. External pivots are marked with larger triangles, internal pivots with smaller markers. The pivot length parameters (default: 20/20) can be adjusted in settings to align with your structural analysis approach and the asset you are analyzing.
Step 2: Define Your Trading Zone
Use the "Start Swing" and "End Swing" date inputs to mark the beginning and end of the (external) structural leg you wish to analyze. The indicator calculates Fibonacci retracement levels based on these points and color-codes the zones:
* Green zones: Discount area (0.618-0.882 for bearish / 0.118-0.382 for bullish)
* Yellow zones: Premium area (0.786-1.0 for bearish / 0.0-0.214 for bullish)
* Red zones: Extension area beyond structure (potential fake-out zones)
Step 3: Review Imbalances
The indicator identifies and displays multiple imbalance types:
🔥 Volume imbalances (from displacement candles based on PVSRA methodology)
🔥 Fair Value Gaps (FVG)
🔥 Order Blocks (OB) and Breaker Blocks (BB)
🔥 Liquidity Pools (LP) at equal highs/lows
🔥 Wick imbalances (exceptional wick formations)
🔥 Kill Zone liquidity from specific trading sessions (Asian, London, NY AM)
Volume Imbalances
Fair Value Gaps
Order Blocks
Liquidity Pools
Wick Imbalances
Kill Zone Imbalances
According to ICT methodology, imbalances act as price magnets - areas where price tends to return for mitigation. When multiple imbalances overlap at the same price level, this creates a confluence zone with a higher probability of price reaction .
Imbalances are displayed as gray boxes , creating a visual heatmap of institutional inefficiencies. When imbalances overlap, the zones appear darker due to layering, and labels combine to show confluence (e.g., "FVG + OB" or "Vol + LP").
Heatmap of Imbalances
User can view each type alone, or all together (heatmap)
Each imbalance type is tracked until mitigated by price according to ICT principles and can be toggled on/off independently in settings.
Step 4: Reference Levels & Sessions
The indicator displays additional reference data:
🔥 Daily Pivot Points (PP, R1-R3, S1-S3) calculated from previous day
🔥Average Daily Range (ADR) projected from the current day's extremes
🔥 Daily OHLC levels: Today's Open (DO), Previous Day High (PDH), Previous Day Low (PDL)
🔥Session backgrounds (optional): Color-coded boxes for Asian, London, NY AM, and NY PM sessions
Sessions
While these are not ICT-specific imbalances, they represent widely-watched price levels that often attract institutional activity and can act as additional reference points for support, resistance, and liquidity targeting.
All reference levels can be toggled independently in settings.
Step 5: Momentum Reference
EMA 14 and EMA 21 lines are displayed for momentum analysis. When EMA 14 enters discount zones and crosses EMA 21, a triangle marker appears on the chart. This indicates a potential alignment of structure and momentum conditions.
Step 6: Trade Planning
Input your intended entry price in the "Entry Price" field along with your margin and leverage parameters. The indicator automatically calculates all trade parameters:
* Stop loss level (based on Fibonacci structure - typically at 1.118 extension)
* Three take profit levels (TP1, TP2, TP3) with position quantity splits
* Risk-to-reward ratio (blended across all three targets)
* Projected profit/loss values in both dollars and percentage
All calculated values are displayed both visually on the chart (as horizontal lines with labels) and in a formatted Trade Summary table. The table organizes the information for quick reference: entry details, take profit levels with quantities, stop loss parameters, and performance projections.
This pre-calculated data can be manually copied into trading platforms or bot services (such as 3Commas Smart Trades) without requiring additional calculations.
Step 7: Alert Configuration
Create alerts using TradingView's alert system (select "Any alert() function call"). The indicator sends notifications when:
* Price reaches specific discount Fibonacci levels (0.618, 0.786, 0.882 for shorts / 0.382, 0.214, 0.118 for longs)
* EMA 14/21 crossovers occur within discount zones
* Change of Character (ChoCH) is detected
* Break of Structure (BoS) is detected
Note: Alerts require active TradingView alert functionality. Update alerts when changing your trading zone parameters.
-----------------------------------------------------------------
Key Features
Structure & Zone Analysis
* Automated structure detection with external/internal pivots and zig-zag visualization
* Fibonacci retracement mapping with color-coded discount/premium zones
* Visual zone classification: Green (optimal discount), Yellow (premium), Red (fake-out risk)
ICT Imbalances Heatmap
* Volume imbalances (PVSRA displacement candles)
* Fair Value Gaps (FVG)
* Order Blocks (OB) and Breaker Blocks (BB)
* Liquidity Pools (LP) at equal highs/lows
* Wick imbalances (exceptional wick formations)
* Kill Zone liquidity (Asian, London, NY AM sessions)
* Confluence detection with combined labels and visual layering
Reference Levels
* Daily Pivot Points (PP, R1-R3, S1-S3)
* Average Daily Range (ADR) projections
* Daily OHLC levels (DO, PDH, PDL)
* Session backgrounds for kill zones
Trade Planning Tools
* Automated stop loss calculation based on Fibonacci structure
* Three-tier take profit system with position quantity splits
* Risk-to-reward ratio calculation (blended across all targets)
* P&L projections in dollars and percentages
* Trade Summary table formatted for manual platform entry
Momentum & Signals
* EMA 14/21 overlay for momentum analysis
* Visual crossover markers (triangles) in discount zones
* Change of Character (ChoCH) detection and labels
* Break of Structure (BoS) detection and labels
Chart Enhancements
* Higher timeframe candle overlay (5m to Monthly)
* PVSRA candle coloring (volume-based)
* Symbol legend for quick reference
* Customizable visual elements (toggle all components independently)
Alert System
* Discount zone entry notifications (Fibonacci level monitoring)
* EMA crossover signals within discount zones
* Structure change alerts (ChoCH and BoS)
* Configurable via TradingView alert functionality
Alert Functionality
The indicator includes an alert system that monitors technical conditions continuously.
When configured, alerts notify users when specific events occur:
❗ Discount Zone Monitoring
When EMA 14 crosses into key Fibonacci levels (0.618, 0.786, 0.882 for bearish structure / 0.382, 0.214, 0.118 for bullish structure), an alert is triggered. Example: Trading BTC and ETH simultaneously - instead of monitoring both charts for zone entries, alerts notify when either asset reaches the specified level.
❗ Momentum Alignment
When EMA 14 crosses EMA 21 within discount zones, an alert is sent. Example: Monitoring setups across multiple timeframes (1H, 4H, Daily) - alerts indicate when momentum conditions align on any timeframe being tracked.
❗ Structure Changes
Change of Character (ChoCH) and Break of Structure (BoS) events trigger alerts. Example: Trading during the Asian session while located in a different timezone - alerts notify of structure changes occurring outside active monitoring hours.
Configuration
Alerts are set up through TradingView's native alert system. Select "Any alert() function call" when creating the alert.
⚠️ Note: Alert parameters are captured at creation time, so alerts must be updated when changing trading zone settings (Start/End Swing dates) or any other parameter.
How to Create Alerts
Step 1: Open Alert Creation
Click the "Alert" button (clock icon) in the top toolbar of TradingView, or right-click on the chart and select "Add Alert."
Step 2: Configure Alert Condition
* In the alert dialog, set the Condition dropdown to select this indicator
* Set the alert type to ⚠️ " Any alert() function call "
* This configuration allows the indicator to trigger alerts based on its internal logic
Step 3: Set Alert Timing
* Timeframe: Same as chart
* Expiration: Choose "Open-ended (when triggered)" to keep the alert active until conditions occur
* Message tab: choose a name for the alert
Step 4: Notification Settings
Configure how you want to receive notifications:
* Popup within TradingView
* Email notification
* Mobile app push notification (requires TradingView mobile app)
Step 5: Create
Important Notes:
* Alert parameters are captured at creation time . If you change your trading zone (Start/End Swing dates) or entry price, delete the old alert and create a new one .
* One alert per chart: Create separate alerts for each instrument and timeframe you're monitoring.
* TradingView alert limits apply based on your TradingView subscription tier.
What Triggers Alerts: This indicator sends alerts for four key event types:
1. Discount Zone Entry - EMA 14 crossing key Fibonacci levels
2. Momentum Crossover - EMA 14/21 crossovers within discount zones
3. Change of Character (ChoCH) - Structure reversal detected
4. Break of Structure (BoS) - Trend continuation confirmed
All four conditions are monitored by a single alert configuration .
-----------------------------------------------------------------
Recommended Settings
* Timeframe : 1H works well for most assets
* Theme : Dark mode recommended
* Structural Pivots : Default 20/20 captures reasonable structure; adjust to match your analysis
-----------------------------------------------------------------
Chart Elements Guide
♦ Structure Visualization
Zig-zag lines
Automated structure detection - green lines indicate bullish structure, red lines indicate bearish structure. Thick lines represent external structure , thin faded lines show internal structure .
Triangle markers
Large triangles mark external pivots (swing highs/lows), small triangles mark internal pivots.
Fibonacci Zones
* Green zones: Discount area - potential entry zones (0.618-0.882 for shorts / 0.118-0.382 for longs)
* Yellow zones: Premium area - higher extension zones (0.786-1.0 for shorts / 0.0-0.214 for longs)
* Red zones: Fake-out risk area - price beyond structural extremes (above 1.0 for shorts / below 0.0 for longs)
* White dashed lines: Individual Fibonacci levels (1.0, 0.882, 0.786, 0.618, 0.5, 0.382, 0.214, 0.118, 0.0)
♦ Imbalance Heatmap
Gray boxes with dotted midlines
Unmitigated imbalances create a visual heatmap. Overlapping imbalances appear darker due to layering.
Combined labels
When multiple imbalances overlap, labels show confluence (e.g., "FVG + OB", "Vol + LP + Wick")
Types displayed : Vol (Volume), FVG (Fair Value Gap), OB (Order Block), BB (Breaker Block), LP (Liquidity Pool), Wick, KZ (Kill Zone)
♦ Momentum Indicators
* Red line: EMA 14
* Yellow line: EMA 21
* Small triangles on price: Crossover signals - red triangle (bearish crossover), green triangle (bullish crossover) when occurring within discount zones
♦ Structure Change Markers
* Labels with checkmarks/crosses: ChoCH (Change of Character) and BoS (Break of Structure) events (Green label with ✓: Bullish ChoCH or BoS, Red label with ✗: Bearish ChoCH or BoS)
♦ Trade Planning Lines (when entry price is set)
* Blue horizontal line: Entry price
* Green dashed lines: TP1 and TP2
* Green solid line: TP3 (final target)
* Red horizontal line: Stop Loss level
TP levels and SL are calculated based on the structure range, entry price, and mapped trading zone, and aim to achieve a minimum risk: reward ratio of 1:1.5 (R:R)
♦ Colored background zones:
Green shading between entry and TP3 (profit zone), red shading between entry and SL (loss zone)
♦ Reference Levels
* Orange dotted lines with labels: Daily Pivot Points (PP, R1-R3, S1-S3)
* Purple dotted lines with labels: ADR High and ADR Low projections
* Cyan dotted lines with labels: DO (Daily Open), PDH (Previous Day High), PDL (Previous Day Low)
♦ Session Backgrounds (optional)
* Yellow shaded box: Asian session (19:00-00:00 NY time)
* Blue shaded box: London session (02:00-05:00 NY time)
* Green shaded box: NY AM session (09:30-11:00 NY time)
* Orange shaded box: NY PM session (13:30-16:00 NY time)
♦ Trade Summary Table (top-right corner)
Displays a complete trade plan with sections:
* Sanity Check: Plan validation status
* Setup: Trade type, leverage, entry price, position size
* Take Profit: TP1, TP2, TP3 with prices, percentages, and quantity splits
* Stop Loss: SL price and type
* Performance: Potential profit/loss, ROI, and risk-to-reward ratio
♦ HTF Candle Overlay (optional, displayed to the right of the current price)
* Larger candlesticks representing higher timeframe price action
* Green bodies: Bullish HTF candles
* Red bodies: Bearish HTF candles
* Label shows selected timeframe (e.g., "HTF→ D" for daily)
♦ Legend Table (bottom-right corner)
Quick reference guide explaining all symbol abbreviations and color codes used on the chart.
-----------------------------------------------------------------
Methodology & Calculation Details
This indicator consolidates multiple ICT/SMC analytical components into a single integrated system. While individual elements could be created separately, this integration provides automated coordination between components , consistency, and reduces chart complexity.
Structure Detection External and internal pivots
Are identified using fractal pivot analysis with configurable lookback periods (default: 20 bars for both). A pivot high is confirmed when the high at the pivot bar exceeds all highs within the lookback range on both sides. Pivot lows use inverse logic. Structure lines connect validated pivots, with color coding based on price direction (higher highs/higher lows = bullish, lower highs/lower lows = bearish).
Fibonacci Retracement Calculation
Users define two swing points via date/time inputs. The indicator calculates the price range between these points and applies standard Fibonacci ratios (0.0, 0.118, 0.214, 0.382, 0.5, 0.618, 0.786, 0.882, 1.0, plus extensions at 1.118, 1.272, -0.118, -0.272). Zone classification is based on ICT discount/premium principles: 0.618-1.0 range for bearish setups, 0.0-0.382 for bullish setups.
Imbalance Identification
Volume Imbalances : Detected using PVSRA (Price, Volume, Support, Resistance Analysis) methodology. Candles are classified based on the percentile ranking of volume and price range over a 1344-bar lookback period. Type 1 imbalances require ≥95th percentile in both volume and range; Type 2 requires ≥85th percentile. Additional filters include body-to-range ratio (≥50% for Type 1, ≥30% for Type 2) and ATR validation.
Fair Value Gaps (FVG) : Identified when a three-candle sequence shows a price gap: low > high for bullish FVG, high < low for bearish FVG. The middle candle must close beyond the gap edge. Mitigation occurs when the price retraces into the gap.
Order Blocks (OB) : Detected by identifying the last opposing candle before a significant price move. When price breaks a swing high/low, the algorithm scans backwards to find the candle with the highest high (bearish OB) or lowest low (bullish OB) before the breakout. When an OB is breached, it converts to a Breaker Block (BB).
Liquidity Pools (LP) : Identified by detecting equal highs or equal lows using a tolerance threshold based on ATR. Pivot highs/lows within this tolerance range are grouped. Equal highs create Buy-Side Liquidity (BSL) zones above the level; equal lows create Sell-Side Liquidity (SSL) zones below the level.
Wick Imbalances: Flagged when a candle's wick exceeds 1.0x ATR and comprises >50% of the total candle range. These represent rapid rejections or absorption events.
Kill Zone Liquidity: Tracks the high/low range during specific ICT-defined sessions (Asian: 19:00-00:00 NY, London: 02:00-05:00 NY, NY AM: 09:30-11:00 NY). At session close, BSL and SSL zones are created above/below the session range.
Change of Character (ChoCH) & Break of Structure (BoS)
ChoCH is detected when price breaks counter to the established structure (bearish structure broken upward = bullish ChoCH; bullish structure broken downward = bearish ChoCH). BoS occurs when price breaks in the direction of the established trend (bearish structure breaking lower = bearish BoS; bullish structure breaking higher = bullish BoS).
Trade Calculations
Stop Loss and Take Profit levels are calculated based on the entry position within the Fibonacci zone structure:
* Premium entries (0.786-1.0 for shorts / 0.0-0.214 for longs): SL at 1.118/-0.118 extension, TP structure weighted toward zone extremes
* Golden entries (0.618-0.786 for shorts / 0.214-0.382 for longs): SL at 1.0/0.0 boundary, TP structure balanced across range
Risk-to-reward ratios are calculated as blended values across all three take profit levels, weighted by position quantity splits.
Reference Level Calculations
* Pivot Points: Standard formula using previous day's high, low, and close: PP = (H + L + C) / 3
* Support/Resistance: R1 = 2×PP - L, S1 = 2×PP - H, with R2/S2 and R3/S3 calculated using range extensions
* ADR: 14-period simple moving average of daily high-low range, projected from current day's extremes
Momentum Analysis
EMA 14 and EMA 21 use standard exponential moving average calculations. Crossovers are detected when EMA 14 crosses EMA 21 within user-defined discount zones, with directional confirmation (cross under in bearish discount = short signal; cross over in bullish discount = long signal).
Why This Integration Matters
While components like EMA crossovers, pivot detection, or Fibonacci retracements exist as separate indicators, this system provides:
1. Coordinated Analysis : All components reference the same structural framework (user-defined trading zone)
2. Automated Mitigation Tracking : Imbalances are monitored continuously and removed when mitigated according to ICT principles
3. Contextual Alerts : Notifications are triggered only when conditions align within the defined structural context
4. Trade Parameter Automation : Stop loss and take profit calculations adjust dynamically based on entry positioning within the structure
5. Consistent Visual Display : All elements use a unified color scheme, labeling system, and z-order layering. This eliminates visual conflicts that occur when stacking multiple independent indicators (overlapping lines, label collisions, inconsistent transparency levels, conflicting color schemes).
This consolidation reduces the need to manually coordinate 8-10 separate indicators, eliminates redundant calculations across disconnected tools, and maintains visual clarity even when all components are displayed simultaneously.
-----------------------------------------------------------------
Disclaimer
1. Indicator Functionality and Purpose
This indicator is solely a technical analysis tool built upon established methodologies (Smart Money Concepts/ICT) and statistical calculations (Pivots, Fibonacci, EMAs). It is designed to assist experienced traders in visualizing complex data, streamlining the analytical workflow, and automating conditional alerting.
The indicator is NOT:
♦ Financial Advice: It does not provide personalized investment recommendations, solicited advice, or instruction on buying, selling, or holding any financial instrument.
♦ A Guarantee of Profit: The presence of a signal, alert, or trade plan output by this tool does not guarantee that any trade will be profitable.
♦ A Predictor of Future Prices: The tool calculates probabilities and potential scenarios based on historical data and current structure; it does not predict future market movements.
2. General Trading Risks and Capital Loss
♦ All trading involves substantial risk of loss. You may lose some or all of your initial capital. Leveraged products, such as futures, CFDs, and margin trading, carry a high degree of risk and are not suitable for all investors.
♦ Risk Acknowledgment: By using this indicator, you acknowledge and accept that you are solely responsible for all trading decisions, and you bear the full risk of any resulting profit or loss.
♦ Risk Management is Crucial: This indicator is an analytical tool only. You must employ independent risk management techniques (position sizing, stop-loss orders) tailored to your personal financial situation and risk tolerance.
3. Calculation Limitations and Non-Real-Time Data
The calculations performed by this indicator are based on the data provided by your charting platform (e.g., TradingView).
♦ Data Accuracy: The accuracy of the outputs (e.g., Price Delivery Arrays, Pivots, P&L projections) is dependent on the accuracy and real-time nature of the underlying market data feed.
♦ Latencies: Trade alerts and signals may be subject to minor delays due to server processing, internet connectivity, or charting platform performance. Do not rely solely on alerts for execution.
♦ Backtesting and Performance: Any depiction of past performance, including data visible on the chart, is not indicative of future results. Trading results will vary based on market conditions, liquidity, and execution speed.
4. Software and Platform Disclaimer
"As Is" Basis: The indicator is provided on an "as is" basis without warranties of any kind, whether express or implied. The author does not guarantee the script will be error-free or operate without interruption.
Third-Party Integration: This indicator is not affiliated with, endorsed by, or connected to TradingView, 3Commas, or any other broker or execution platform. All third-party names are trademarks of their respective owners. The formatting of the Trade Summary Table for 3Commas is for user convenience only.
5. Required Competency (User Responsibility)
This indicator is built on the assumption that the user is an experienced trader with a working understanding of the complex concepts being visualized (ICT/SMC, FVG, Order Blocks, Liquidity, etc.). The indicator does not teach these concepts.
You Must Always Do Your Own Research (DYOR) before making any trading decision based on signals or visualization provided by this tool.
By installing and using this indicator, you explicitly agree to these terms and assume full responsibility for all trading activity.

Sweep2Trade Pro [CHE]Sweep2Trade Pro \ — Liquidity Sweep → Trend → Confirmation
Sweep2Trade Pro \ helps you catch high-probability reversals or continuations that start with a liquidity sweep, align with the T3 trend, and finalize with a structure confirmation (BOS). It’s designed to reduce noise, time your entries, and keep you out of weak, chop-driven signals.
What’s a “sweep”?
A liquidity sweep happens when price briefly breaks a prior swing high/low (where many stops sit), triggers those stops, and then snaps back. This “stop-hunt” creates liquidity for bigger players and often precedes a sharp move in the opposite direction if the break fails, or fuels continuation if structure actually shifts.
What’s a BOS (Break of Structure)?
A BOS is a price action event where the market takes out a recent swing level in the trend’s direction, signaling continuation and confirming that structure has shifted (bullish BOS through a recent swing high, bearish BOS through a recent swing low).
How the indicator works (at a glance)
1. Regime Filter (T3 + R²)
T3 Moving Average: A smoother, faster-responding moving average that aims to reduce lag while filtering noise, so trend direction changes are clearer.
R² (Coefficient of Determination): Measures how “linear” the recent price path is (0→1). Higher values = stronger, cleaner trend; lower values = more chop. Used here to allow trades only when trend quality exceeds a user-set threshold.
2. Sweep Detection
Bullish sweep: price pokes below a prior swing low and closes back above it.
Bearish sweep: price pokes above a prior swing high and closes back below it.
Lookback length is configurable.
3. Sequence Lock (built-in FSM)
The script manages state in phases so you don’t jump the gun:
Phase 1: Sweep detected → wait for T3 to turn in the corresponding direction.
Phase 2: T3 direction confirmed → show “SWEEP OK” and wait for final confirmation.
Trade Signal: Only fires if confirmation arrives before a timeout.
4. Confirmation Layer
BOS via wick or close (you choose),
Strong close toward the signal (top/bottom quartile of the candle),
Optional “close above/below T3” condition.
These checks help avoid weak sweeps that immediately fade.
5. Alerts & Visuals
“SWEEP OK” markers show when the sweep + T3 direction align.
Final BUY/SELL arrows appear only when the confirmation layer passes.
Ready-made alert conditions for automation.
What you can do with it
Time reversals after sweeps: Enter when a stop-hunt fades and structure confirms.
Ride continuations: Use BOS with the T3 trend to pyramid or re-enter with structure on your side.
Filter chop: Let R² gate entries to periods with cleaner directional drift.
Automate: Use the included alerts with your platform or webhook setup.
Inputs (key settings)
Regime Filter
T3 Length / Volume Factor: Controls smoothness and responsiveness. Smaller length → faster, more sensitive; higher volume factor → smoother curve.
R² Lookback & Threshold: Length of the linear fit window and the minimum “trend quality” required. Higher thresholds mean fewer, cleaner signals.
Sweep / Sequence
Swing Lookback: How far back to define the “reference” high/low for sweeps.
Timeout: Maximum bars allowed between phases to keep signals fresh.
Restart timeout on Phase 2: Optional safety so entries don’t go stale.
Confirmation
BOS Lookback: Micro-pivot window for structure breaks.
Wick vs Close BOS: Conservative traders may prefer close.
Require close above/below T3: Tightens confirmation with trend alignment.
Practical guide (quick start)
1. Timeframe & markets: Works across majors, indices, and crypto. Start with 5m–1h intraday or 1h–4h swing; adjust R² threshold upward on noisier pairs.
2. Entry recipe (Long):
Bullish sweep of a prior low → T3 turns up → BOS/strong close.
Optional: enable “close above T3” for extra confirmation.
3. Entry recipe (Short): Mirror the above.
4. Stops: Common choices are just beyond the sweep wick (tighter) or past the BOS invalidation (safer).
5. Targets: Previous structural levels, measured move, or a T3 trail (exit when price closes back through T3).
6. Avoid low-quality contexts: If R² is very low, market is likely ranging erratically—skip or widen filters.
Tips & best practices
Context first: The same sweep means different things in a strong trend vs. flat regime; that’s why the T3+R² filter exists.
BOS choice: Wick-based BOS is earlier but noisier; close-based BOS is slower but cleaner. Tune per market.
Backtest -> Forward test: Validate settings per symbol/timeframe; then paper trade before going live.
Risk: Fixed fractional risk with asymmetric R\:R (e.g., 1:1.5–1:3) generally performs better than “all-in” discretionary sizing.
Behind the scenes (for the curious)
T3 is a multi-stage EMA construction that produces a smooth curve with reduced lag versus simple/standard EMAs.
R² is the square of correlation (0–1). Here it’s used as a moving gauge of how well price aligns to a linear path—our “trend quality” dial.
Stop-hunts / sweeps are a recognized microstructure phenomenon where clustered stops provide the liquidity that fuels the next move.
Disclaimer
No indicator guarantees profits. Sweep2Trade Pro \ is a decision aid; always combine with solid risk management and your own judgment. Backtest, forward test, and size responsibly.
The content provided, including all code and materials, is strictly for educational and informational purposes only. It is not intended as, and should not be interpreted as, financial advice, a recommendation to buy or sell any financial instrument, or an offer of any financial product or service. All strategies, tools, and examples discussed are provided for illustrative purposes to demonstrate coding techniques and the functionality of Pine Script within a trading context.
Any results from strategies or tools provided are hypothetical, and past performance is not indicative of future results. Trading and investing involve high risk, including the potential loss of principal, and may not be suitable for all individuals. Before making any trading decisions, please consult with a qualified financial professional to understand the risks involved.
By using this script, you acknowledge and agree that any trading decisions are made solely at your discretion and risk.
Enhance your trading precision and confidence 🚀
Happy trading
Chervolino

Contrarian 100 MAPairs nicely with Enhanced-Stock-Ticker-with-50MA-vs-200MA located here:
Description
The Contrarian 100 MA is a sophisticated Pine Script v6 indicator designed for traders seeking to identify key market structure shifts and trend reversals using a combination of a 100-period Simple Moving Average (SMA) envelope and Inner Circle Trader (ICT) Break of Structure (BoS) and Market Structure Shift (MSS) logic. By overlaying a semi-transparent SMA-based shadow on the price chart and plotting bullish and bearish structure signals, this indicator helps traders visualize critical price levels and potential trend changes. It leverages higher timeframe (HTF) pivot points and dynamic logic to adapt to various chart timeframes, making it ideal for swing and contrarian trading strategies. Customizable colors, timeframes, and alert conditions enhance its versatility for manual and automated trading setups.
Key Features
SMA Envelope: Plots a 100-period SMA for high and low prices, creating a semi-transparent (50% opacity) purple shadow to highlight the price range and provide context for price movements.
ICT BoS/MSS Logic: Identifies Break of Structure (BoS) and Market Structure Shift (MSS) signals for both bullish and bearish conditions, based on HTF pivot points.
Dynamic Timeframe Support: Adjusts pivot detection based on user-selected HTF (default: 1D) and chart timeframe (1M, 5M, 15M, 30M, 1H, 4H, 1D), ensuring adaptability across markets.
Visual Signals: Draws dotted lines for BoS (bullish/bearish) and MSS (bullish/bearish) signals at pivot levels, with customizable colors for easy identification.
Contrarian Approach: Signals potential reversals by combining SMA context with ICT structure breaks, ideal for traders looking to capitalize on trend shifts.
Alert Conditions: Supports alerts for bullish/bearish BoS and MSS signals, enabling integration with TradingView’s alert system for automated trading.
Performance Optimization: Uses efficient pivot detection and line management to minimize resource usage while maintaining accuracy.
Technical Details
SMA Calculation:
Computes 100-period SMAs for high (smaHigh) and low (smaLow) prices.
Plots invisible SMAs (fully transparent) and fills the area between them with 50% transparent purple for visual context.
Pivot Detection:
Uses ta.pivothigh and ta.pivotlow to identify HTF swing points, with dynamic lookback periods (rlBars: 5 for daily, 2 for intraday).
Tracks pivot highs (pH, nPh) and lows (pL, nPl) using a custom piv type for price and time.
BoS/MSS Logic:
Bullish BoS: Triggered when price breaks above a pivot high in a bullish trend, drawing a line at the pivot level.
Bearish BoS: Triggered when price breaks below a pivot low in a bearish trend.
Bullish MSS: Occurs when price breaks a pivot high in a bearish trend, signaling a potential trend reversal.
Bearish MSS: Occurs when price breaks a pivot low in a bullish trend.
Lines are drawn using line.new with xloc.bar_time for precise alignment, styled as dotted with customizable colors.
HTF Integration: Fetches HTF close prices and pivot data using request.security with lookahead_on for accurate signal timing.
Line Management: Maintains an array of lines (lin), removing outdated lines when new MSS signals occur to keep the chart clean.
Pivot Reset: Clears broken pivots (e.g., when price exceeds a pivot high or falls below a pivot low) to ensure fresh signal generation.
How to Use
Add to Chart:
Copy the script into TradingView’s Pine Editor and apply it to your chart.
Configure Settings:
SMA Length: Adjust the SMA period (default: 100 bars) to suit your trading style.
Structure Timeframe: Set the HTF for pivot detection (default: 1D).
Chart Timeframe: Select the chart timeframe (1M, 5M, 15M, 30M, 1H, 4H, 1D) to adjust pivot sensitivity.
Colors: Customize bullish/bearish BoS and MSS line colors via input settings.
Interpret Signals:
Bullish BoS: White dotted line (default) at a broken pivot high in a bullish trend, indicating trend continuation.
Bearish BoS: White dotted line at a broken pivot low in a bearish trend.
Bullish MSS: White dotted line at a broken pivot high in a bearish trend, suggesting a reversal to bullish.
Bearish MSS: White dotted line at a broken pivot low in a bullish trend, suggesting a reversal to bearish.
Use the SMA shadow to gauge price position within the recent range.
Set Alerts:
Create alerts for bullish/bearish BoS and MSS signals using TradingView’s alert system.
Customize Visuals:
Adjust line colors or SMA fill transparency via TradingView’s settings for better visibility.
Example Use Cases
Swing Trading: Use MSS signals to enter trades at potential trend reversals, with the SMA envelope confirming price extremes.
Contrarian Trading: Capitalize on BoS and MSS signals to trade against prevailing trends, using the SMA shadow for context.
Automated Trading: Integrate BoS/MSS alerts with trading bots for systematic entries and exits.
Multi-Timeframe Analysis: Combine HTF signals (e.g., 1D) with lower timeframe charts (e.g., 1H) for precise entries.
Notes
Testing: Backtest the indicator on your chosen market and timeframe to validate performance.
Compatibility: Built for Pine Script v6 and tested on TradingView as of June 19, 2025.
Limitations: Signals rely on HTF pivot accuracy, which may lag in fast-moving markets. Adjust rlBars or timeframe for sensitivity.
Optional Enhancements: Consider uncommenting or adding a histogram for SMA divergence (e.g., smaHigh - smaLow) for additional insights.
Acknowledgments
This indicator combines ICT’s market structure concepts with a dynamic SMA envelope to provide a unique contrarian trading tool. Share your feedback or suggestions in the TradingView comments, and happy trading!

Timeframe Titans: Market Structure & MTF Order Blocks🟩 OVERVIEW
A combined market structure and order block indicator. Displays fractals, zigzags, Break Of Structure and Change Of Character lines. Shows order blocks on the chart and a higher timeframe.
Unique features include:
• The structure rules require counter fractals for BOS. This enables us to use more responsive fractal settings without creating excessive noise.
• Structure is strict. After the initial CHoCH there is always one and only one active CHoCH line.
• Order blocks can be filtered by market structure.
• Order blocks are based entirely on candle patterns (which appear to be unique among all the indicators we tested) instead of using pivots or other configurable calculations.
• Order blocks have separate mitigation levels, not merely the edge of the block, and being partially mitigated is a separate logical state.
🟩 WHAT IS MARKET STRUCTURE?
There are many ways to conceptualise and code market structure — the prevailing trend derived from important price levels. All of them start with identifying highs and lows in price, then use breaks of those levels to assign a trend.
This indicator displays the following market structure features:
• Williams Fractals to derive high and low pivots.
• Zigzag lines, which connect highs and lows.
• Break of Structure (BOS) lines, which are formed from the highest high in an *uptrend* or the lowest low in a *downtrend*. A break of a BOS line signals trend continuation.
• Change of Character (CHoCH) lines, which are formed from the highest high in a *downtrend* or the lowest low in an *uptrend*. A break of a CHoCH line signals trend reversal.
• Market structure bias, which is derived from the break of a CHoCH line. If a CHoCH line is broken to the upside, the trend is bullish, and if to the downside, bearish.
(For more details of the market structure features of this indicator, see the FEATURES OF THIS INDICATOR section.)
This definition of market structure implies that:
• There can only ever be one single active BOS line.
• There can only ever be one single active CHoCH line.
• A break of a BOS line creates a new CHoCH line.
• A break of a CHoCH line creates a new bias, a new BOS line, and a new CHoCH line.
• Before we can create a BOS, we need to know the bias, for which we need the CHoCH, for which we need BOS... just one of the chicken-vs-egg difficulties of coding market structure.
To understand how this indicator differs from other market structure indicators, see the COMPARISON WITH OTHER INDICATORS section.
🟩 WHAT ARE ORDER BLOCKS?
Order blocks are candle patterns that appear at highs and lows. The theory is that these areas are where many orders were filled — too many for the order book, causing an imbalance in buyers and sellers. As such, these areas can form support or resistance levels when price returns to them.
This indicator displays the following features related to order blocks:
• Imbalances, also called Fair Value Gaps.
• Order blocks of two different types (Imbalance Block and Standard Order Blocks)
(For more details of the order block features of this indicator, see the FEATURES OF THIS INDICATOR section.)
There are different patterns that can define order blocks, but the common element is that price should move vigorously away from the area after the pattern forms.
To understand how this indicator differs from other order block indicators, see the COMPARISON WITH OTHER INDICATORS section.
🟩 FEATURES OF THIS INDICATOR
Pivots
Shows Williams high and low fractals, with a configurable lookback. The pivots are always calculated, since they are the building block of all other market structure features. The pivot shape display can be turned on or off, and the display customised.
Zigzag
Draws lines between the highs and lows. The lines can be shown or hidden, and the colour and thickness configured.
Break of Structure
BOS lines are always calculated, but can be shown or hidden. The appearance can be customised. BOS lines are drawn from the candle that has the high or low that defines their level. They always extend until they are broken or the bias changes. The BOS lines have an optional, configurable label. When a BOS line is broken, an optional, configurable label is drawn on that bar.
Change of Character
CHoCH lines can be shown, hidden, and customised. CHoCH lines always extend until they are broken or a new CHoCH line is formed. CHoCH lines have optional labels. A different, customisable label is drawn when a CHoCH line is broken.
Market structure bias
Market structure bias is derived from the break of a CHoCH line. If a CHoCH line is broken to the upside, the trend is bullish, and if to the downside, bearish. The background is shaded a configurable colour based on the trend.
Imbalances
Imbalances are drawn in configurable colours. When they are mitigated, you can choose to change the colour, delete them, or leave them.
Order blocks
Two types of imbalance order blocks are displayed: Standard Order Blocks and Imbalance Blocks. They can be shown or hidden, and customised, independently.
Each order block has a mitigation line with configurable colours and style. If price exceeds the mitigation line, the order block is mitigated and is considered inactive.
The order blocks, or their labels, can be deleted when the order block is mitigated. If not deleted, their colour is changed and they no longer extend with each new bar.
Order blocks on the chart timeframe can be shown conditionally within the context of the market structure: you can choose to show:
• Pro-trend order blocks (bearish order blocks that were created in bearish market structure and vice-versa).
• Counter-trend order blocks (bearish order blocks that were created in bullish market structure and vice-versa).
• All order blocks.
Higher timeframe
Imbalances and order blocks can be independently shown and customised on a single higher timeframe. The HTF functions of this indicator do not repaint because they use confirmed data.
You can choose a custom, fixed higher timeframe, or an "Auto" mode where the script automatically chooses the higher timeframe based on the chart timeframe.
Script information messages
An optional table shows information about the script, including configuration problems, such as if a custom HTF is not actually higher than the chart timeframe.
🟩 HOW TO USE
There are very many ways to use market structure and order blocks in trading and we recommend you study extensively, and if possible get a trusted mentor.
Here is a random example we found on the recent GBPUSD chart. In the screenshot below, the left chart is at 30m and the right is at 5m. We've toggled various settings to make the chart clearer for demonstration purposes.
1 — We get a CHoCH break on the higher timeframe. So our bias (if we are trying to trade with the trend) is bearish. Now we look for some other confluence.
2 — Price revisits the top of the range and mitigates an imbalance block. It wicks the CHoCH (resetting it) but does not break it on close. The bearish market structure is thus preserved. For these reasons, we're thinking about a short, and we switch to the 5m chart on the right to find an entry. We've chosen a Custom HTF of 30m to match the left chart and we can see the mitigated HTF order block, marked "30m IB". We can see when price moves definitively out of the order block area to the downside.
3 — A bearish order block is formed and very quickly price comes back into it. We could enter a short here with a stop above the closest relevant fractal.
4 — Another bearish order block forms and price retests it. Another entry. Two previous 5m bullish order blocks at the bottom of the chart act as support. We could potentially close our short here.
5 — Another test of the same block, which was not mitigated the first time. Another potential short entry. As it happens, price makes a massive run lower here, such that we could trail our stop down one ATR above every single high fractal (marked out using manual rays and a public ATR indicator) for a good R:R, but that's not the point.
This is a made-up, retrofitted example with a fairly generic methodology. It's just to show how some of the features of this indicator could be used in trading:
• Market structure can give a bias. It can also mark interesting levels.
• Using multiple timeframes, while more complex, can level up your trading experience.
• Price trading back into order blocks can be a good R:R entry.
Your actual way of trading, your playbook of setups, your knowledge of your strengths and weakness as a trader, is your own.
🟩 LIMITATIONS
This indicator is intended for use on Forex markets, although order blocks and market structure do form on any reasonably liquid asset.
The HTF uses confirmed data, so you need to wait until the HTF bar is closed before the order block can form. Therefore it does not repaint, in the sense that people worry about repainting, of changing data in the past. We use the latest recommended method of fetching HTF data .
The market structure uses live chart data, so structure and order blocks that are created by conditions on an open realtime bar can appear and disappear as the current bar close changes. This is quite normal .
The Williams pivots are by definition only confirmed after a defined number of bars, and like everyone else we plot them offset into the past.
Similarly, we offset order blocks into the past so that they start on the candle that has the high or low that defines the order block, not the candle that created them. For HTF order blocks, we calculate the number of chart bars back assuming a 24-hour market, which gives accurate offsets only on Forex and other symbols that trade close to 24 hours each day.
🟩 COMPARISON WITH OTHER INDICATORS
There are a great number of market structure and order block indicators already published on TradingView. Since there are only a certain number of highs and lows on the chart from which to produce structure and order blocks, they all look somewhat similar. However, this indicator, written entirely from scratch without reference to the code of any other indicators, is unique and original in two kinds of ways: in patterns and in features.
PRECISE PATTERNS
We believe that edge in trading can be found in, amongst other things, precision in analysis. You can't truly trust your backtests if your system is not repeatable, and your system is repeatable only if its definitions are precise.
We trade with this indicator, and our students trade with it as well. Why did we spend months creating a new indicator instead of using one of the many existing ones, most of which are free and open source?
Because they are not quite how we wanted.
The indicator was created from our proprietary structure rules, which are based on the generally accepted understanding of market structure, with some specific tweaks.
To prepare this description (after the indicator is finished), we searched for "Market Structure", "CHoCH", and "SMC" and list below all popular (with over 3K boosts; excluding invite-only) indicators that show market structure with CHoCH (sometimes called MSS). We configured the settings to most closely match how our indicator works, added both indicators to the same chart, and looked for relevant differences.
The purpose of this section is not to try to say that this indicator is better than any other, but just that it is different. This difference is important for us and our students.
Indicator #1
As you can see, the indicator interpreted the first part of the chart as a downtrend, whereas ours interpreted it as an uptrend. The structure is completely different, because our Williams Fractal lookback is 2, and the minimum "Swing Points" value for Indicator #1 is 10. Although this indicator is deservedly popular, it isn't what we can use for the way we trade.
Indicator #2
Setting the "Zigzag Length" to 2 results in wildly different market structure, as shown below. For many fractals, this indicator does not place the zigzag at the highest high or lowest low, as ours does consistently. It does not highlight the trend in any way. It gives many Market Structure Breaks in a short period. Although it's again wildly popular, it doesn't match our way of encoding market structure.
Indicator #3
Again, setting the "Pivot lb" and "Pivot rb" inputs to 2 gives much too sensitive market structure. This is because this indicator does not require, as we do, a counter-fractal to form after a fractal in order to confirm a BOS. We believe that this rule gives less noisy structure while also being responsive. Most indicators attempt to compensate for this by having a much larger lookback period. While this does of course give fewer pivots and less noise, this is simply a different logic and gives different results. Note also that although this indicator correctly defines the first section of the chart as an uptrend, it does not draw a CHoCH line. As discussed above, our definition of market structure means that there should always be one and only one active CHoCH line, and we draw this at the earliest sensible opportunity.
Indicator #4
Again, the lack of any extra pivot confirmation logic means that this indicator creates different structure with the same lookback period. Also note the lack of initial CHoCH.
Indicator #5
The lowest lookback is 3, and so this indicator too gives very different structure.
Indicator #6
Of course, using a lookback of 2 gives different structure with this indicator too. For variety, here we show a lookback of 5, which is the lowest setting that returns significantly less noisy structure. You can see that the main CHoCH at the top of the chart is similar but not at the same place. Increasing the lookback does not ever result in a CHoCH at the same place, because the logic is simply different. When the lookback increases above 10, no CHoCH lines are drawn at the top at all.
Indicator #7
This indicator uses the highest/lowest price for the last 10 bars (fixed), along with some other bar conditions. You can see the resulting structure is quite different. Among other differences, it does not create a BOS at the top of the chart, even in an uptrend, and it does not create an opposing CHoCH when the existing CHoCH is broken.
Indicator #8
With "Custom" market structure and a length of 2, BOS and CHoCH lines are drawn by this indicator but in incongruous places.
Conclusion
Although we only illustrate the top few alternatives, we did check many, many others.
These market structure indicators may produce useful output, but their structure differs significantly from ours. We didn't even need to get into specific examples because the general approaches are so different. It is up to the user to decide which indicator, and which interpretation of market structure, best suits their needs.
ORDER BLOCKS
Continuing, we illustrate differences with the most popular order block indicators, trying to get them to match our order blocks. Note that some of these are also in the previous list as market structure indicators.
Order blocks are always formed at swings when price moves away with force, so they will be sort of the same across all the very many existing order block indicators. We are looking for precision and differentiation, as we did with market structure.
Indicator #1
This indicator does not have ability to display mitigated order blocks, only active ones. The order blocks do not match at all.
Indicator #2
With a period of 2, this indicator marks many of the same order blocks as ours. It doesn't extend the blocks, and doesn't mark them when mitigated. The logic for choosing the order block candle is also clearly different.
Indicator #3
Even with very sensitive settings, this indicator did not create as many order blocks as ours and they are quite different.
Indicator #4
Again you can see the logic for choosing candles and creating blocks is simply different. This indicator has inadequate protection against empty arrays, which causes runtime errors on charts with not much history (not a problem for Forex charts in general, but noticeable on the testing chart).
Indicator #5
We were unable to get the order blocks to extend with this indicator, although it should be possible. Anyway the blocks are wildly different.
Indicator #6
Even with the most sensitive settings, this indicator showed only one order block on our test chart.
Indicator #7
This indicator incorporates complex price action concepts. Nevertheless, the order blocks are very different indeed.
Indicator #8
This indicator forms quite different blocks to ours. It has several interesting settings including a choice of using the candle body or wick.
Indicator #9
We were not able to configure this indicator to produce the same order blocks as ours.
Indicator #10
On very sensitive settings, this indicator matches many of our order blocks, but at the same time many are different.
Conclusion
None of the indicators tested here (nor the many others we looked at previously) use the same logic as ours. The differences are so obvious that we don't have to call out individual blocks and analyse how they differ.
Fundamentally, other indicators seem to use variable precision for pivots in their order block detection calculations. Our order blocks are pure candle patterns with two different rulesets for Standard Order Blocks and Imbalance Order Blocks, and this logic does not change.
Note that our order blocks do not always automatically extend to the swing high or low, nor allow the user to choose the limit of the block, but use unique rules.
In summary, our indicator differs from other order block indicators in terms of fundamental detection logic, candle placement, boundary definition, mitigation levels, and logical states (see below).
UNIQUE COMBINATION OF FEATURES
In comparison to all other indicators we looked at, our indicator:
• Uses order blocks with three states: active, mitigated, and partially mitigated. Our mitigation lines for order blocks are rules-based. If price touches the mitigation line, the order block is considered fully mitigated. If price goes inside the order block but does not hit the mitigation line, it is only partially mitigated. These three states are visually distinguished.
• Has the most extensive visual customisation options of all those we looked at. We believe that being able to customise how you see indicator outputs is very important for reducing mental load while analysing and trading.
• Has a unique feature that combines market structure and order blocks, where the user can choose to show pro-trend order blocks (bullish blocks that are formed in bullish structure and vice-versa) or counter-trend blocks (bullish blocks that are formed in bearish structure and vice-versa).
• Approximates an initial trend bias very quickly, so we can start creatng BOS, CHoCH, etc.
• Requires a counter pivot to confirm a BOS line. This seemingly small logical step actually creates very different structure, as we saw in the comparison section.
• Uses a sophisticated array-based sorting mechanism to preserve the selected number of imbalances, use the rest of the TradingView box allowance for order blocks, and delete excess order block objects (not just drawings) in reverse historical order.
• Hides order block drawings if they are a configurable distance away from price. Magically redraws them if price moves closer.
• Includes an equivalent to the system "Calculated bars" setting for the high timeframe, to avoid unnecessary processing and improve performance.
🟩 CODING CONSIDERATIONS
This indicator consists of all original code written by @SimpleCryptoLife for Timeframe_Titans.
AI was used for the following purposes:
• Autocomplete
• Checking that bullish and bearish logic is parallel in a given function
• Querying the names and locations of variables hundreds of lines away when we forgot what they're called, like an expensive search-and-replace
• Help with debugging (it usually makes up elaborate and wrong ideas though)
It was not used to replace the coder's expertise and creativity, or to "vibe-code" some black-box functionality we didn't understand. We can recommend that you use AI the same way.
═════════════════════════════════════════════════════════════