Search in scripts for "EMA RIBBON"

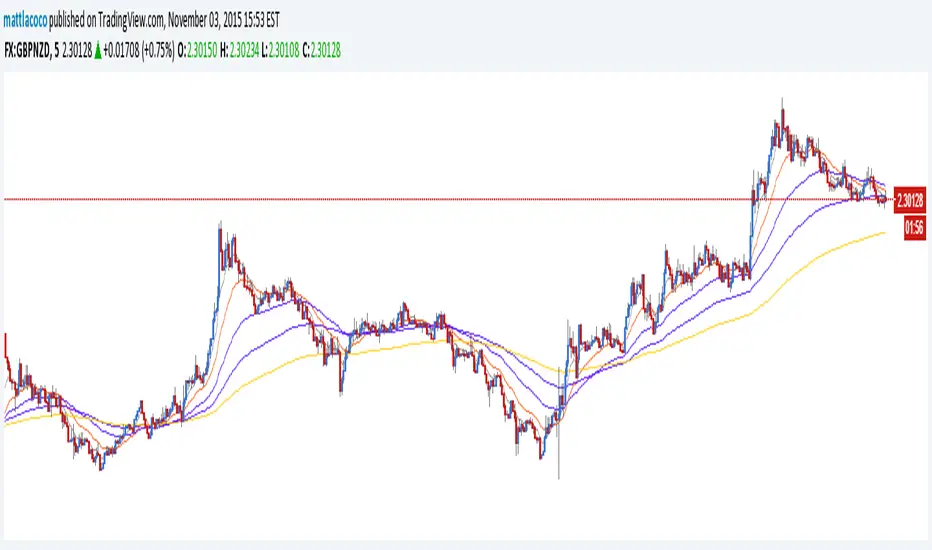
Rhino Trader Colors ribbonEMA Ribbon for Rhino Trader Colors strategy.
- includes 8, 21, 50, 100 and 200 ema in one.
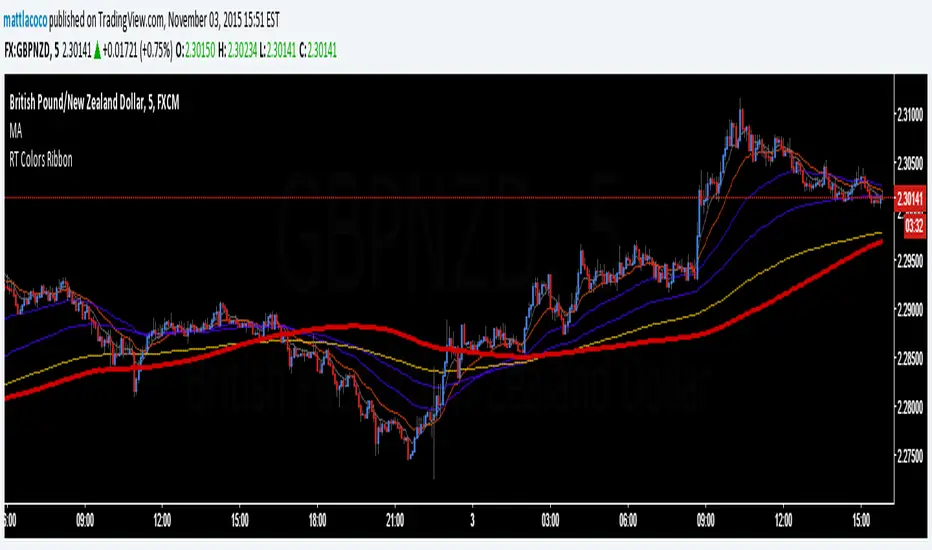
Rhino Trader Colors ribbonEMA Ribbon for Rhino Trader Colors strategy.
- includes 8, 21, 50, 100 and 200 ema in one.


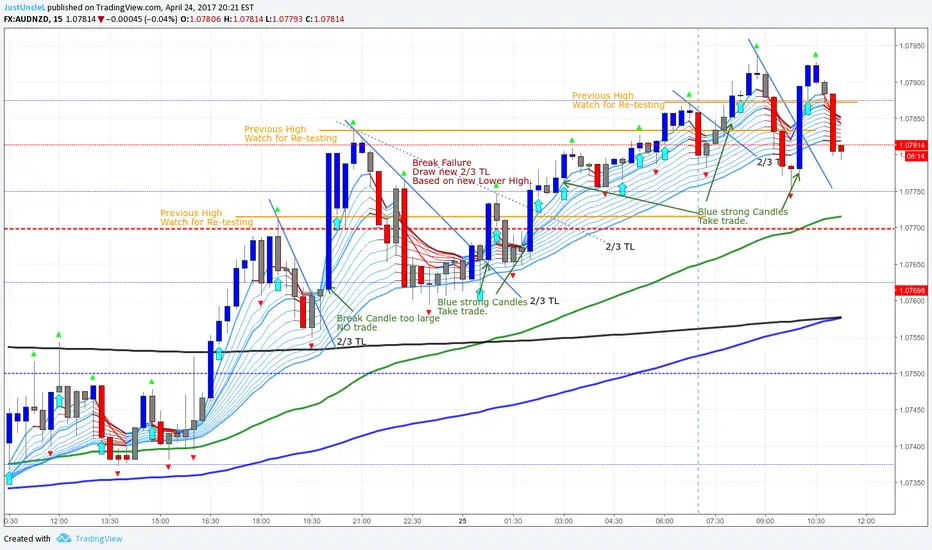
Pullback Trading Tool R5-65 by JustUncleLBy request this is an updated version of the "PullBack Trading Tool": removes experimental "OCC" channel, added option to display ribbons or just single moving average lines, added alert arrows for "PB" exits, added alertcondition for TV alarm subsystem, added some extract options for Pivot points and general cleanup of code.
Description:
This project incorporates the majority of the indicators needed to analyse and trade Trends for Pullbacks, swings and reversals.
Incorporated within this tool are the following indicators:
1. Major industry (Banks) recognised important EMAs in an EMA Ribbon:
Lime = EMA5 (Optional Display)
DodgerBlue = EMA12 (Optional Display)
Red = EMA36 (Optional display)
Green = EMA89
Blue = EMA200
Black = EMA633
2. The 5 EMA (default) High/Low/Close Price Action Channel (PAC), the PAC channel display is disabled by default.
3. Optionally display Fractals and optional Fractal levels
4. Optional HH, LH, LL, HL finder.
5. Optional Buy/Sell "PB" exit Alerts with Optional 200EMA filter.
6. Coloured coded Bar high lighting based on the PAC:
blue = bar closed above PAC
red = bar closed below PAC
gray = bar closed inside PAC
7. Alert condition sent to TradingView's Alarm subsystem for PB exits.
8. Pivot points with optional labels.
9. EMA5-12 Ribbon is displayed by default.
10.EMA12-36 Ribbon is displayed by default
Set up and hints:
I am unable to provide a full description here, as Pullback Trading incorporates a full trading Methodology, there are a number of articles and books written on the subject.
Set the chart to Heikin Ashi Candles (optional).
I also add a "Sweetspot Gold R3" indicator to the chart as well to help with support and resistance finding and shows where the important "00" lines are.
First on a weekly basis say Sunday night or Monday morning, analyse the Daily and Weekly charts to establish overall trends, and support/resistant levels. Draw significant mini trend lines (2/3 TL), vertical trend lines (VTL) and S/R levels. Can use the Pivots points to guide VTL drawing and Fractals to help guide 2/3 TL drawing.
Once the trend direction and any potential major reversals highlighted, drop down to lower timeframe chart and draw appropriate mini Trend line (2/3 TL) matching the established momentum direction. Take note of potential pull backs from and of the EMAs, in particular the EMA5-12 ribbon, EMA12-36 Ribbon and the 200EMA. Can use the Pivots and/or Fractals points to guide your 2/3 TL drawing.
Set a TradingView alarm on the "PBTOOL alert", with the default settings this normally occurs before or during the Break of the manually drawn TL lines.
Once alerted check to see if the TL is broken and is returning to trend away from the EMA lines, this is indicated by bar colour change to trend directional colour.
You can trade that alert or drop down to even lower time frames and perform the same TL analysis there to find trades at the lower TF. Trading at lower TF you will allow tighter Stop loss settings.
Other than the "SweetSpot Gold R3" indicator, you should not need any other indicator to successfully trade trends for Pullbacks and reversals. If you really want another indicator I suggest a momentum one for example: AO ( Awesome Oscillator ), MACD or Squeeze Momentum.
EMA Enhanced w/ Cross & AlertsThis indicator provides a comprehensive view of market trends using a "rainbow" of Exponential Moving Averages (EMAs), coupled with cross detection and alerts. It's designed to help traders identify potential entry and exit points based on the interplay of short, mid, and long-term trends, and based on my own personal back testing.
Key Features:
EMA Rainbow: Plots 8, 13, 21 (short-term Fibonacci EMAs), 50 (mid-term), 100, 200 (long-term), and 800 (very long-term) EMAs. These default lengths are based on backtesting and represent optimal values for this indicator.
EMA Ribbon: Visually represents the strength and momentum of trends by filling the areas between EMAs.
Cross Detection with Confirmation: Identifies bullish and bearish crosses between the 8/13/21 EMAs and the 50/200 EMAs, with confirmation requiring the closing price to be on the correct side of the crossing EMA.
Visual Alerts: Plots up and down triangles to indicate bullish and bearish crosses.
Background Coloring: Colors the chart background based on the 50/200 and 8/13/21 crosses, providing immediate visual cues.
Alert Conditions: Generates alerts for bullish and bearish crosses, allowing for automated trading strategies.
Input Customization: Users can modify EMA lengths and toggle cross and ribbon displays.
Strategy Overview:
Short-Term (8, 13, 21 EMAs - Fibonacci): These EMAs are used to identify short-term trends and potential entry/exit points. The 8,13,21 sequence is based on Fibonacci numbers, and is used to identify very short term momentum. A bullish crossover of these EMAs, confirmed by price, suggests upward momentum, while a bearish crossover indicates downward momentum.
Mid-Term (50 EMA): The 50 EMA acts as a gauge for mid-term trends. A crossover of the 50 EMA above the 200 EMA signals a potential shift to a bullish trend, and a crossover below signals a potential shift to a bearish trend.
Long-Term (100, 200, 800 EMAs): These EMAs provide a broader perspective on long-term trends. The 200 EMA, in particular, is widely used to define the overall market trend. The 800 EMA is used to identify very long term trends, and is also helpful as the last line of support and resistance on lower timeframes.
Crosses: The script generates signals based on crosses. When the short term emas cross above the mid and long term emas, this is a very bullish signal. When the short term emas cross below the mid and long term emas, this is a very bearish signal. The 50/200 cross is used to identify macro trend changes.
Ribbon: The ribbon can be used to identify trend strength. A wide ribbon indicates a strong trend, while a narrowing ribbon may signal a weakening trend or potential reversal.
Time Frame & Trading Type: The selection of EMA's is intentional and can be used on any time frame, for Sculp, Intraday and Swing Trading.
How to Use:
Add the indicator to your TradingView chart.
Observe the EMA rainbow and ribbon for trend direction and strength.
Look for bullish and bearish crosses, confirmed by price action.
Use the visual alerts and background coloring to quickly identify potential trading opportunities.
Customize the input settings to match your trading style and preferences.

S/R + FVG + 3EMA + Consolidation IndicatorApex Trader Toolkit: S/R, FVG, EMAs & Consolidation
I used AI and combined 4 of my favorite trading view indicators: 3 EMA's, Consolidation detectors, FVG sessions and automatic support and resistant bands and i made it into one super indicator, the result is amazing. I will be updating this script with more powerful indicators in the future.
TRY THIS OUT AND SHARE IDEAS AND FEEDBACK IN COMMENTS.
This comprehensive indicator brings together essential trading tools into a single, customizable view, empowering you to make informed decisions with ease. The Apex Trader Toolkit combines Support and Resistance levels, Session Fair Value Gaps (FVG), Exponential Moving Averages (EMAs), and Consolidation Zone detection. Each component can be independently toggled on or off to suit your specific trading style and chart preferences.
Key Features:
Support and Resistance Levels:
Identifies potential areas of price reversals using pivot points.
Adjustable lookback periods for fine-tuning sensitivity.
Visual cues adapt dynamically based on price action (color-coded for above/below price).
Option to use close price or high/low for pivot calculations.
"Quick" S/R levels for shorter-term analysis.
Fair Value Gaps (FVG) with Session Ranges:
Highlights imbalances in price action, indicating potential future price movement.
Bullish and bearish FVG detection.
Automatic mitigation tracking.
Daily session range markers (high and low).
3-EMA Ribbon:
Plots three customizable Exponential Moving Averages (EMAs) to visualize trend direction and potential dynamic support/resistance.
Adjustable EMA lengths.
Consolidation Zone Detection:
Identifies periods of sideways price action, highlighting potential breakout or continuation opportunities.
Adjustable minimum zone length and ATR-based range calculation.
Option to limit the historical display of consolidation zones for clarity.
Customization:
Each feature of the Apex Trader Toolkit is fully customizable, allowing you to:
Enable or disable individual components via global toggle switches.
Adjust lookback periods, color schemes, and other parameters.
Tailor the indicator to your specific trading strategy and market conditions.
How to Use:
The Apex Trader Toolkit provides a multifaceted approach to market analysis. Use it to:
Identify potential entry and exit points based on Support and Resistance levels.
Anticipate future price movement using Fair Value Gap detection.
Determine trend direction and dynamic support/resistance with the 3-EMA ribbon.
Spot potential breakout opportunities with Consolidation Zone highlighting.
Disclaimer:
This indicator is for informational and educational purposes only. Trading involves risk, and past performance is not indicative of future results. Always conduct thorough research and consult with a qualified financial advisor before making any investment decisions.

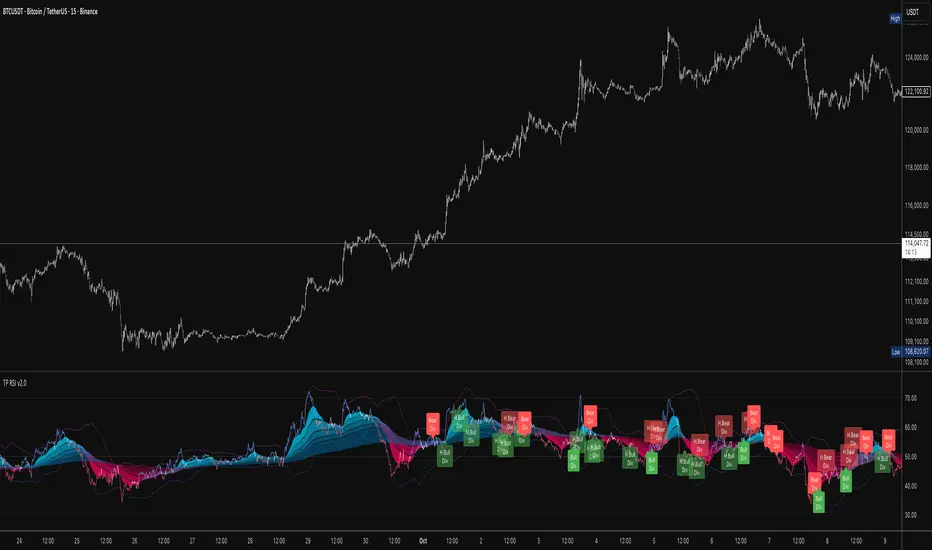
TP RSITP RSI - Integrated Trend, Momentum, and Volatility Analyzer
The TP RSI indicator is an innovative 3-in-1 technical analysis tool that combines RSI, Bollinger Bands, and an EMA ribbon to provide traders with a comprehensive view of trend, momentum, and volatility in a single, easy-to-interpret visual display.
Why This Combination? This mashup addresses three critical aspects of market analysis simultaneously:
Trend identification and strength (EMA ribbon)
Momentum measurement (RSI)
Volatility assessment (Bollinger Bands)
By integrating these components, traders can make more informed decisions based on multiple factors without switching between different indicators.
How Components Work Together:
1. EMA Ribbon (Trend):
10 EMAs form 5 color-coded bands
Blue: Uptrend, Red: Downtrend
Provides a nuanced view of trend strength and potential reversals
2. RSI (Momentum):
Color-coded for quick interpretation
Blue: Upward momentum, Red: Downward momentum, White: Neutral
Position relative to the ribbon offers additional insight
3. Bollinger Bands (Volatility):
Applied to RSI for dynamic overbought/oversold levels
Narrow bands indicate low volatility, suggesting potential breakouts
Unique Aspects and Originality:
Synergistic visual cues: Color coordination between ribbon and RSI
Multi-factor confirmation: Requires alignment of trend, momentum, and volatility for strong signals
Volatility-adjusted momentum: RSI interpreted within the context of Bollinger Bands
How these components work together:
Buy Signal: Blue ribbon with blue RSI outside the ribbon.
Sell Signal: Red ribbon with red RSI outside the ribbon.
Neutral: White RSI or RSI inside the ribbon (not recommended for trading)
Increasing Momentum: RSI crossing above upper Bollinger Band (upward) or below lower Band (downward).
Trend Strength: RSI rejection by the ribbon, while all bands are colored along with the trend direction, identifies a strong trend.

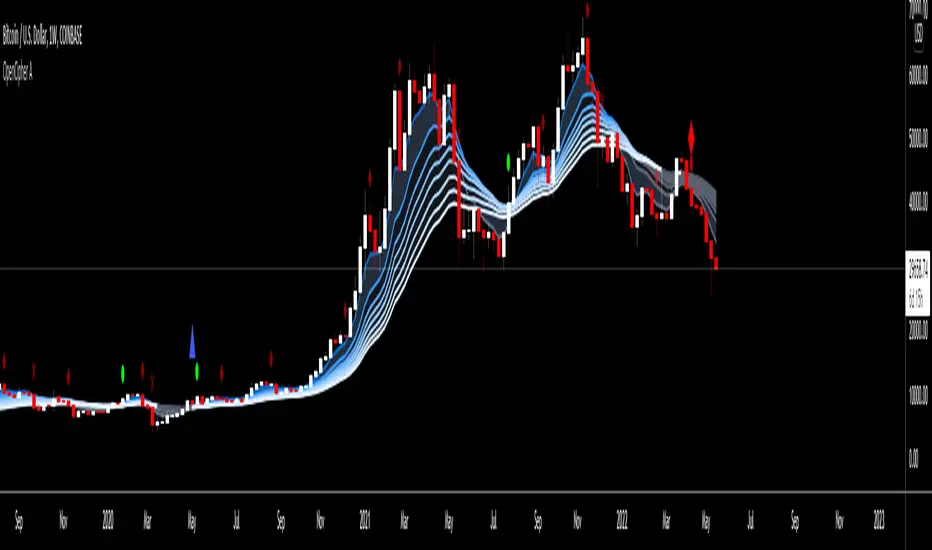
OpenCipher AOpenCipher A is an open-source and free to use Overlay.
Features:
EMA Ribbons (Lengths: 5, 11, 15, 18, 21, 25, 29, 33)
Symbols ("Be careful" and "attention required" signals)
EMA Ribbons
The EMA RIbbons are a set of exponential moving averages. Blue and white ribbons = uptrend, gray ribbons = downtrend. The ribbons can act as support in uptrends and as resistance in downtrends.
Lengths and source of the ribbons are customizable.
Symbols
Green Dots: The green dot is a bullish symbol that appears whenever the EMA 11 crosses over EMA 33.
Red Cross: The red cross is a bearish symbol that appears whenever the EMA 5 crosses under EMA 11.
Blue Triangle: The blue triangle marks a possible trend reversal that appears whenever the EMA 5 crosses over EMA 25 while EMA 29 is below EMA 33.
Red Diamond: The red diamond is a bearish symbol that marks a potential local top whenever a bearish wavecross occurs (fast wave crosses under slow wave).
Yellow X: The yellow X is a warning signal that appears whenever a bearish wavecross occurs while the slow wave of the wavetrend is below -40 and the moneyflow is in the red (below zero).
Blood Diamond: The blood diamond is a bearish symbol that highlights whenever the red diamond and the red cross appear on the same candle.
Usage
Treat the symbols as signs that your attention might be required and don't trade based on them.
Spliv's EMA Ribbon/MA ComboEMA and MA combo with many EMAs to create ribbons.
21ema|50-55ema|89-100ema|200ema|377ema|10s|30s|100s|200s

Scalping PullBack Tool R1 by JustUncleLDescription
This study project is a Scalping Pullback trading Tool that incorporates the majority of the indicators needed to analyse and scalp Trends for Pull Backs and reversals on 1min, 5min or 15min charts. The set up utilies Heikin Ashi candle charts. Incorporated within this tool are the following indicators:
1. Major industry (Banks) recognised important EMAs in an EMA Ribbon:
Green = EMA89
Blue = EMA200
Black = EMA633
2. The 36EMA (default) High/Low+Close Price Action Channel (PAC).
3. Fractals
4. HH, LH, LL, HL finder to help with drawing Trend lines and mini Trend Lines.
5. Coloured coded Bar high lighting based on the PAC:
blue = bar closed above PAC
red = bar closed below PAC
gray = bar closed inside PAC
red line = EMA36 of bar close
Setup and hints:
Set the chart to Heikin Ashi Candles.
Add "Sweetspot Gold10" indicator to the chart as well to help with support and resistance finding and shows where the important "00" and "0" lines are.
When price is above the PAC(blue bars) we are only looking to buy as price comes back to the PAC
When price is below the PAC(red bars), we are only looking to sell when price comes back to the PAC
What we’re looking for when price comes back into the PAC we draw mini Trendlines utilising the Fractals and HH/LL points to guide your TL drawing.
Now look for the trend to pull back and break the drawn TL. That's is when we place the scalp trade.
So we are looking for continuation signals in terms of a strong, momentum driven pullbacks (normally short term 10-20 pips) of the EMA36.
The other EMAs are there to check for other Pullbacks when EMA36 is broken.
Other than the SweetSpot Gold10 indicator, you should not need any other indicator to scalp the pullbacks.
References:
Fractals V8 by RicardoSantos
Price Action Trading System v0.3 by JustUncleL
SweetSpot Gold10 R1 by JustUncleL
www.swing-trade-stocks.com
www.forexstrategiesresources.com

GC Magic Overlay V2This script is based on Guppy method (www.guppytraders.com
) , it was introduced to me by fellow trader @nmike. I am using this script in conjunction to Clones ,Harmonic and other tools.
Script Function:
a. Script plots the fast and slow Exponential moving averages as ribbons.
EMA's used
EMA (close): 25,30,35,40,45,50,55 (Green)
EMA (close): 89,99,109,119,129,139,149 (Red)
b. It draws the Circle dots in Pink for Sell and Black for Buy.
Script Parameters:
a. EMA : 2 emas for cross
b. Signal Exponential moving average
c. which time frame to Plot the above Signal Exponential
d. Show Guppy Slow - Red - Toggle to show red emas on chart
e. Show Guppy Fast - Green- Toggle to show green emas on chart
How to Trade:
a. Wait for the Pink/Black Dot to appear on Chart
b. Do not take trade immediately after the dot appears. Wait for the price to retrace back and touch the ema ribbons.This will keep you away from fake breakouts.
c. Rentries : in examples below
Examples:

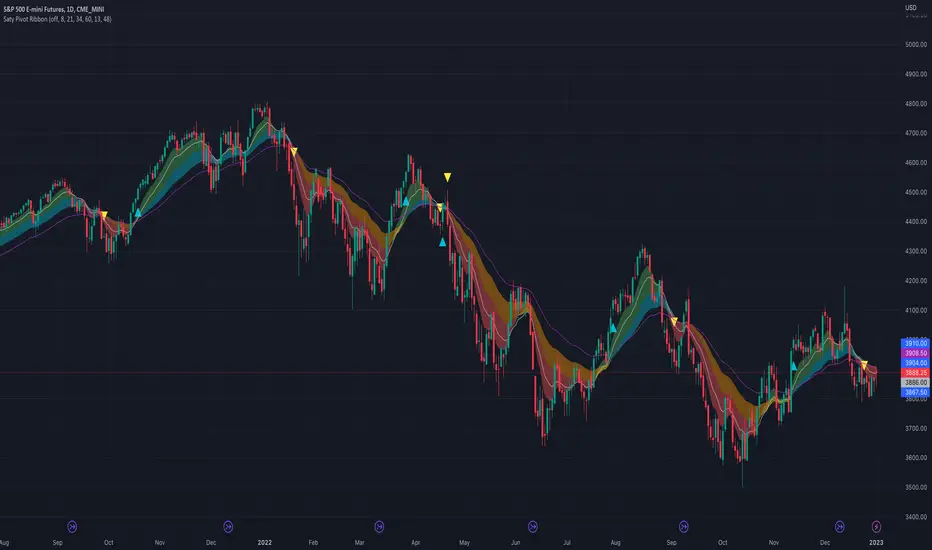
Saty Pivot RibbonA 3 EMA Ribbon + Conviction EMAs system that simplifies measuring and using EMAs for trend and support/resistance . If you are familiar with using a faster EMA (8 or 9) with a pivot EMA (21) you should feel right at home.
Features include:
- 3 EMA Trend Ribbon (8, 21, 34 default)
- 2 color system for showing bullish trend (green + blue)
- 2 color system for showing bearish trend (red + orange )
- Ribbon folding visual indicates EMA crossover
- Conviction Arrows based on 13/48 EMA crossover
- 13/48 Conviction EMAs
- Time Warp: Warp the Ribbon into a different timeframe than the chart.
Inspired by Ripster EMA Clouds.
Cloud Ribbon ++ by [JohnnySnow]Inspired by my favorite EMA ribbon - "EMA Ribbon " by fskrypt.
This Ribbon ADD the option to choose the avarage algorithm of the ribbon .
Created also to be more friendly to read along with trendlines and Fibonacci retracements.
For those like me that NOT use this ribbon to find exact price action but instead, to have a grasp of possible Support/Resistance strenght ahead.
High transparency lines and a configurable color palette for filling the background give the ribbon a look of support/ Resistance cloud Strenght.
Each MA length, line, and background color can be easily configured.

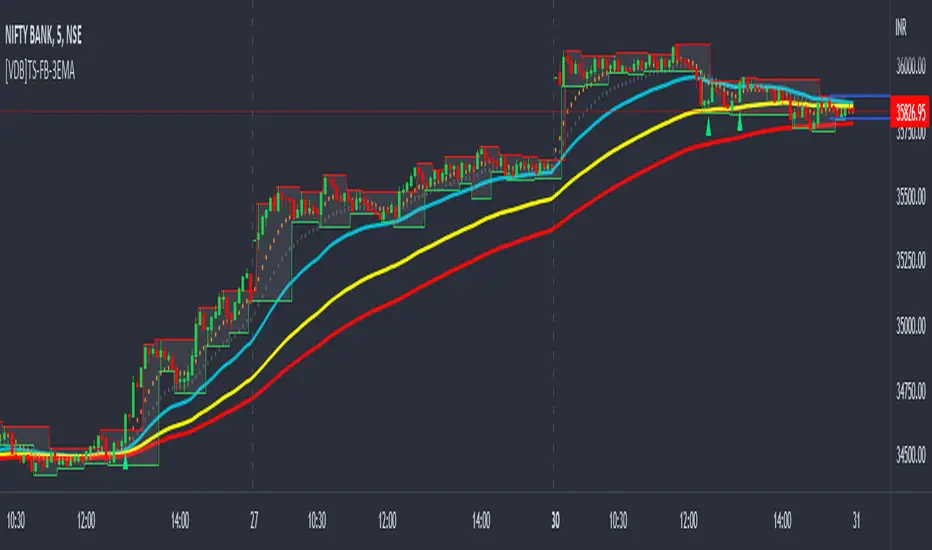
[VDB]TrendScalp-FractalBox-3EMAThere are many indicators with William’s Fractal and Alligator. As many use EMA’s it may be useful to define a 3-EMA ribbon and combining Fractal Levels/Box (filling background between top and bottom fractals) for trend scalping. I searched for this kind of indicator in community – some show fractals, some just levels, some with alligator etc. but couldn't find the one needed. Hence thought of this indicator which may be of interest to other users too.
Key Points:
EMA ribbon is created using 3 EMA’s 35/70/105. Users can change these as per their preference. This is used for trend identification – 1. Bullish bias if Price > EMA1 > EMA2 > EMA3. 2. Bearish bias if Price < EMA1 < EMA2 < EMA3.
Background is marked during crossing of EMA1 and EMA2 to alert possible trend change.
5-bar fractals are used to mark the Fractal levels and background between top and bottom fractals are filled to create a Fractal Box.
Fractal levels are marked only when the fractal formation is complete. Given offset is used this is lagging.
How to Use:
Sloping EMA ribbon is used for identifying the trend.
Fractal box break-out/ break-downs are used to trigger the trade with fractal high/low for entry/SL. Waiting for price contraction towards EMA ribbon resulting in smaller boxes is key to initiate trade. Avoid bigger boxes as SL’s will be big and price may move within. To draw the vertical lines of FractalBox change fractal level0 style to step-line.
This indicator combined with the cycle high/low (overbought/oversold) indicators such as CCI/Stochastic/RSI etc. can make it a good trend scalping setup while trading in the direction of momentum in higher timeframe.
This setup could be used for any timeframes. Do your back-testing before using it in live market.
This indicator was achieved by combing some fractal ideas from “Fractal and Alligator Alerts by JustUncleL”
DISCLAIMER : This indicator has been created for educational reference only and do not constitute investment advice. This indicator should not be relied upon as a substitute for extensive independent market research before making your actual trading decisions. Market data or any other content is subject to change at any time without notice. Liability for any loss or damage, including without limitation any loss of profit, which may arise directly or indirectly from use of this indicator is accountability of user using it.
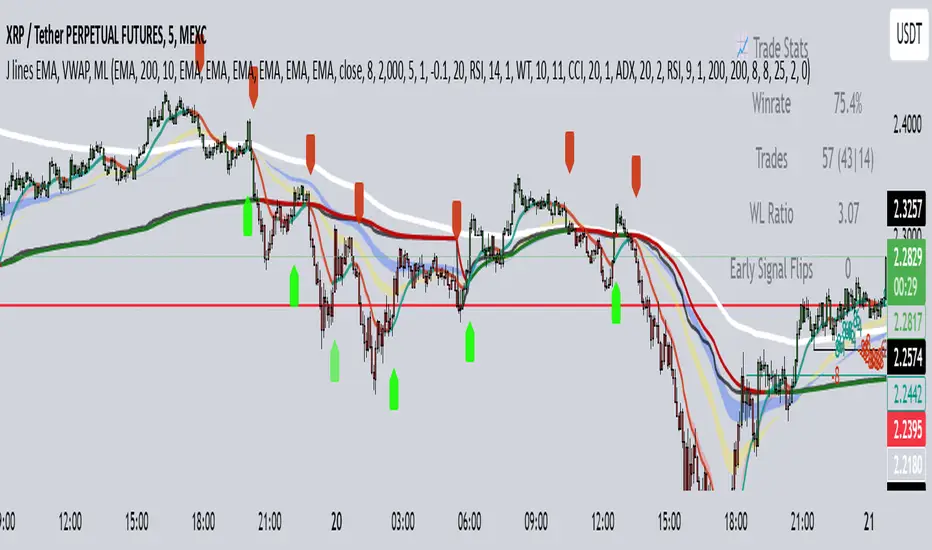
J Lines EMA + VWAPThe EMA + VWAP indicator combines the power of Exponential Moving Averages (EMA) with the Volume Weighted Average Price (VWAP) to help traders spot trends, identify potential entries/exits, and understand market momentum with ease. This dual-purpose tool is designed to give both beginner and experienced traders a clear view of price direction and volume influence, whether for day trading or swing trading.
Key Features:
Dynamic EMA Lines:
Six customizable moving averages (EMA by default) adapt to your selected timeframe. EMAs help track trend direction and strength, with various colors and opacity settings that visually separate them for clarity.
VWAP Tracking: A standalone VWAP line (blue) shows the average trading price adjusted for volume, making it ideal for pinpointing significant price levels where institutional interest often lies.
EMA Ribbons for Trend Confirmation: Soft-colored ribbons are placed between EMA pairs to make the trend strength visually apparent, with different color fills between lines. This makes it easy to gauge bullish or bearish conditions at a glance.
Flexible MA Options: Besides EMA, you can choose from SMA, WMA, HMA, and RMA, allowing you to adapt the indicator to various trading strategies.
This tool simplifies trend-following and volume-based analysis by giving you insight into both price momentum and market participation levels. EMAs adapt to volatility and changing market conditions, while the VWAP keeps you aware of critical price zones based on trading volume. Together, these help you stay on the right side of the market, avoid false breakouts, and make informed decisions on when to enter or exit trades.
Ideal for beginners due to its visual clarity and flexible enough for seasoned traders, EMA + VWAP is your go-to indicator for a structured approach to market trends.
21/55 EMA Cloud w/ Optional RibbonThis indicator behaves like a traditional EMA ribbon by using the 21, 25, 30, 35, 40, 45, 50, and 55 bar exponential moving averages. In this particular indicator, the traditional EMA ribbon lines are turned off by default leaving only a filled in area between the 21 and 55 bar averages. The filled in area is green when the 21 bar average is greater than the 55 and red otherwise. Additionally, the 9, 100, and 200 exponential moving averages are available for reference.
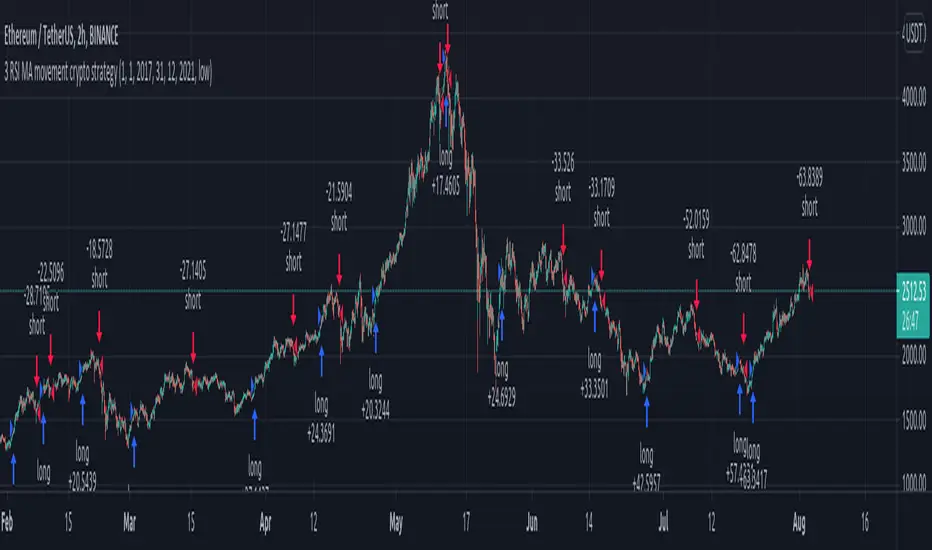
3 RSI 6sma/ema ribbon crypto strategyThis is a very efficient swing trading strategy designed for crypto long timeframes like 2h+.
Initially we have 3 RSI .
AFter that we use them as source for 6 SMA/EMA for each RSI, 5, 30, 50, 70, 90, 100. With those we create a ribbon that we are going to use in order to check the direction of the trend.
Rules for entry:
For long : if either all the SMA/EMA's from the 2nd RSI are telling us to go long, or all the all SMA/EMA's from the 3rd rsi are telling us to go long F
For short : if either all the SMA/EMA's from the 2nd RSI are telling us to go short, or all the all SMA/EMA's from the 3rd rsi are telling us to go short
We exit when we get an opposite condition than the entry one.
Caution: this strategy has no risk management inside, so use it with caution. If you have any questions , let me know !
Scalping PullBack Tool + RSI CrossoverThis Pine Script code is designed for **scalping trading strategies** by combining **Price Action Channel (PAC) & RSI Crossover signals**. It provides trend visualization, buy/sell signals, and alerts.
---
## **📌 Features:**
### ✅ **1. Price Action Channel (PAC)**
- A channel based on **Exponential Moving Averages (EMAs)**:
- `pacC`: EMA of closing price
- `pacL`: EMA of low price
- `pacU`: EMA of high price
- Used to detect price **pullbacks and breakouts**.
### ✅ **2. Exponential Moving Averages (EMAs)**
- Three EMAs to determine trend direction:
- **Fast EMA (89)**
- **Medium EMA (200)**
- **Slow EMA (600)** (optional)
- Trend is **Bullish** if `fastEMA > mediumEMA` and `pacL > mediumEMA`, and **Bearish** if `fastEMA < mediumEMA` and `pacU < mediumEMA`.
### ✅ **3. RSI Crossover System**
- **Relative Strength Index (RSI)** is calculated to measure momentum.
- **RSI-based EMA (9-period EMA of RSI)**
- **Buy Signal**: RSI crosses **above** RSI-EMA & RSI-EMA > 50.
- **Sell Signal**: RSI crosses **below** RSI-EMA & RSI-EMA < 50.
### ✅ **4. Visualization**
- **PAC Channel Fill**: Gray shading to highlight the price channel.
- **EMA Ribbons**: Green (Fast), Blue (Medium), Black (Slow).
- **Bar Coloring**:
- **Blue** if price > PAC upper band.
- **Red** if price < PAC lower band.
- **Background Coloring**:
- **Green** for bullish trends.
- **Red** for bearish trends.
- **Yellow** for neutral.
### ✅ **5. Alerts for Buy/Sell**
- **Buy Alert**: When RSI crosses **above** RSI-based EMA.
- **Sell Alert**: When RSI crosses **below** RSI-based EMA.
---
## **🛠 How to Use:**
1. **Apply the script** to a TradingView chart.
2. **Enable EMA and PAC Channel** to see trend direction.
3. **Watch for Buy/Sell signals**:
- **Green ‘BUY’ label** below bars.
- **Red ‘SELL’ label** above bars.
4. **Use alerts** to notify you of trading opportunities.
---
### **🔍 Summary**
This script helps scalpers and short-term traders **identify pullbacks & momentum shifts** using **PAC and RSI crossovers**. It provides clear **visual indicators & alerts** to assist in **quick decision-making**.
Let me know if you need modifications or explanations for specific parts! 🚀

Cloud & Ribbon Moving AveragesGreat for reversals, entry points for long & short positions.
Clouds change colors when crossover between 2 MA's occur.
Options for:
5-12 Day EMA
34-50 day EMA
150-200 day SMA
8-9 Day EMA Ribbon

Scalping + rsi ### **Description of the "Scalping + RSI" TradingView Script**
This TradingView script is designed for scalping and trend-following trading strategies. It combines multiple indicators, including **Exponential Moving Averages (EMAs), Price Action Channel (PAC), Fractals, and RSI-based signals**, to identify trend pullbacks and reversals. The script is best suited for **short time frames (e.g., 1-minute to 15-minute charts)** but can also work on higher time frames.
---
## **📌 Features of the Script**
### **1. EMA Ribbon for Trend Confirmation**
- Uses three EMAs to detect trends:
- **Fast EMA (Default: 89)**
- **Medium EMA (Default: 200)**
- **Slow EMA (Default: 600)**
- Trend Background Color:
- **Green** → Uptrend (Fast EMA & PAC above Medium EMA)
- **Red** → Downtrend (Fast EMA & PAC below Medium EMA)
- **Yellow** → Transition Zone (Indecisive Trend)
---
### **2. Price Action Channel (PAC)**
- A dynamic channel based on the EMA(34) of the **high, low, and close** prices.
- Helps in identifying pullbacks and breakout opportunities.
- **Bar Coloring Based on PAC:**
- **Blue Bars** → Price is above the PAC (Bullish)
- **Red Bars** → Price is below the PAC (Bearish)
- **Gray Bars** → Price is inside the PAC (Neutral)
---
### **3. Fractal Recognition for Support & Resistance**
- **Regular Fractals** → Detects highs and lows to mark important price levels.
- **Bill Williams (BW) Fractals** → Filters out ideal fractal patterns.
- Fractals help in drawing mini trendlines and breakout confirmations.
---
### **4. Higher High (HH), Lower High (LH), Higher Low (HL), Lower Low (LL) Markers**
- Identifies trend structures:
- ** (Higher Highs)** → Uptrend confirmation
- ** (Lower Highs)** → Potential downtrend
- ** (Higher Lows)** → Possible bullish reversal
- ** (Lower Lows)** → Possible bearish continuation
---
### **5. RSI-Based Buy/Sell Signals 📈📉**
- Uses **Relative Strength Index (RSI)** to generate trade signals.
- **Buy Condition:**
- RSI crosses above its EMA
- RSI-EMA is above the 50 threshold (bullish momentum)
- **Sell Condition:**
- RSI crosses below its EMA
- RSI-EMA is below the 50 threshold (bearish momentum)
- **Arrows on the chart show Buy (Green) and Sell (Red) signals.**
---
### **6. Alerts for Buy & Sell Signals 🔔**
- Sends an alert when:
- A Buy signal is triggered (`RSI crosses above EMA`)
- A Sell signal is triggered (`RSI crosses below EMA`)
- These alerts can be used for **manual trading or automation with webhooks**.
---
## **📊 How to Use This Strategy?**
1. **Check the Trend Background Color**
- **Green** = Look for Buy Signals
- **Red** = Look for Sell Signals
- **Yellow** = Wait (No Clear Trend)
2. **Identify a Pullback into the PAC**
- Look for price moving **inside the PAC** (gray bars).
- Wait for price to **break back out** of the PAC in the trend direction.
3. **Confirm with RSI Buy/Sell Signals**
- **Buy when RSI crosses above its EMA (and above 50)**
- **Sell when RSI crosses below its EMA (and below 50)**
4. **Use Fractals & HH/LH/HL/LL for Additional Confirmation**
- Fractals can help with drawing **mini trendlines**.
- Breakouts of fractal-based trendlines confirm trade entries.
---
## **🎯 Best Settings for Scalping**
- **For Short-Term Scalping (1min - 5min charts):**
- Fast EMA: `55`
- Medium EMA: `144`
- Slow EMA: `377`
- PAC Length: `21`
- RSI Length: `14`
- RSI EMA: `9`
- **For Higher Timeframes (15min - 1H charts):**
- Fast EMA: `89`
- Medium EMA: `200`
- Slow EMA: `600`
- PAC Length: `34`
- RSI Length: `14`
- RSI EMA: `9`
---
### **🚀 Advantages of This Script**
✅ **Great for Scalping & Trend Trading**
✅ **Uses Multiple Indicators for Confirmation**
✅ **Clear Buy & Sell Signals Based on RSI**
✅ **Customizable EMA & PAC Settings**
✅ **Works on Any Market (Stocks, Forex, Crypto, etc.)**
