DR/IDR fractals break candle (ChadAnt)This indicator is an Opening Range Breakout (ORB) tool. It identifies the high and low price range established during a specific time window (e.g., the first hour of trading, 9:30–10:30 AM NY time). Once that time window closes, it watches for the price to "break out" of that range and projects profit targets based on the size of the initial range.
Key Features & How They Work
1. The Opening Range (The Box)
Time Window: The indicator waits for your specific start time (default 9:30 AM NY). It does not draw anything before this time.
The "Wicks": It tracks the absolute highest and lowest prices reached during this time (the Wicks). These act as your Breakout Triggers.
The "Body": It tracks the highest and lowest candle closes/opens during this time. This creates a shaded "zone" on your chart, representing the core area where most trading occurred.
Shading: To keep your chart clean, the background shading only appears during the forming time window.
2. Breakout Signals
Once the time window ends (e.g., 10:30 AM), the indicator "locks" the levels.
It then waits for a candle to move above the Wick High or below the Wick Low.
The Signal: When this happens, a label ("BREAK") appears on the chart.
Green Label: Bullish breakout (price went above the range).
Red Label: Bearish breakout (price went below the range).
Note: It only signals the first breakout of the day to avoid false alarms during choppy markets.
3. Extension Targets (Profit Levels)
When a breakout signal occurs, the indicator automatically draws target lines (extensions).
Calculation: These targets are based on the height of the "Body" zone (the shaded area).
Example: If your setting is 1.0, the indicator measures the height of the shaded body range and projects that exact distance above the breakout point. This is often used as a "Measured Move" target.
You can customize how many lines appear and how far apart they are (e.g., 0.5, 1.0, 1.5 times the range size).
4. Williams Fractals
During the opening range time, the indicator looks for specific price patterns called "Williams Fractals" (a 5-candle pattern that highlights potential turning points).
If a fractal peak or valley occurs inside your opening range, it marks it with a small triangle (▲ or ▼). Traders often use these as early signs of support or resistance forming inside the range.
5. Clean Visuals
Line Cutoff: You can set a "Stop Time" (e.g., 16:00 or 4:00 PM). The lines will stop drawing at that time so they don't clutter your chart overnight.
Gap Handling: The lines are programmed to break cleanly between days, so you don't see messy diagonal lines connecting yesterday's close to today's open.
Summary of Settings You Can Change
Session Time: When the range starts and ends.
Line Stop Time: When the lines should disappear for the day.
Visuals: Colors, line width, and style (solid, dotted, dashed).
Extensions: How many target lines to draw and the step size (e.g., 0.5x, 1.0x).
Fractals: Toggle the triangle icons on/off.
Search in scripts for "Fractal"

Open Interest-RSI + Funding + Fractal DivergencesIndicator — “Open Interest-RSI + Funding + Fractal Divergences”
A multi-factor oscillator that fuses Open-Interest RSI, real-time Funding-Rate data and price/OI fractal divergences.
It paints BUY/SELL arrows in its own pane and directly on the price chart, helping you spot spots where crowd positioning, leverage costs and price action contradict each other.
1 Purpose
OI-RSI – measures conviction behind position changes instead of price momentum.
Funding Rate – shows who pays to hold positions (longs → bull bias, shorts → bear bias).
Fractal Divergences – detects HH/LL in price that are not confirmed by OI-RSI.
Optional Funding filter – hides signals when funding is already extreme.
Together these elements highlight exhaustion points and potential mean-reversion trades.
2 Inputs
RSI / Divergence
RSI length – default 14.
High-OI level / Low-OI level – default 70 / 30.
Fractal period n – default 2 (swing width).
Fractals to compare – how many past swings to scan, default 3.
Max visible arrows – keeps last 50 BUY/SELL arrows for speed.
Funding Rate
mode – choose FR, Avg Premium, Premium Index, Avg Prem + PI or FR-candle.
Visual scale (×) – multiplies raw funding to fit 0-100 oscillator scale (default 10).
specify symbol – enable only if funding symbol differs from chart.
use lower tf – averages 1-min premiums for smoother intraday view.
show table – tiny two-row widget at chart edge.
Signal Filter
Use Funding filter – ON hides long signals when funding > Buy-threshold and short signals when funding < Sell-threshold.
BUY threshold (%) – default 0.00 (raw %).
SELL threshold (%) – default 0.00 (raw %).
(Enter funding thresholds as raw percentages, e.g. 0.01 = +0.01 %).
3 Visual Outputs
Sub-pane
Aqua OI-RSI curve with 70 / 50 / 30 reference lines.
Funding visualised according to selected mode (green above 0, red below 0, or other).
BUY / SELL arrows at oscillator extremes.
Price chart
Identical BUY / SELL arrows plotted with force_overlay = true above/below candles that formed qualifying fractals.
Optional table
Shows current asset ticker and latest funding value of the chosen mode.
4 Signal Logic (Summary)
Load _OI series and compute RSI.
Retrieve Funding-Rate + Premium Index (optionally from lower TF).
Find fractal swings (n bars left & right).
Check divergence:
Bearish – price HH + OI-RSI LH.
Bullish – price LL + OI-RSI HL.
If Funding-filter enabled, require funding < Buy-thr (long) or > Sell-thr (short).
Plot arrows and trigger two built-in alerts (Bearish OI-RSI divergence, Bullish OI-RSI divergence).
Signals are fixed once the fractal bar closes; they do not repaint afterwards.
5 How to Use
Attach to a liquid perpetual-futures chart (BTC, ETH, major Binance contracts).
If _OI or funding series is missing you’ll see an error.
Choose timeframe:
15 m – 4 h for intraday;
1 D+ for swing trades.
Lower TFs → more signals; raise Fractals to compare or use Funding filter to trim noise.
Trade checklist
Funding positive and rising → longs overcrowded.
Price makes higher high; OI-RSI makes lower high; Funding above Sell-threshold → consider short.
Reverse logic for longs.
Combine with trend filter (EMA ribbon, SuperTrend, etc.) so you fade only when price is stretched.
Automation – set TradingView alerts on the two alertconditions and send to webhooks/bots.
Performance tips
Keep Max visible arrows ≤ 50.
Disable lower-TF premium aggregation if script feels heavy.
6 Limitations
Some symbols lack _OI or funding history → script stops with a console message.
Binance Premium Index begins mid-2020; older dates show na.
Divergences confirm only after n bars (no forward repaint).
7 Changelog
v1.0 – 10 Jun 2025
Initial public release.
Added price-chart arrows via force_overlay.

Price Action Fractal Forecasts [AlgoAlpha]🔮 Price Action Fractal Forecasts - Unleash the Power of Historical Patterns! 🌌✨
Dive into the future with AlgoAlpha's Price Action Fractal Forecasts ! This innovative indicator utilizes the mesmerizing complexity of fractals to predict future price movements, offering traders a unique edge in the market. By analyzing historical price action and identifying repeating patterns, this tool forecasts future price trends, providing visually engaging and actionable insights.
Key Features:
🔄 Flexible Data Series Selection: Choose your preferred data series for precise analysis.
🕰 Flexible Training and Reference Data Windows: Customize the length of training data and reference periods to match your trading style.
📈 Custom Forecast Length: Adjust the forecast horizon to suit your strategic objectives.
🌈 Customizable Visual Elements: Tailor the colors of forecast deviation cones, data reference areas, and more for optimal chart readability.
🔄 Anticipatory and Repetitive Forecast Modes: Select between anticipating future trends or identifying repetitive patterns for forecasts.
🔎 Enhanced Similarity Search: Leverages correlation metrics to find the most similar historical data segments.
📊 Forecast Deviation Cone: Visualize potential price range deviations with adjustable multipliers.
🚀 Quick Guide to Maximizing Your Trading with Price Action Fractal Forecasts:
🛠 Add the Indicator: Search for "Price Action Fractal Forecasts" in TradingView's Indicators & Strategies. Customize settings according to your trading strategy.
📊 Strategic Forecasting: Monitor the forecast deviation cone and forecast directional changes for insights into potential future price movements.
🔔 Alerts for Swift Action: Set up notifications based on forecast changes to stay ahead of market movements without constant monitoring.
Behind the Magic: How It Works
The core of the Price Action Fractal Forecasts lies in its ability to compare current market behavior with historical data to unearth similar patterns. It first establishes a training data window to analyze historical prices. Within this window, it then defines a reference length to identify the most recent price action that will serve as the basis for comparison. The indicator searches through the historical data within the training window to find segments that closely match the recent price action in the reference period.
Depending on whether you choose the anticipatory or repetitive forecast mode, the indicator either looks ahead to predict future prices based on past outcomes following similar patterns or focuses on the repeating patterns within the reference period itself for forecasts. The forecast's direction can be configured to reflect the mean average of forecasted prices or the end-point relative to the start-point of the forecast, offering flexibility in how forecasts are interpreted.
To enhance the comprehensiveness and visualization, the indicator features a forecast deviation cone. This cone represents the potential range of price movements, providing a visual cue for volatility and uncertainty in the forecasted prices. The intensity of this cone can be adjusted to suit individual preferences, offering a visual guide to the level of risk and uncertainty associated with the forecasted price path.
Embrace the fractal magic of markets with AlgoAlpha's Price Action Fractal Forecasts and transform your trading today! 🌟🚀

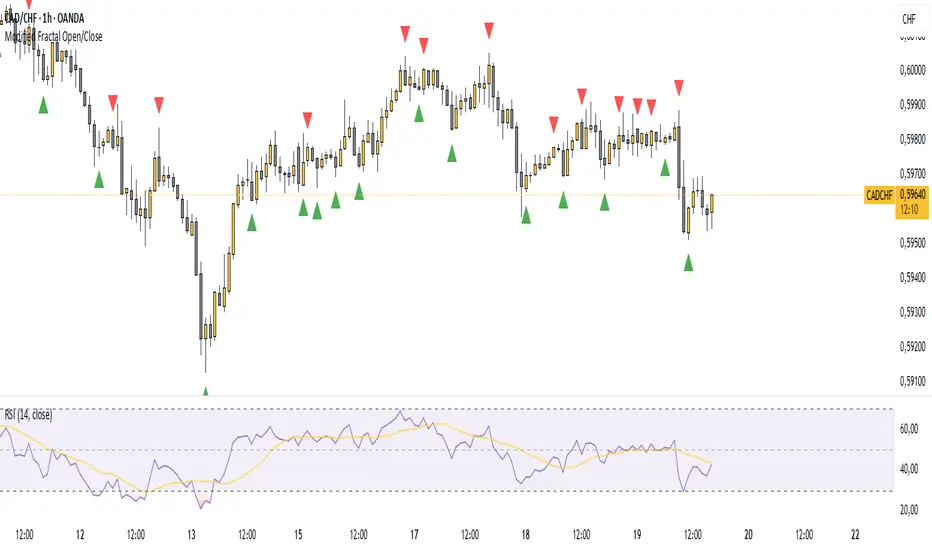
Modified Fractal Open/CloseModified Fractal (Open/Close Based) - Indicator
The Modified Fractal (Open/Close Based) indicator offers a new way to detect fractal patterns on your chart by analyzing the open and close prices instead of the traditional high and low values.
🧮 How it works:
The indicator evaluates a group of 5 consecutive candles.
The central candle (2 bars ago) is analyzed.
For a Bullish Fractal:
The open or close of the central candle must be lower than the open and close of the other 4 surrounding candles.
For a Bearish Fractal:
The open or close of the central candle must be higher than the open and close of the other 4 surrounding candles.
Once a valid pattern is detected, a visual symbol (triangle) is plotted directly on the chart and an alert can be triggered.
✅ Key Features:
Non-repainting signals (evaluated after candle close)
Fully mechanical detection logic
Easy-to-use visual signals
Alert conditions ready to be integrated into TradingView’s alert system
Suitable for multiple timeframes (can be used from M1 to Daily and beyond)
🎯 Use case:
This modified fractal approach can help traders:
Spot potential swing points
Identify possible reversals
Confirm price exhaustion zones
Support breakout or mean reversion strategies
⚠ Note:
This indicator does not provide trade signals by itself. It is recommended to be combined with additional tools, price action analysis, or risk management rules.
Fractal Pattern AnalysisFractal Pattern Key Elements and How to Read Them
1. Williams Fractals (Triangle Markers)
Red Triangles Pointing Down: Bearish fractals - potential resistance points and selling opportunities
Green Triangles Pointing Up: Bullish fractals - potential support points and buying opportunities
When to Act: Look for bullish fractals forming during uptrends and bearish fractals during downtrends
2. Moving Averages
Yellow Line (20 EMA): Short-term trend
Blue Line (50 EMA): Medium-term trend
Red Line (200 EMA): Long-term trend
Interpretation: When shorter MAs cross above longer MAs, it's bullish; when they cross below, it's bearish
Key Signal: The alignment of all three MAs (stacked in order) confirms a strong trend
3. Background Color
Green Background: Uptrend (all MAs aligned bullishly)
Red Background: Downtrend (all MAs aligned bearishly)
Yellow Background: Sideways/neutral market (MAs not clearly aligned)
4. Market Structure Markers (Small Circles)
Green Circles: Higher highs and higher lows (bullish structure)
Red Circles: Lower highs and lower lows (bearish structure)
Pattern Recognition: Multiple green circles suggest continuing uptrend; multiple red circles suggest continuing downtrend
5. Reversal Diamonds ("Rev" Markers)
Yellow Diamonds: Potential trend reversal points
Usage: These mark where the current trend might be changing direction
Confirmation: Wait for price to close beyond the diamond before acting
6. Bollinger Bands (Blue Lines with Fill)
Middle Band: 20-period SMA
Upper/Lower Bands: Volatility channels
Signals: Price touching upper band in uptrend is strength; touching lower band in downtrend is weakness
Squeeze: When bands narrow, expect a volatility breakout soon
7. Status Table (Top Right)
Shows current trend, volume direction, and overall signal at a glance
"BUY" signal appears when multiple bullish conditions align
"SELL" signal appears when multiple bearish conditions align

PO3-Goldbach Fractal levels [promuckaj]This script is developed on time & price, algorithmic market theory that is well explained in the book "Demystifying ICT" by Hopiplaka.
What is fractals Goldbach levels and why this indicator is different then the other one based on GB levels to.
Well, the whole idea behind this script was born long time a go, when I write the first, well known, indicator for GB levels. This script allow you to set one master/main PO3 GB number, usually the higher one, and then decide what fractal GB levels you want there within 12 partitions of main(higher one) PO3 dealing range.
That means that you can deal with every single partition level from main one, RB, OB, FV, LV, BR and MB, and look them through prism of GB levels reserved for each of them.
Indicator contain all the options to deal with lines, labels, colors etc, including options for non-goldbach and CE levels. All of them could be modify separately for main and fractal levels.
Here is one example, lets set main PO3 GB number for NQ to be 2187.
We can see that we are at the moment in discount MB partition, so now let’s do the magic and activate some of fractals there, for example for MB and BR in discount zone and zoom in the chart.
I hope it is more then clear how this could be used in your analysis and trading plan.

MTF Fractal Bias Confluence DetectorMTF Fractal Bias Confluence Detector
This indicator, the MTF Fractal Bias Confluence Detector, is based on the idea that the market exhibits fractal behaviour. The origin of the idea traces back to 1963, when Benoit Mandelbrot analyzed the fluctuations in cotton prices over a time series starting in 1900, discovering that price changes exhibited scale-invariant patterns. This means that the curve representing daily price changes mirrored the shape of monthly price changes, highlighting the fractal nature of market behaviour. When applied to swing points across multiple timeframes (MTF), this concept suggests that swing points demonstrate similar patterns regardless of the timeframe being analyzed. These self-similar fractal structures provide traders with insights into market reversals and trends, making them a powerful tool for multi-timeframe analysis.
A Swing Point is made up of three main parts: a move away from the last Break level; forming a peak (pivot point) with a Fakeout of the peak (explained through an example later); and a subsequent move away from it. These swing points recur across all timeframes as part of cyclical momentum patterns, meaning each swing point gives rise to a new cycle of market movement. Due to the fractal nature of the market, larger cycles encompass multiple smaller ones.
The theory behind the Fractal Bias Confluence Detector utilizes the idea that the market movements are fractal in nature and illustrates how such swing points can be identified across MTFs. To do so, we examine the Peak Fakeouts within these cycles, as they form. It is not possible to know in advance how long each of these moves will last, but a Swing Point will often occur with a Peak Fakeout. Therefore, the most critical element is to identify the Peak Fakeout.
The snapshot below captures a Peak Fakeout, as discussed earlier.
Similarly, the following snapshot shows various possible breakdowns of Higher Time Frame (HTF) cycles into smaller Lower Time Frame (LTF) movements. The chart contains a white table(not part of the indicator and shown for illustration purposes only).
To further illustrate. Consider the combination of Time Frames (TF) from the 2nd row (from the above snapshot). Cycle TF (1M), Setup TF (1W), Momentum TF (1D) etc.
Price movements in the 1M TF highlight the direction in which HTF traders are pushing the market. Often, when markets have broken out of a level, they tend to form a peak and can then pull back towards the prior breakout level. Once the pullback is beyond the last breakout level, in the opposite direction, we may say the peak formation is created, and directional bias has changed. This is also called Peak Fakeout. Due to the fractal nature of the market, Swing Points on the HTF will often constitute multiple Swing Points on the LTF, though they are not always in sync. However, after such peak formation, there is a high probability that the price might move away from the peak for at least 1 candle (in the cycle TF). This theory illustrates that once a new cycle is in play, we can then look at 1W (Setup TF) to look for possible in-sync movements, at least within that 1 candle of the HTF. Repeating the same for further lower TFs, we may arrive at a confluence of Fractal Bias and see how the movements in LTF are driven by the HTF momentum.
Another example within the chart:
Note: The above examples are just for illustration purposes, and other permutations and combinations of movements across multiple TFs are also possible.
This indicator aims to help users identify such fractal-bias-confluences, so that they can leverage the fractal nature of the market to get a holistic view. To do so, the indicator displays how the market has moved across multiple time frames, with respect to different historical levels.
Features:
1. The bias summary table
The following snapshot depicts the bias summary table at the bottom right of the chart.
1.1. Workings: The table will display, for various TFs, in the first four (starting from "current" to Prev ) rows, one of the following.
"F/H" , " Acronym for the failed break of the previous high",
"F/L" , " Acronym for the failed break of the previous low",
"B/H" , " Acronym for the break of the previous high",
"B/L" , " Acronym for the break of the previous low",
"IN" , " Acronym for an inside candle (never broke high or low of perv candle)",
"OT" , " Acronym for an outside candle (broke both high and low of previous candle and closing price is in between previous high and low)".
Note: these acronyms are customizable according to the user's choice of terminology in any language, as shown in the snapshot below.
1.1.1 In the above snapshot, the 1st row, called "Current", shows how the current candle is evolving with respect to the previous one. The "previous" row shows how the previous candle closed with respect to the pre-previous one. The next two rows represent the bias of the pre-previous and pre-pre-previous in a similar manner. By default, the bias is updated in real-time, even for the already closed historical candles. For example, if the previous 4H candle closed as a B/H and the current price then comes below the pre-previous 4H candle high, then the bias of the previous candle will get updated to F/H. This informs the user that the break above the pre-previous high has failed. However, the user has the option to turn this off. The information in these four rows shows the user how the market is moving currently and how it evolved before reaching the current price levels.
Note: The calculation done by the indicator is to keep track of how the price is moving with respect to the last candle levels in real-time. This means if the price first goes above the previous high and then goes below the previous low, the indicator is equipped to display what happened in the most recent time. The snapshot below shows the option to turn on/off such updates in the bias summary table.
Note: While the bias summary table is turned on, the user also has the option to turn off Prev and Prev rows, as shown in the snapshot below.
1.1.2 The 2nd to last row, called CL/CS(Consecutive Long/Short), shows whether consecutive (2+) breaks of high/low happened or not in one direction without taking out the previous candle's range in the opposite direction. When conditions are met, it will show the number of times the price has been pushed in one direction (in the above manner), followed by "L" for long and "S" for short, for each TF, for example, "4L". It gets updated in real-time for each push in the same direction. Furthermore, a good analogy of "4L" on an HTF is 4 consecutive Break of Structure (BOS) (in the same direction) on LTF, without a Change of Character (CHoCH). Another example would be Stacey Burke's 3 consecutive rises that can be mapped in the indicator, if the conditions are met for "3L" for a given TF.
1.1.3 The last row, FRC/FGC, stands for the first red/green candle. It shows whether the last candle of a TF has closed as green (i.e., close>open) after posting two red candles (i.e., close

HTF Fractal Candle OverlayHTF Fractal Candle Overlay is a technical visualization tool designed to display higher-timeframe candle structures directly on lower-timeframe charts.
In this script, fractal refers to the repetition and projection of higher-timeframe price structures across lower timeframes. By overlaying HTF candles onto the active chart, traders can observe how lower-timeframe price action evolves within larger timeframe candles, without switching timeframes or using multiple charts.
Core Functionality
• Projects selected higher-timeframe candles onto lower timeframes as a visual overlay
• Displays HTF candle bodies, wicks, opens, highs, lows, and midpoints
• Maintains accurate candle alignment using time-based calculations
• Supports session-aware and time-based candle segmentation
• Includes optional imbalance (FVG) and midpoint visualization
• Provides time-remaining tracking for active HTF candles
Fractal Concept Explained
The fractal behavior in this script is expressed through multi-timeframe structure repetition. Each higher-timeframe candle contains a sequence of lower-timeframe price movements that collectively form the same structural behavior. This overlay allows traders to study that relationship in real time and understand how HTF structure develops internally.
Use Cases
• Multi-timeframe context without timeframe switching
• Refining entries using HTF candle structure on LTF execution charts
• Studying internal candle behavior and volatility distribution
• Session-based structure analysis
• Educational visualization of HTF/LTF price relationships
Design Notes
• Built with performance-focused array management
• Automatically manages drawing lifecycle to prevent chart clutter
• Designed for clarity, not signal generation
• No repainting of completed HTF candles
This indicator is intended as a visual analysis tool, not a trading signal. It provides structural context to support discretionary decision-making based on price behavior.

Smaller Fractals (+ Transparency)Smaller Fractals (+ Transparency)
I find that fractals are super useful, but can visually clutter up the chart pretty quickly. Their opaqueness and just overall bigness can become a bit much.
As such, these are just like regular fractals, only smaller (pine script's`size.tiny` instead of the default `size.small`).
Also, you can set a transparency level to these little guys (default is 50%).
Simple, more polite, and hopefully more useful fractals for those wnting a cleaner looking chart. 😁

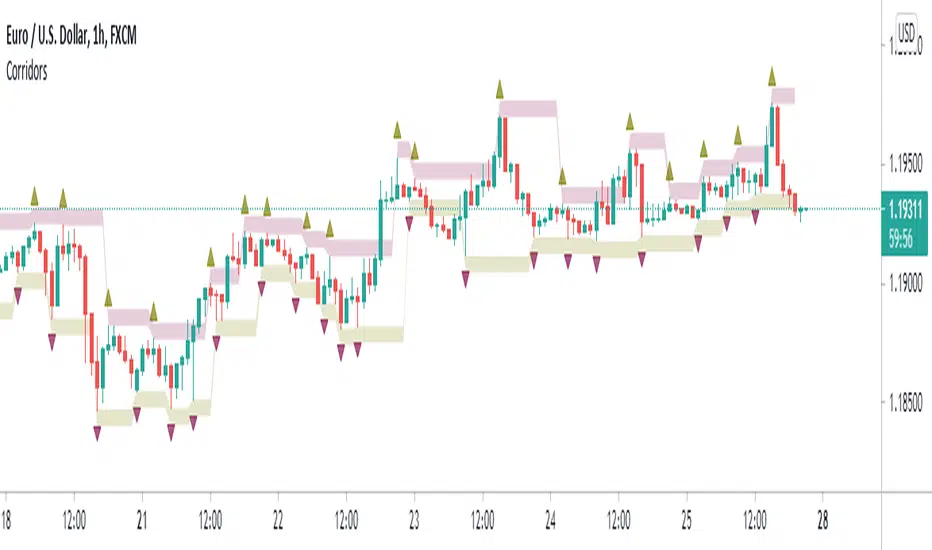
Fractal CorridorsFractal Corridors is a lagging channel connecting Fractal highs and lows each with added/substracted pre-set value.
It is inspired and designed for Vladimir Poltoratskiy's trading style with his ST patterns (book: Forex Strategy: ST Patterns Trading Manual).
However, to keep the charts clearer, I used William's Fractals that require two previous and following candles to be higher/lower opposed to just one as described in the book.
You may choose to disable fractals and view the channel only.
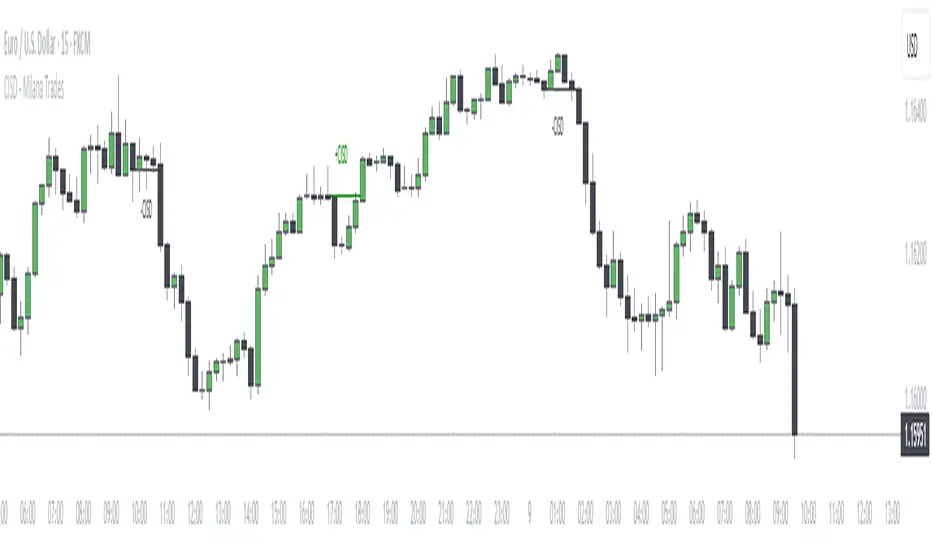
CISD + Fractals - Milana TradesThe CISD (Change in State of Delivery ) is a precision-engineered tool for identifying structural shifts within price action.
It algorithmically detects when price transitions from one swing direction to another — providing objective confirmation of market structure breaks that often precede trend reversals.
By mapping swing highs and lows, and visually marking breakpoints through CISD signals, this indicator enables traders to see the market’s internal structure in real time, without noise or subjective interpretation.
⚙️ Core Logic
The CISD algorithm uses a fractals-based structure recognition system to define market swings (high/low) and monitor for structural breaches.
Swing Identification
Using a configurable Pivot Strength parameter, the indicator detects significant local highs and lows based on price symmetry.
These pivots form the foundation of short-term and long-term structural reference points.
Execution Logic
Once a CISD is detected, the script dynamically projects a horizontal reference line at the validated structural level and plots a clear label (+CISD or –CISD) at the break location.
This provides an immediate, unobtrusive visualization of key structural events.
Visualization & Styling
The CISD interface is built for clarity and adaptability across all charting environments.
All stylistic parameters are fully customizable:
Pivot Strength – Sensitivity of swing identification
Fractal Visibility – Optional visualization of pivot origins
Bullish/Bearish Color Schemes – Independent line and text coloration
Line Style & Thickness – Adjustable for chart clarity
Label Size – Four-tier sizing (Tiny to Large) for multi-timeframe readability
Each CISD line maintains the context of structural order flow, allowing traders to visually differentiate active structure levels from historical breakpoints.
Alert System
The indicator integrates a fully functional alert module for automated market monitoring:
Any CISD – Alerts when any structural break occurs
Bullish CISD Formed – Alerts on bullish market structure shifts
Bearish CISD Formed – Alerts on bearish market structure shifts
These can be used for manual trade confirmation, smart alerts, or automated trading system triggers.
Current Fractal High/Low (Dynamic)
This indicator dynamically tracks the most recent confirmed Fractal High and Fractal Low across any timeframe using custom left/right bar configurations.
🔍 Key Features:
Detects Fractal Highs and Lows based on user-defined pivot settings.
Draws a green line and label ("FH") at the most recent Fractal High.
Draws a red line and label ("FL") at the most recent Fractal Low.
All lines extend from the confirmation bar to the current candle.
Automatically removes old lines and labels for a clean, uncluttered chart.
🛠️ Customizable Inputs:
Left & Right bars for pivot sensitivity
Line width for visibility
📌 Use Cases:
Identifying structure shifts
Recognizing key swing points
Supporting liquidity and breakout strategies
💡 Fractals are confirmed only after the full formation of the pattern (left and right bars). This ensures reliability over reactivity.
This script is designed for intraday to swing traders who want a reliable way to visualize market turning points with minimal noise.

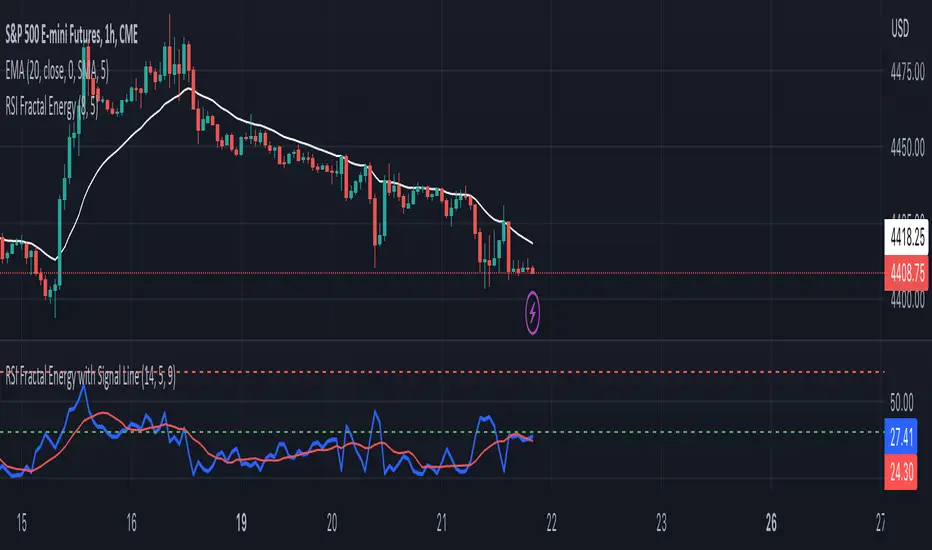
RSI Fractal Energy with Signal LineHere is my second script.
Introducing the RSI Fractal Energy Indicator.
This incorporates the Relative-Strength Index and Fractal Energy as the name implies.
This will help the trader identify:
1. Trend Strength: The higher the value of the indicator can indicate the strength of the trend and vice versa.
2. Reversal points: If the indicator is showing weakness and the market is making higher highs and lower lows this can indicate a reversal is possible.
3. Overbought and Oversold conditions: This indicator is currently set to 30(Oversold) and 70(Overbought), but this can be changed in the source code.
I also added a signal line to provide bullish/bearish crossovers.
I use this indicator on the 1 hr chart, but it can be used on any time frame.
Please let me know if you have any questions, comments, or concerns. Always open to learning more.
I will also provide updates as I continue to use my indicators.
Happy trading!
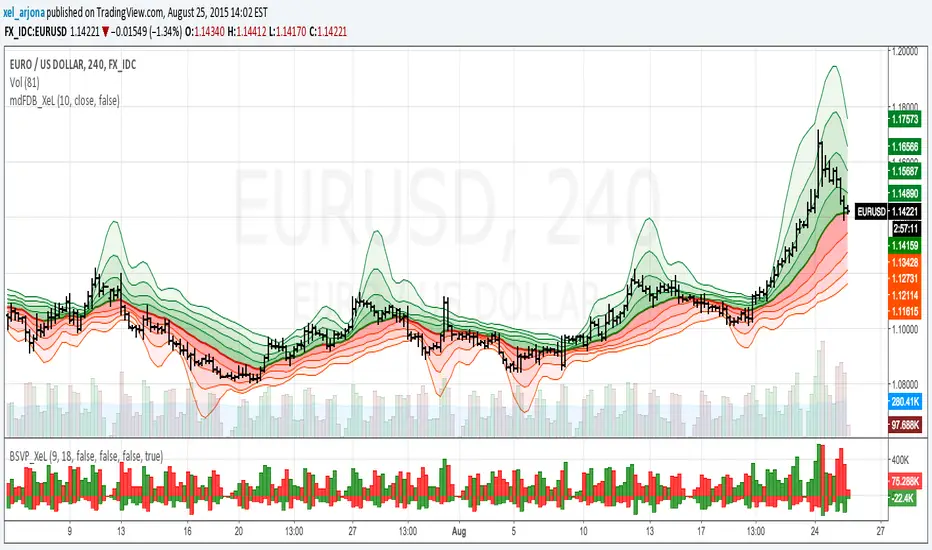
EMA & SMA with FRACTAL DEVIATION BANDS by @XeL_ArjonaEMA & SMA with FRACTAL DEVIATION BANDS
Ver. 1.0.25.08.2015
By Ricardo M Arjona @XeL_Arjona
DISCLAIMER:
DISCLAIMER:
The Following indicator/code IS NOT intended to be a formal investment advice or recommendation by the author, nor should be construed as such. Users will be fully responsible by their use regarding their own trading vehicles/assets. The embedded code and ideas within this work are FREELY AND PUBLICLY available on the Web for NON LUCRATIVE ACTIVITIES and must remain as is.
WHAT IS THIS?
This is the adaptation of the FRACTAL DEVIATION BANDS to be used on Traditional Moving Averages (Simple & Exponential).
ALL NEW IDEAS OR MODIFICATIONS to these indicator(s) are Welcome in favor to deploy a better and more accurate readings. I will be very glad to be notified at Twitter or TradingVew accounts at: @XeL_Arjona
Any important addition to this work MUST REMAIN PUBLIC by means of CreativeCommons CC & TradingView.
2015

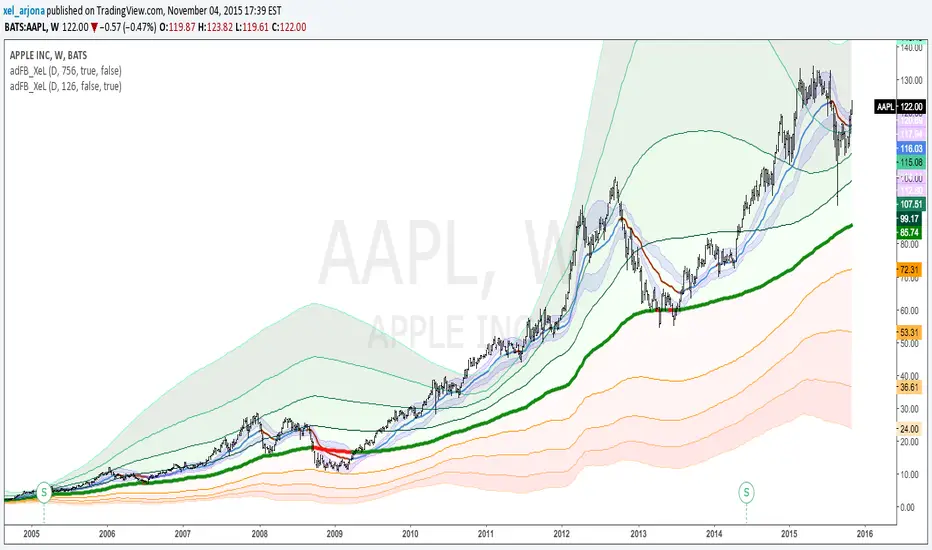
McGinley Dynamic with FRACTAL DEVIATION BANDS by @XeL_ArjonaMcGINLEY DYNAMIC with FRACTAL DEVIATION BANDS.
Ver. 1.0.beta.25.08.2015
By Ricardo M Arjona @XeL_Arjona
DISCLAIMER
The Following indicator/code IS NOT intended to be a formal investment advice or recommendation by the author, nor should be construed as such. Users will be fully responsible by their use regarding their own trading vehicles/assets. -- The embedded code and ideas within this work are FREELY AND PUBLICLY available on the Web for NON LUCRATIVE ACTIVITIES and must remain as is.
WHAT IS THIS?
This is my first adaptation of the FRACTAL DEVIATION BANDS to the "McGinley Dynamic Line". Be advised that the nature of this line tend to need some adjustments at the "Smooth Factor" if you see a flat line with tiny values.
Pine Script code MOD's and adaptations by @XeL_Arjona with special mention in regard of:
Morphic Numbers: (PHI & Plastic) Pine Script adaptation from it's algebraic generation formulas by @XeL_Arjona.
FRACTAL DEVIATION BANDS: main idea by @XeL_Arjona
ALL NEW IDEAS OR MODIFICATIONS to these indicator(s) are Welcome in favor to deploy a better and more accurate readings. I will be very glad to be notified at Twitter or TradingVew accounts at: @XeL_Arjona. Any important addition to this work MUST REMAIN PUBLIC by means of CreativeCommons CC & TradingView.
2015
Volume-supported Fractal SRModified version of SynapticEX's Volume-supported Fractal S/R with EMA instead of SMA, pinescript 4 port, and EMA20/EMA50 defaults for support and resistance.
EMA20 = red/green
EMA50 = orange/yellow

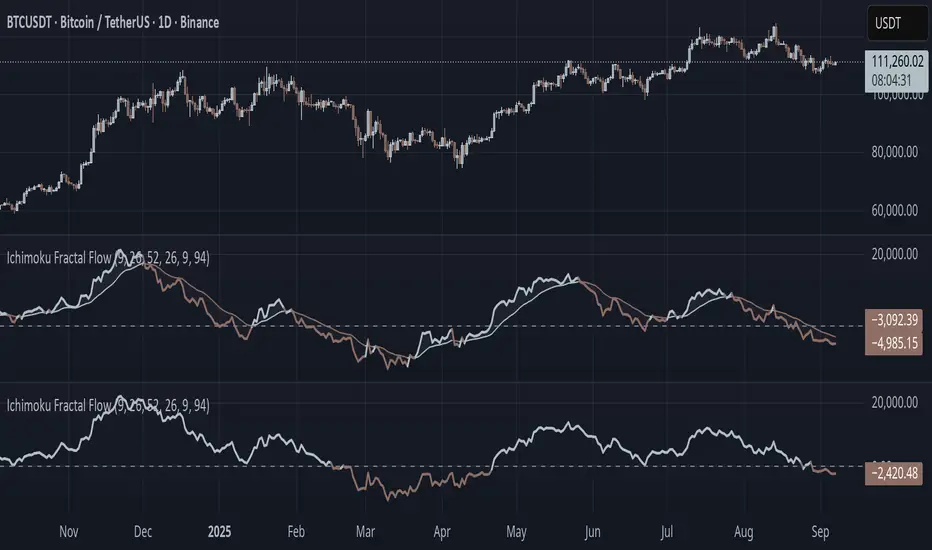
Ichimoku Fractal Flow### Ichimoku Fractal Flow (IFF)
By Gurjit Singh
Ichimoku Fractal Flow (IFF) distills the Ichimoku system into a single oscillator by merging fractal echoes of price and cloud dynamics into one flow signal. Instead of static Ichimoku lines, it measures the "flow" between Conversion/Base, Span A/B, price echoes, and cloud echoes. The result is a multidimensional oscillator that reveals hidden rhythm, momentum shifts, and trend bias.
#### 📌 Key Features
1. Fourfold Fusion – The oscillator blends:
* Phase: Tenkan vs. Kijun spread (short vs. medium trend).
* Kumo Phase: Span A vs. Span B spread (cloud thickness).
* Echo: Price vs lagged reflection.
* Cloud Echo: Price vs. projected cloud center.
2. Oscillator Output – A unified flow line oscillating around zero.
3. Dual Calculation Modes – Oscillator can be built using:
* High-Low Midpoint (classic Ichimoku-style averaging).
* Wilder’s RMA (smoother, less noisy averaging averaging).
4. Optional Smoothing – EMA or Wilder’s RMA creates a trend line, enabling MACD-style crossovers.
5. Dynamic Coloring – Bullish/Bearish color shifts for quick bias recognition.
6. Fill Styling – Highlighted regions between oscillator & smoothing line.
7. Zero Line Reference – Acts as a structural pivot (bull vs. bear).
#### 🔑 How to Use
1. Add to Chart: Works across all assets and timeframes.
2. Flow Bias (Zero Line):
* Above 0 → Bullish flow 🐂
* Below 0 → Bearish flow 🐻
3. With Signal Line:
* Oscillator above smoothing line → Possible upward trend shift.
* Oscillator below smoothing line → Possible downward trend shift.
4. Strength:
* Wide separation from smoothing = strong trend.
* Flat, tight clustering = indecision/range.
5. Contextual Edge: Combine signals with Ichimoku Cloud analysis for stronger confluence.
#### ⚙️ Inputs & Options
* Conversion Line (Tenkan, default 9)
* Base Line (Kijun, default 26)
* Leading Span B (default 52)
* Lag/Lead Shift (default 26)
* Oscillator Mode: High-Low Midpoint vs Wilder’s RMA
* Use Smoothing (toggle on/off)
* Signal Smoothing: Wilder/EMA option
* Smoothing Length (default 9)
* Bullish/Bearish Colors + Transparency
#### 💡 Tips
* Wilder’s RMA (both oscillator & smoothing) is gentler, reducing whipsaws in sideways markets.
* High-Low Mid captures pure Ichimoku-style ranges, good for structure-based traders.
* EMA reacts faster than RMA; use if you want early momentum signals.
* Zero-line flips act like momentum pivots—watch them near cloud boundaries.
* Signal line crossovers behave like MACD-style triggers.
* Strongest signals appear when oscillator, signal line, and Ichimoku Cloud all align.
👉 In short: Ichimoku Fractal Flow compresses multi-layered Ichimoku system into a single fractal oscillator that detects flow, pivotal shifts, and momentum with clarity—bridging price, cloud, and echoes into one signal. Where the cloud shows structure, IFF reveals the underlying flow. Together, they offer a fractal lens into market rhythm.
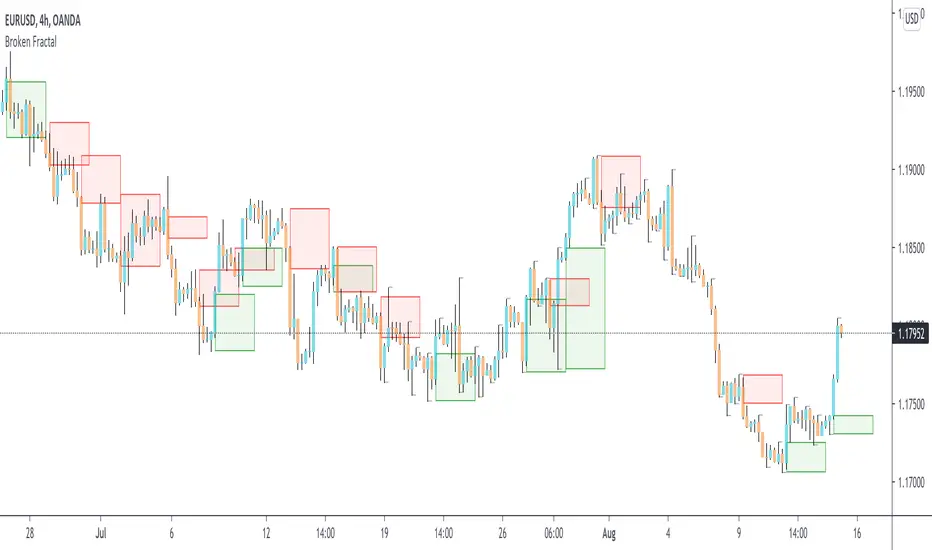
Broken Fractal : Someone's broken dream is your profit!Idea
The idea is simple : when market turns around, it traps a bunch of traders off guard. We trade with them, in the same direction of their exit!
Method
We let the market first create a fractal
We then let the market create an opposite fractal
We then let the market break the first fractal it created, thereby trapping lots of trades in the process
We then patiently wait till the market gives these trapped traders a chance to exit - and we trade in the same direction
How to use?
Green boxes are for long entry, red boxes are for short.
Whenever a box appears, that's the risk criteria - setup limit orders and trade along!
Works on all timeframes
If you like this script, please leave a note on how you are using it.
I personally use it with Higher Timeframe bias.
PS1 : some traders call this Break of market structure, some call it Breaker, I just call it "Broken Fractal"
PS2 : Break of a broken fractal is also very potent. Watch out for those!
Fractal Reversal StageFractal Reversal Stage — это продвинутый осцилляторный индикатор разворота, который объединяет классический анализ RSI на старших таймфреймах с уникальным паттерном "фрактального поглощения" на рабочих графиках.
Multi-Timeframe RSI Filter: Индикатор отслеживает состояние перекупленности/перепроданности на старшем ТФ (например, 15м), определяя глобальную зону интереса.
Trend Inertia: Алгоритм проверяет наличие устойчивой инерции тренда (Heikin-Ashi) перед поиском точки входа.
Как работает сигнал: Индикатор одновременно анализирует стандартные японские свечи и сглаженные свечи Heikin-Ashi. Сигнал появляется в момент слома текущего тренда, когда подтверждается резкий импульс в обратную сторону. Это позволяет зайти в сделку в самой ранней точке нового движения.
Noise Filter: Встроенный фильтр размера тела свечи исключает ложные сигналы на низковолатильном рынке.
Как использовать:
Зеленая зона / BUY: Ищите сигнал, когда фон окрашен в зеленый цвет
Красная зона / SELL: Ищите сигнал, когда фон окрашен в красный цвет
Линия тренда: Визуализирует уровни стопа или поддержки/сопротивления после подтверждения разворота. Рекомендуется использовать усреднение на коррекциях против тренда с индикациями (зоны перекупленности/перепроданности выглядят как вертикальные линии). Выход осуществляется по зонам противоположному цвету тренда - Покупка - красная зона, Продажа зеленая. Либо цвет зоны+противоположный сигнал.
Fractal Reversal Stage is a professional reversal tool designed to catch trend exhaustion points using MTF RSI filtering and a unique fractal engulfing pattern.
Multi-Timeframe RSI Filter: The indicator monitors Overbought/Oversold conditions on a higher timeframe (e.g., 15m) to identify the global "Zone of Interest."
Trend Inertia: The algorithm verifies the presence of sustained trend momentum (using Heikin-Ashi) before searching for an entry.
Signal Mechanics: The indicator performs a dual analysis of standard Japanese candlesticks and smoothed Heikin-Ashi candles. A signal is triggered at the moment of a trend break, confirmed by a sharp counter-trend impulse. This allows you to enter the trade at the earliest possible stage of a new move.
Noise Filter: A built-in candle body size filter eliminates false signals during low-volatility market conditions.
How to Use:
Green Zone / BUY: Look for a signal when the background is highlighted in green.
Red Zone / SELL: Look for a signal when the background is highlighted in red.
Trend Line: Visualizes stop-loss levels or support/resistance after the reversal is confirmed.
Strategy: It is recommended to use averaging (DCA) during corrections against the signal using the Overbought/Oversold indications (marked as vertical lines).
Exit Rules: 1. For a Buy position — exit in the Red Zone. 2. For a Sell position — exit in the Green Zone. 3. Alternatively, exit when a Zone Color change is confirmed by an opposite signal.

HMA 34 Dual-Fractal Projections - VdubusVdubus MacD Divergence Trend Break Signal Generator :Here:-
HMA 18 Dual-Fractal Projections
Overview
The HMA 18 Dual-Fractal Projections is a technical analysis tool designed to identify market structure and potential breakout patterns by analyzing the pivots of a Hull Moving Average (HMA).
Unlike standard trendline indicators that struggle to balance "big picture" trends with immediate price action, this indicator utilizes a Dual-Fractal approach. It simultaneously calculates two separate timelines—Macro and Micro—to visualize both the dominant channel and the developing chart patterns (such as wedges or triangles) in real-time.
Visual Guide
The indicator plots three key elements on the main chart:
The HMA Line (Blue): A smooth, fast-acting moving average (default length 34) that serves as the baseline for all calculations.
Macro Structure (Solid, Thick Lines):
Red (Solid): Major Resistance.
Green (Solid): Major Support.
Purpose: Identifies the long-term trend channel. These lines react slowly and filter out noise.
Micro Structure (Dashed, Thin Lines):
Red (Dashed): Immediate Resistance.
Green (Dashed): Immediate Support.
Purpose: Identifies the short-term market structure. These lines react quickly to show forming wedges, triangles, or flags.
How It Works
The indicator applies a "Pivot High/Low" algorithm directly to the HMA data rather than raw price data. This filters out candle wicks and volatility, ensuring lines are drawn based on established momentum shifts.
Layer 1 (Macro): Uses a large "Lookback" period (default 44 bars) to find significant peaks and valleys. It connects the most recent major pivot to the previous one, projecting a line forward to show where the major trend channel lies.
Layer 2 (Micro): Uses a small "Lookback" period (default 10 bars) to find local peaks and valleys. This allows you to see how price is behaving within the larger channel.
Settings & Configuration
HMA Settings
HMA Length: The length of the Hull Moving Average.
Default: 34 (Matches the "visually pleasing" setting from recent testing).
Note: Set to 18 for a faster, more reactive baseline (scalping).
Layer 1: Macro (Big Channel)
Macro Lookback: Determines how many bars must pass before a peak is confirmed.
Default: 44. High values find broad, established channels.
Max Macro Lines: How many historical lines to keep on the chart.
Default: 1 (Keeps the chart clean, showing only the current structure).
Extend Macro Lines: Projects the lines infinitely to the right to predict future support/resistance zones.
Layer 2: Micro (Current Pattern)
Micro Lookback: A lower sensitivity setting to catch immediate structure.
Default: 10. Low values will pinpoint the exact boundaries of small wedges or flags forming right now.
Trading Strategy & Interpretation
1. The "Squeeze" (Wedge Identification) This is the primary use case.
Look for scenarios where the Macro Lines (Solid) are wide/parallel, but the Micro Lines (Dashed) are rapidly converging (pointing towards each other).
This indicates that while the main trend is intact, momentum is compressing. A breakout is imminent where the dashed lines intersect.
2. Trend Channels
When both Solid and Dashed lines are roughly parallel and sloping in the same direction, the trend is healthy and strong. Price is respecting both the short-term and long-term momentum.
3. Divergence / Early Reversal Warning
If the Macro Line is sloping UP, but the Micro Line starts sloping DOWN (crossing inside), it indicates a loss of momentum and a potential reversal before the price actually breaks the major trendline.
===========================================================================
2. Micro/Macro Cross Alert
A new input, Enable Micro/Macro Cross Alert, has been added under the "Alerts & Features" section.
This alert condition is triggered when the momentum of the Micro Structure exceeds the momentum of the Macro Structure, which is a high-probability signal for a breakout:
Bullish Alert: The Micro High (dashed red line) crosses above the Macro High (solid red line).
Bearish Alert: The Micro Low (dashed green line) crosses below the Macro Low (solid green line).
To set up the actual alert on your chart:
Right-click on the chart.
Select "Add alert on HMA 34 Dual-Fractal Projections".
In the Condition dropdown, select the indicator's name.
For the main alert criteria, choose "Any alert()".
Select your preferred alert actions (e.g., notification, email).

EVWMA Acc/Dist. Pressure & FRACTAL BANDS by @XeL_ArjonaEVWMA ACCUMULATION/DISTRIBUTION PRESSURE & FRACTAL BANDS
Version: 3.0 @ 4.11.2015
By Ricardo M Arjona @XeL_Arjona
DISCLAIMER:
The following indicator IS NOT INTENDED TO BE A FORMAL INVESTMENT ADVICE OR TRADING RECOMMENDATION BY THE AUTHOR, nor should be construed as such. Users will be fully responsible by their use regarding any kind of trading vehicles or assets.
The following script and ideas within this work are FREELY AND PUBLICLY availables on the Web for NON LUCRATIVE ACTIVITIES and must remain as is.
-== IMPORTANT: THIS IS AN EXPERIMENTAL INDICATOR ==-
What is this?
This work is a derivation of my previous Accumulation/Distribution scripts publicly available in TradingView in an effort to clean, speedup and make the indicator cleaner as possible.
The current indicator is based on already tested and Mathematically proof concepts as described below:
The MAIN Rolling back median line or "Vortex" is constructed by a simple and equal weighting of distributed volume along the candle range (This approach is just an "estimator" of Buyers Vs. Sellers given the lack of tick resolution in TradingView, a real "DELTA" can only be 100% reliable with Market Depth (Ask/Bid ticks)), Given this, with each "volume weights", the price is post-processed against a true statistical Average calculation formerly: ELASTIC VOLUME WEIGHTED MOVING AVERAGE.
The FRACTAL BANDS are just Standard Deviation's with GOLDEN RATIO as multiplier (1.618) derived one from each other within it's origin on the former "Vortex Median".
The Standard Error Bands comply as the original indicator described by Jon Andersen but given the true statistical nature of EVWMA, the original LinReg line has been substituted by the former.
ALL NEW IDEAS OR MODIFICATIONS to this indicator are welcome in favor to deploy a better technical tool. Any important addition to this work MUST REMAIN PUBLIC by means of CreativeCommons CC & TradingView user rules. (C) 2015 @XeL_Arjona
ICT Fractal HTF Candles [TFR]ICT HTF Fractal Candles
This indicator overlays higher timeframe (HTF) candles directly on your current chart for better multi-timeframe analysis. It plots up to the last 4 candles from a user-selected timeframe (5m, 15m, 1h, 4h, or 1D) with customizable body and border colors.
Features:
Displays the last 4 higher timeframe candles (open, high, low, close) on your current chart.
Customizable bullish, bearish, and inside close candle colors.
Optional midpoint wick lines (top and bottom) for precision reference, with extendable length for clarity.
Optional candle midpoint line for additional confluence.
Overlay mode allows you to see HTF structure without switching chart timeframes.
Timeframe label display so you always know which HTF is being plotted.
Offset control for shifting candle position.
Use Case:
This tool helps traders apply ICT concepts like PO3, midpoint reference levels, and multi-timeframe confirmation without constantly switching between charts. It’s particularly useful for identifying liquidity zones, midpoint reactions, and higher timeframe market structure while executing on a lower timeframe.
Weierstrass Function (Fractal Cycles)THE WEIERSTRASS FUNCTION
f(x) = ∑(n=0)^∞ a^n * cos(b^n * π * x)
The Weierstrass Function is the sum of an infinite series of cosine functions, each with increasing frequency and decreasing amplitude. This creates powerful multi-scale oscillations within the range ⬍(-2;+2), resembling a system of self-repetitive patterns. You can zoom into any part of the output and observe similar proportions, mimicking the hidden order behind the irregularity and unpredictability of financial markets.
IT DOESN’T RELY ON ANY MARKET DATA, AS THE OUTPUT IS BASED PURELY ON A MATHEMATICAL FORMULA!
This script does not provide direct buy or sell signals and should be used as a tool for analyzing the market behavior through fractal geometry. The function is often used to model complex, chaotic systems, including natural phenomena and financial markets.
APPLICATIONS:
Timing Aspect: Identifies the phases of market cycles, helping to keep awareness of frequency of turning points
Price-Modeling features: The Amplitude, frequency, and scaling settings allow the indicator to simulate the trends and oscillations. Its nowhere-differentiable nature aligns with the market's inherent uncertainty. The fractured oscillations resemble sharp jumps, noise, and dips found in volatile markets.
SETTINGS
Amplitude Factor (a): Controls the size of each wave. A higher value makes the waves larger.
Frequency Factor (b): Determines how fast the waves oscillate. A higher value creates more frequent waves.
Ability to Invert the output: Just like any cosine function it starts its journey with a decline, which is not distinctive to the behavior of most assets. The default setting is in "inverted mode".
Scale Factor: Adjusts the speed at which the oscillations grow over time.
Number of Terms (n_terms): Increases the number of waves. More terms add complexity to the pattern.
