Noro's Squeeze Momentum Strategy v1.0This strategy uses 3 different indicators:
1) Squeeze Momentum Indicator (by LazyBear)
2) Color of a candle as filter of signals
3) Candle body size as filter of signals (EMA Body)
Strategy
If Squeeze Momentum Indicator is indicated uptrend both at the same time by a candle red and at the same time more than a third of a body of an average candle - to open long (and to close short)
If Squeeze Momentum Indicator is indicated downtrend both at the same time by a candle green and at the same time more than a third of a body of an average candle - to open short (and to close long)
Search in scripts for "LazyBear"

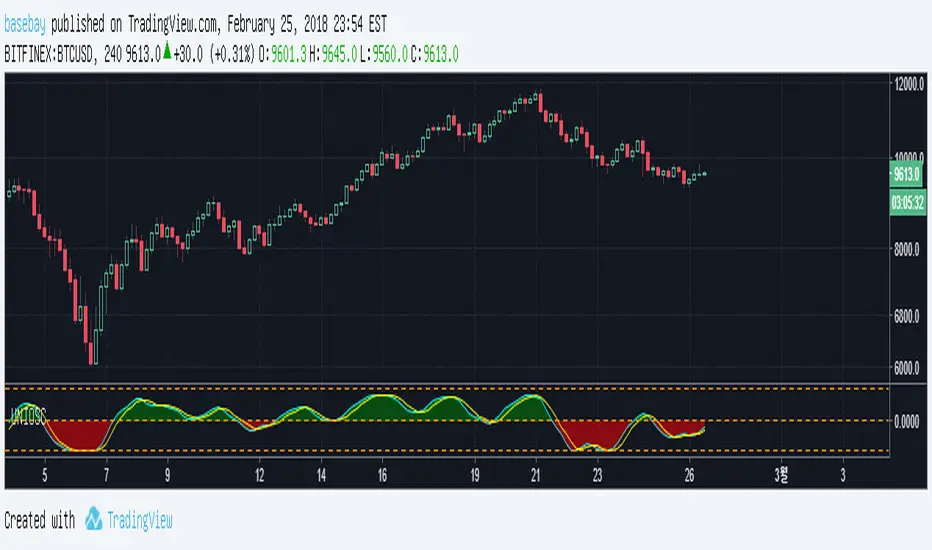
Universal Oscillator by John EhlersOriginal idea from Lazybear's script.
I changed value
degree to radian in TradingView
And
I added values ( hline : 1 and -1 )
It is important value from John Ehlers's article.
If I have mistake you comment me.
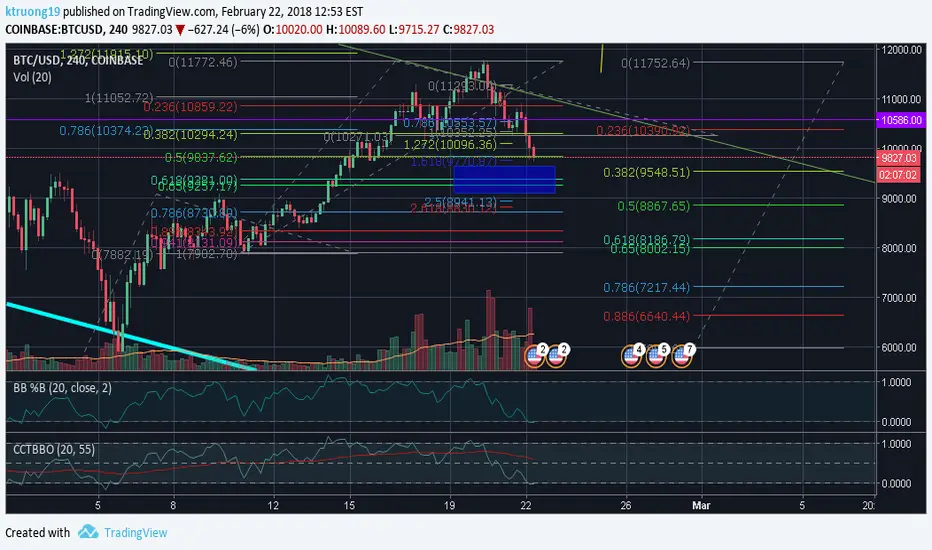
CCT Bollinger Band Oscillator - BB %B UpdateEdit of LazyBear's CCT Bollinger Band Oscillator. Includes changing the scale from 0-100 to 0-1, default length to 20 and line width to 1 to further match BB %B and address some middle line inconsistencies at certain zoom levels
RSI ZonesThis is a combination of a couple ideas I saw on here. The result is from three configurable EMA smoothed RSI overbought/oversold zones. The default is set to Donchian Channel mode where the highs/lows of the RSI's are plotted. An optional basis line derived from the slowest RSI is also included. Toggling this mode off gives you different results.
You'll want to play with different lengths for your own preferences and to see what works best for you.
Being able to see price bounce between these zones should hopefully give you some ideas on how you could potentially use this.
Credit to LazyBear for the initial idea.
PIP COLLECTOR - REPAINT FIX w/ ALERTSThis fixes the repaint issue in LazyBear's Pip collector and adds alert capability. This strips away much of the original indicator, but it is a clear signal for longing and shorting, good to base off for live trading. As always, find a good entry and have an exit plan.

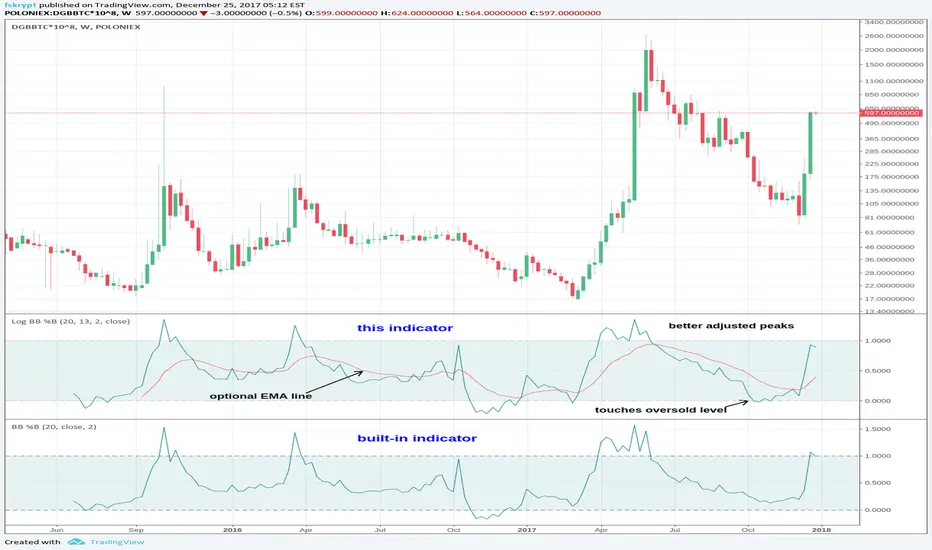
Log Bollinger Bands %BB Oscillator [Krypt]This indicator is almost identical to "Bollinger Bands %BB" except its calculations are performed in logspace and it adds an optional EMA line (after LazyBear's idea).
On Balance Volume (CCI-coded) [Krypt]This is a straightforward modification of LazyBear's CCI-coded OBV indicator with the following changes:
1) uses log-hl2 as source, which seems to be a more stable indicator of price change than close
2) adds optional price smoothing

RSI/MFI with Volatility Bands [GVD]This is an edit of the LAzyBear script.
The script is adjusted to show both the RSI and the MFI on 1 chart.

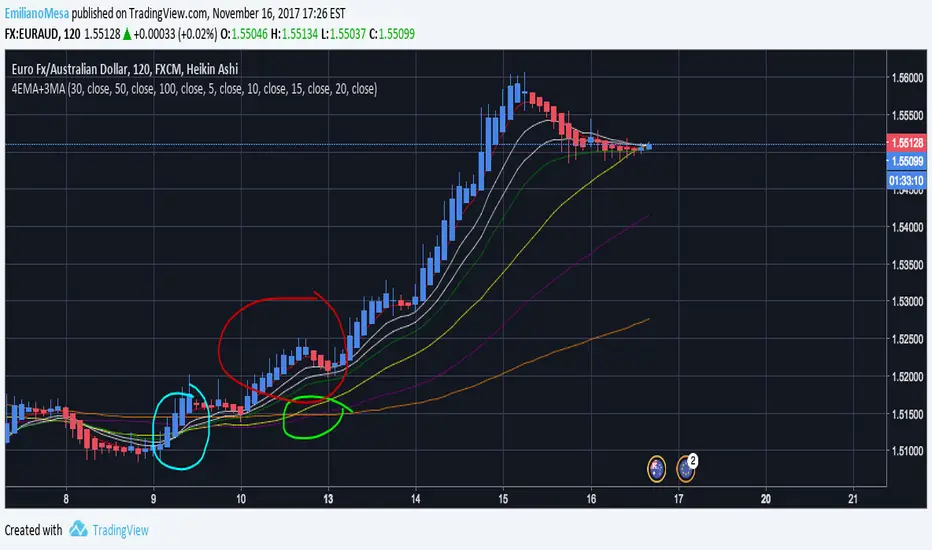
4EMA+3MABased on LazyBear 8MA I decided to do something similar for my personal use. I created an "Alligator" which works with 4 EMA lines and without "future" prediction, it will show you the most recent trend only, creating a later call than the original alligator yet a more precise one. Then there are the 3 MA with huge periods, including 30,50,100. This allows the trader to have a more general idea of the trend compared to that of the 4EMA's which in fact give more value to the current trend. You can change all colors and values.
Details:
As you can see in the graph both EMA & MA work great together. For instance look the blue circle, EMA "Alligator" was crossed giving entry for an early call (which was right), and later on the MA's crossed too! Giving the indication a huge trend was about to appear.
NOTE: Follow my predictions under your own risk. I apreciate all constructive feedback and support on how to improve. Thank you.
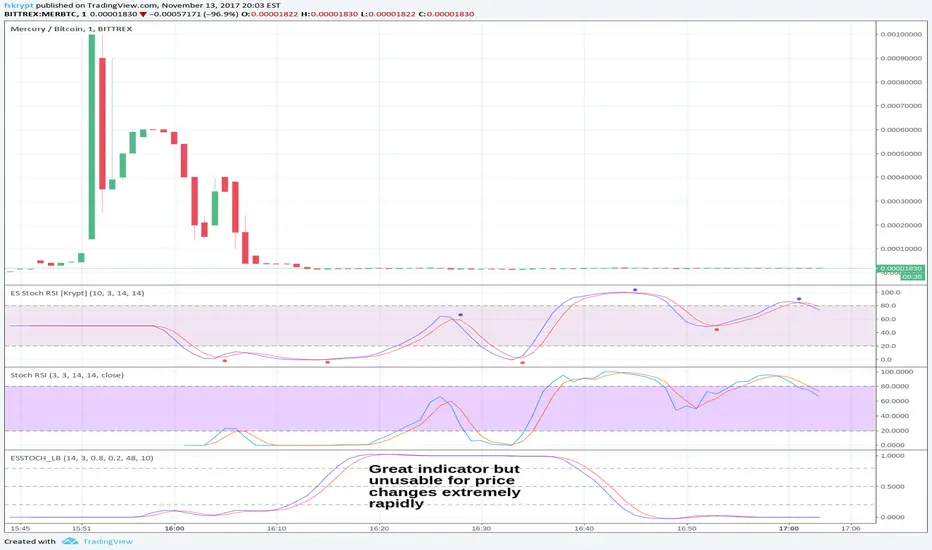
Ehlers-Smoothed Stochastic RSI [Krypt]This script uses a regular Stochastic RSI formula and then runs Ehlers' Super Smoother on top of it. It also provides buy/sell signals on crossovers.
The script is inspired by LazyBear Ehlers-Smoothed Stochastic RSI with Roofing Filter, except I find that the Roofing filter (existing implementation) does not work well near extreme price changes, where a regular formula is preferable. The Ehlers Super Smoother however is excellent and seems to provide earlier signals in most cases than an EMA-EMA smoother. Combined, the super-smoother and regular Stochastic RSI formula provide very good results.
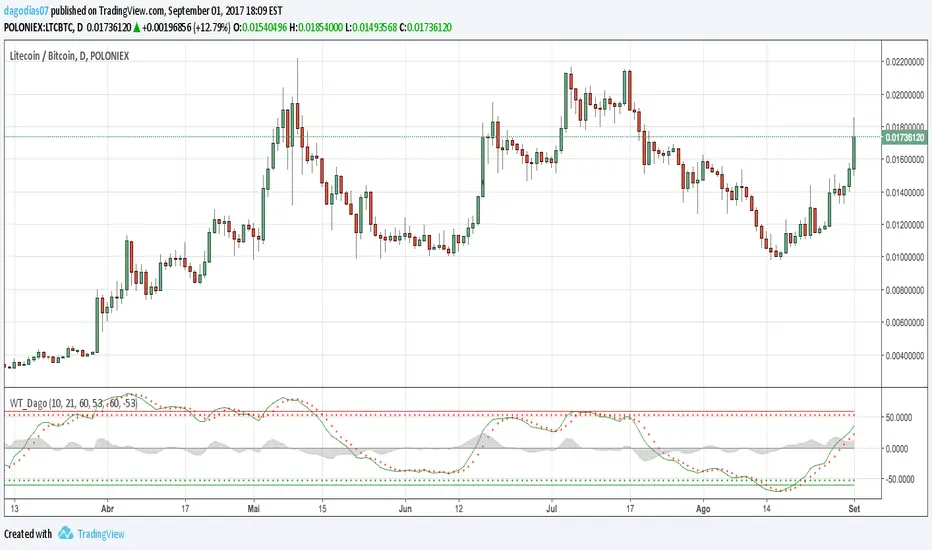
WaveTrend [DagoDias]@author LazyBear -- Modificado por Dagodias adicionado títulos às variáveis e traduzido para o Português.
Através dos títulos fica melhor para customizar o indicador e criar alertas a partir do indicador.
Para utilização em Criptomoedas acredito ser interessante suavemente levantar as linhas base; tornando a área de sobre venda antecipada.
Este indicador não é recomendado para fortes tendências.
BlackCompositIndicator4OverlayThis is not new indicator.
// Candle Patterns Indicator created by Robert N. 030715
// Volume Indicator @author LazyBear
// Updated and translated by Blyayshman
Это не новый индикатор - это компиляция нескольких для удобства одновременного отображения и экономии разрешенных индикаторов.
Эта версия для отображения на главном экране, вместе с графиком.
Можно отобразить до 4-х MA, 2-х EMA и анализатор паттернов японских свечей.
Пожелания и предложения приветствуются.
OBV Oscillatori like lazyBear's script.
it is also from his.
and i added ma.
that ma can help you to read volume moving direction.
i just think so.

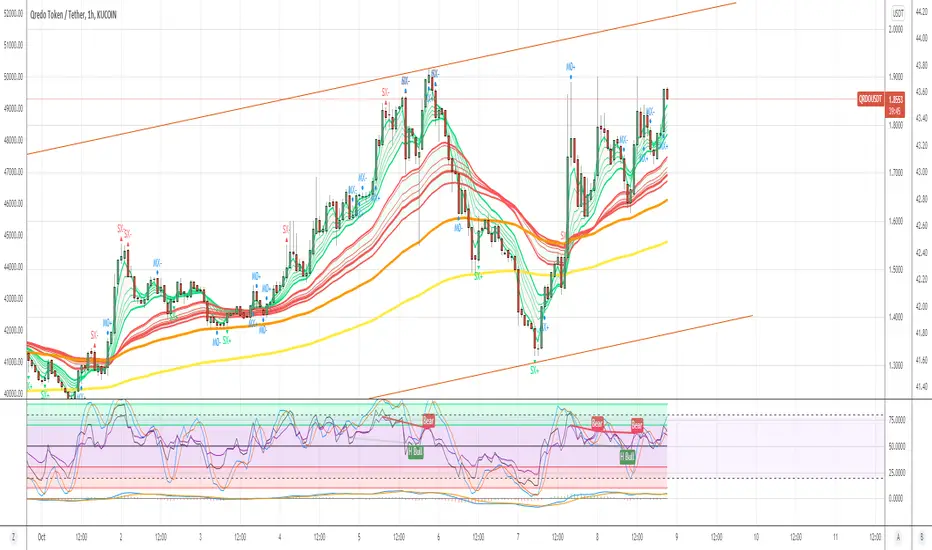
Godmode 3.1.4 - SNOW_CITY SCALPER EDITION - 7/2017 Updates to xSilas Godmode Oscillator published December 19th, 2014
Thanks to LEGION, LAZYBEAR, Ni6HTH4wK, xSilas
Updates:
Changed default sources to include BITSTAMP and REMOVED BTC-e
Changed default lengths for SCALPING SUPREMACY - See Instructions
Changed "Caution dots" to RED because YELLOW was hard to see.
I mostly Ignore the oscillators and only use the caution dots with this configuration:
MOST EFFECTIVE USE: BITSTAMP:BTCUSD BITSTAMP:BTCUSD
- Use on 1m charts of your BITMEX swap, yes 1m. I know, but it works better this way. 5m and 15m work best when using on an exchange index.
- IF overall 2H trend is DOWN, the 1m godmode on swap CAUTION DOTS appear on the UPPER BOUNDS means good SHORT entry points, and the lower dots suggest a possible reversal and good exit opportunity (not always)
- If overall 2H trend is UP, the 1m godmode on swap CAUTION DOTS appear on the LOWER BOUNDS means good LONG entry points, and upper dots suggest possible oversold if they start to round over, again not always.
This is ultra simple, and very effective.
Default settings for VERY sensitive CAUTION DOT blop: 17,6,4
Use these settings for a slightly less sensitive CAUTION DOT blop: 14,12,9


Noro's SILA v1.6LIn 1.6:
1) WaveTrend Oscilator (LazyBear's code)
2) Locomotive-pattern
3) A new distance for SILA lines
Noro's SILA v1.6L - the original and new system of finding of a trend.
SILA is not one trend indicator, but 8 different trend indicators in one. Therefore high precision.
For:
- any pair
- any timeframe >= H1

Supertrend Buy or Sell Signal - oringan fixI fixed SuperTrend little (origin if from LazyBear)
I love SuperTrend !!!!! so nice script!!!
and
I like alt-coin and 4hour candle.
That is why i fixed it.
Recommand 4hour and 4factor, 1pd.
and 1 trade per day.
It loose often but the loss ratio is about -8~15%
But when it win, it could earn much money!
If i have better idea, i will update this script
Korean : 4시간 봉 추천합니다. 하루에 한번정도의 매매를 목표로 설정했습니다. 더 좋은 설정값을 찾으면 업데이트할게요.
지표 추가 방법 간단 설명 (나중에 자세한 글 써서 스팀잇 할 예정)
아래 하단에 add to favorite 누르고, 차트 보는 중에 우클릭 - 지표넣기 - 즐겨찾기 - 지표이름찾아서 클릭.

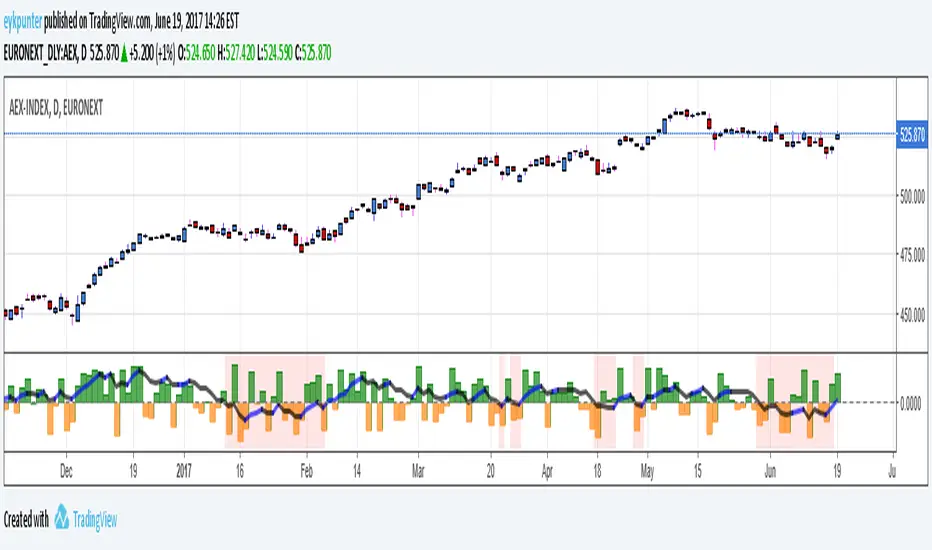
True Balance of powerThis is an improvement of the script published by LazyBear,
The improvements are:
1. it includes gaps because it uses true range in stead of the current bar,
2. it has been turned into a percent oscillator as the basic algorithm belongs in the family of stochastic oscillators.
Unlike the usual stochatics I refrained from over the top averaging and smoothing, nor did I attempt a signal line. There’s no need to make a mock MACD.
The indicator should be interpreted as a stochastics, the difference between Stochs and MACD is that stochs report inclinations, i.e. in which direction the market is edging, while MACD reports movements, in which direction the market is moving. Stochs are an early indicator, MACD is lagging. The emoline is a 30 period linear regression, I use linear regressions because these have no lagging, react immidiately to changes, I use a 30 period version because that is not so nervous. You might say that an MA gives an average while a linear regression gives an ‘over all’ of the periods.
The back ground color is red when the emoline is below zero, that is where the market ‘looks down’, white where the market ‘looks up’. This doesn’t mean that the market will actually go down or up, it may allways change its mind.
Have fun and take care, Eykpunter.
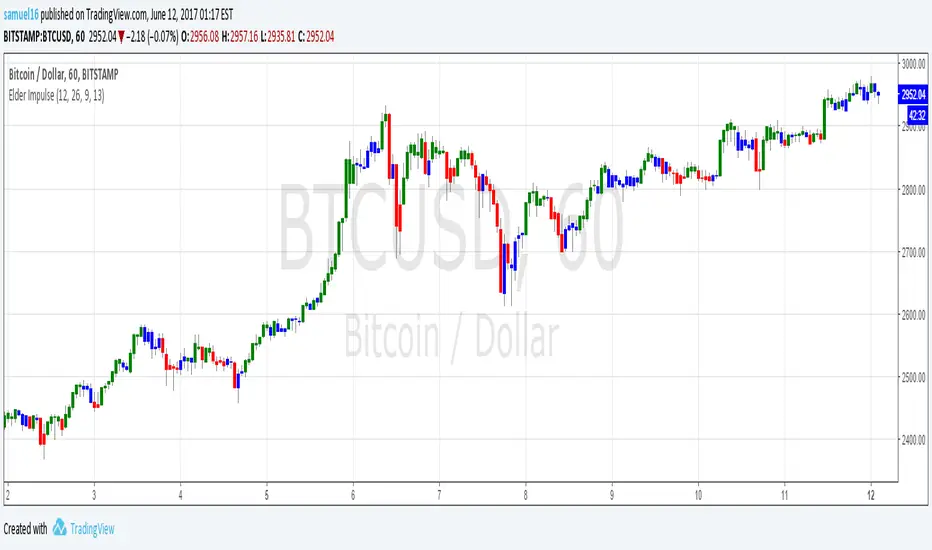
Elder Impulse SystemQuickly Identify Trends with the Elder Impulse Indicator.
Pretty much the same as , but written from scratch to be simpler to use and the source code easier to read (no offense, LazyBear)
For more info, see stockcharts.com
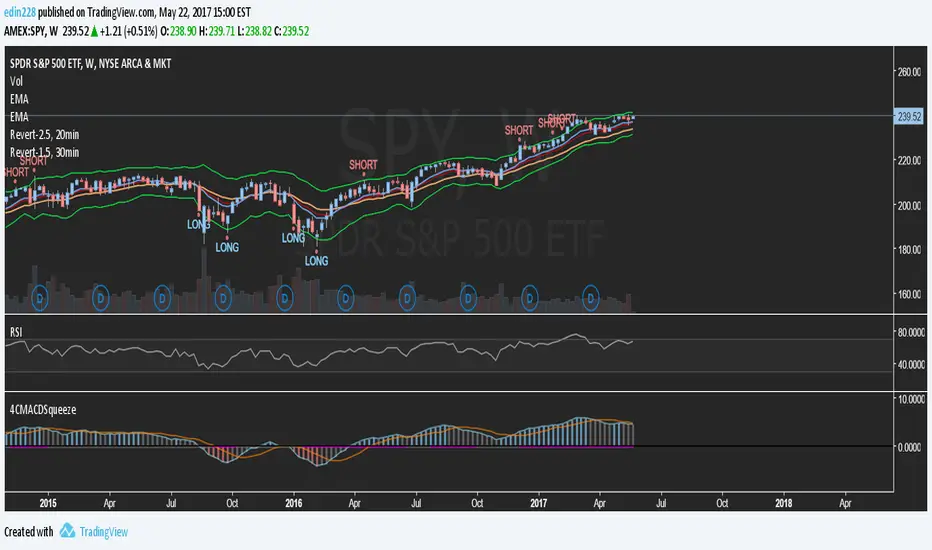
4CMACDSqueezeFrankenstein script i made using a regular macd, 4c macd by vkno422, and Squeeze by LazyBear
RSX FracticalityA little project I was working on to avoid studying for finals. Using LazyBear's RSX code for a smoother RSI, then taking the RSX of fib number lengths. Take the average of that, then the JMA of that from the same fib numbers. The average of that is then treated as the trend, take the average of the trend values from the main time frames, the script calls pretty far back so adding a W or M TF I think would throw the calculations off. Then I smoothed that value using the jma's to create the overall trend. I got the idea from Ehler's Empirical Mode Decomposition about identifying peaks and valleys and creating an average of that to create a range. The idea is that if the trend is above the Average Peak then it is a bull trend, less than the average valley it's a bear trend, in between it's ranging. It looks like it turned out alright, I'll be working on this idea of fractals a lot this summer to see if I can improve it or build something better off of the idea.

