CMYK RMI TRIPLE◊ Introduction
This script makes use of three RMI's, to indicate Overbought/Oversold.
Adjustments can easily be made, through its settings or script.
◊ Origin
The Relative Momentum Index was developed by Roger Altman and was introduced in his article in the February, 1993 issue of Technical Analysis of Stocks & Commodities magazine.
While RSI counts up and down days from close to close, the Relative Momentum Index counts up and down days from the close relative to a close x number of days ago.
This results in an RSI that is smoother.
This is a part of Project XIAM.
◊ Theoretical Approach
Philosophy γ :: consequential
◊ Usage
You can use this as an indicator for manual trading, or apply AUTOTVIEW to automate your trading.
My advice is to combine this with another indicator before you do this.
The script is written in an organized and flexible manner to do this.
◊ Features
3 RMI's with seperately adjustable HIGH / LOW levels.
Trend adjustment on the SLOW RMI.
Adjustable Interval between entries / Once per dip-top entry.
Take Profit & Stop loss
◊ Community
Wanna share your findings ? or need help resolving a problem ?
CMYK :: discord.gg
AUTOVIEW :: discordapp.com
TRADINGVIEW UNOFFICIAL :: discord.gg
Search in scripts for "Relative"
Currency Relative Strengths [GM] - Data IndicatorI created this tool for the purpose of determining strongest and weakest currencies over different periods of time. Each major currency is compared to the field of other majors and its average change is measured over a predetermined period of time. The result is displayed as a percentage. I use it for trend following but it can also be used to fade exhaustion.
Instructions
Add indicator to chart
Select a time frame under settings
Place cursor over period of interest
Click "Data Window" on right hand side bar
View % change avg values for each currency

RSI: Evolved [DAFE]RSI: Evolved : The Ultimate Momentum Intelligence Engine
30+ RSI Engines. 15+ Zero-Lag Smoothers. The Revolutionary Quantum Horizon. This is Not Just an RSI. This is the Evolution of Momentum.
█ PHILOSOPHY: BEYOND THE OSCILLATOR, INTO THE NEXUS
The standard Relative Strength Index is a relic. It is a brilliant, timeless concept trapped in a rigid, one-dimensional formula developed in the 1970s. It assumes all market momentum is uniform, that all volatility is equal, and that a single mathematical lens is sufficient to view the infinitely complex character of modern markets. It is not.
RSI: Evolved was not created to be another RSI. It was engineered to be the definitive evolution of momentum analysis. This is not an indicator; it is a powerful, interactive research environment. It is a laboratory where you, the trader, can move beyond the static "one-size-fits-all" approach and forge a momentum oscillator that is perfectly adapted to the unique physics of your market, timeframe, and trading style.
This suite deconstructs the very DNA of the RSI, rebuilding it with a library of over 30 distinct, mathematically diverse calculation engines . From timeless classics and exotic variations to proprietary DAFE quantum models, this suite provides an unparalleled arsenal for quantifying the unseen forces of market momentum.
█ THE EVOLUTION: WHAT MAKES THIS UNLIKE ANY OTHER RSI?
This is not just a collection of features; it is a seamlessly integrated, multi-layered analytical system. It stands in a class of its own for several key reasons:
The 30+ Algorithm Core: At its heart is a library of over 30 unique RSI calculation engines. You can now choose an engine based on its mathematical properties—whether you need the zero-lag responsiveness of a Hull RSI, the time-warping capability of a Laguerre RSI, or the predictive power of a DAFE Quantum Fusion RSI.
Advanced Post-Processing: After the RSI is calculated, it passes through a multi-stage refinement process. First, choose from over 15+ professional-grade smoothing algorithms to create a crystal-clear signal. Then, activate the intelligent Filter Module to scale the RSI's output based on trend, volatility, or momentum regimes.
The Quantum Horizon & Temporal Wave: This is a revolutionary leap in data visualization. The indicator projects the historical momentum waves from higher timeframes directly onto your main price chart as a futuristic, holographic overlay. You can now see the alignment (or divergence) of macro momentum without ever looking away from price action. This is multi-timeframe analysis evolved into an art form.
Dynamic, Volatility-Adaptive Zones: Static 70/30 levels are obsolete. Evolved's "Quantum Zones" are alive; they "breathe" with market volatility. They automatically widen during powerful trends to keep you in a winning trade and tighten during choppy consolidation to help you catch reversals with greater precision.
Comprehensive Analytical Modules: This is a full suite of institutional-grade tools, including a powerful regular and hidden Divergence Engine , a multi-timeframe Consensus Dashboard , and dynamic RSI Bands (Bollinger, Keltner, etc.) plotted directly on the oscillator.
█ THE QUANTUM HORIZON & TEMPORAL WAVE: SEEING MOMENTUM IN 4D
This groundbreaking feature fundamentally changes how you interact with multi-timeframe momentum data. The Quantum Horizon is a dedicated visualization module that projects up to three "Temporal Waves" directly onto your main price chart. Each wave is a historical representation of a momentum oscillator (RSI, MFI, or Stoch RSI) pulled from a higher timeframe of your choice. Instead of flipping between charts or cluttering your screen with multiple indicators, you get an immediate, intuitive, and aesthetically stunning view of the market's complete momentum structure.
Each Temporal Wave is a self-contained universe, rendered as a glowing, flowing line within its own gridded channel. This channel is not just for show; it represents the 0-100 scale of the oscillator, with key 30, 50, and 70 levels marked for reference. You can see the history of momentum, its peaks, its troughs, and its crossovers with its own signal line. This allows you to visually identify macro divergences, trend alignment, and exhaustion points on your primary trading chart, transforming your analysis from a fragmented process into a single, unified experience. This is no longer just an indicator; it is a true Heads-Up Display for the flow of time and momentum.
█ THE ARSENAL: A DEEP DIVE INTO THE RSI & SMOOTHING ENGINES
This is your library of mathematical DNA. Understanding your tools is the first step to mastery. The 30+ RSI types are grouped into distinct families, each with a unique philosophy.
THE RSI ENGINE FAMILIES
The Classics (Wilder's, Cutler's, EMA, WMA): These are the foundational building blocks of momentum analysis. They provide a reliable, time-tested baseline. Wilder's uses the RMA for a unique smoothing characteristic, while Cutler's uses the SMA for a more direct, arithmetic average of gains and losses. The EMA and WMA versions offer increased responsiveness by weighting recent price action more heavily.
The Low-Lag Warriors (DEMA, TEMA, Hull, ZLEMA): This family is engineered specifically to combat the inherent lag of classical averages. The Double and Triple EMA (DEMA, TEMA) use a composite of multiple EMAs to reduce latency. The Zero-Lag EMA (ZLEMA) attempts to remove lag by adjusting the source price with its own past data. The Hull RSI is a standout, using a weighted moving average calculation to achieve a remarkable balance of extreme smoothness and near-zero lag, making it ideal for scalping.
The Exotics (Laguerre, Connors, Fisher, KAMA): These engines employ advanced mathematical concepts to view momentum through a different lens. The Laguerre RSI , based on John Ehlers' work, uses a time-warping, non-linear filter that can be extremely responsive to changes in trend. The Fisher Transform RSI normalizes the output to a Gaussian distribution, making peaks and troughs sharper and more defined for clearer signals. The KAMA Adaptive RSI is a "smart" algorithm that automatically slows its calculation in choppy markets and speeds it up in strong trends.
The Volume-Based (Volume-Weighted, MFI, VWAP-Weighted): This family infuses price momentum with volume data, providing a measure of conviction. They answer not just "how fast is price moving?" but "how much participation is behind the move?". The Money Flow RSI (MFI) is a classic, while the Volume-Weighted and VWAP-Weighted versions directly incorporate volume into the gain/loss calculation, giving more weight to high-volume bars.
The DAFE Proprietary Engines (The "God Mode" Algos): The crown jewels of the Laboratory, these are custom-built, proprietary algorithms you will not find anywhere else.
DAFE Quantum Fusion: This engine calculates RSI on three harmonic timeframes simultaneously (based on the Golden Ratio) and "superimposes" them using a dynamic weighting system based on volume and momentum confidence. It is the most robust and balanced all-rounder.
DAFE Kinetic Energy: Based on the physics principle that Momentum = Mass × Velocity. Standard RSI only sees Velocity (price change). Kinetic RSI weights every price move by Relative Volume (Mass), measuring the true "force" of the market.
DAFE Spectral: This engine uses concepts from Digital Signal Processing to analyze the frequency of price moves. It automatically differentiates between the "Signal" (the underlying trend) and the "Noise" (the chop), and adapts its calculation speed accordingly.
DAFE Entropy Flow: A unique engine that uses Information Theory to measure market "disorder." In chaotic, high-entropy markets, it automatically dampens its own signal to avoid whipsaws. In orderly, low-entropy trends, it sharpens its signal to be more responsive.
THE POST-SMOOTHING FILTERS
After your primary RSI is calculated, you can pass it through one of over 15 advanced filters for unparalleled clarity.
Low-Lag (Hull, DEMA, TEMA): Ideal for responsive smoothing that tracks the raw RSI closely.
Adaptive (KAMA, VIDYA): Perfect for smart, regime-aware smoothing that is slow in chop and fast in trends.
DSP & Scientific (SuperSmoother, Butterworth, Gaussian, Jurik-Style): The pinnacle of signal processing. These filters provide the absolute cleanest signal with minimal lag, leveraging advanced digital signal processing techniques to surgically remove noise.
█ THE ANALYTICAL MODULES: BEYOND THE LINE
Dynamic Zones: Your overbought/oversold levels (e.g., 70/30) are no longer static lines. They are living, breathing zones that respond to market volatility. They automatically widen during powerful, high-volatility trends to prevent you from selling a strong uptrend too early. Conversely, they tighten during low-volatility consolidation, allowing you to catch smaller, mean-reverting moves with greater precision. This is a crucial evolution for trading in modern, dynamic markets.
Divergence Engine: The automated engine works tirelessly in the background to detect critical disconnects between price and momentum. It automatically identifies and plots both Regular Divergences (which often signal major trend reversals) and Hidden Divergences (which often signal trend continuations after a pullback) with clear on-chart and in-pane markers and lines.
MTF Dashboard: Context is everything. This module provides an instant read on the momentum across three higher timeframes of your choice. The "Consensus" reading tells you if all timeframes are aligned ("ALL BULL" or "ALL BEAR"), providing powerful contextual confirmation for your trades and helping you avoid taking signals that go against the macro flow.
RSI Bands: This module applies a full-fledged band methodology (Bollinger Bands, Keltner Channels, etc.) directly to the RSI line itself. A pierce of the upper or lower band is a powerful sign of a statistical extreme, often preceding a sharp reversion back to the mean. A "squeeze" in the RSI bands often precedes an explosive move in momentum.
Signal Line & Histogram: The fast-moving RSI line is paired with a slower, smoother Signal Line of your choice. Crossovers between these two lines can be used as effective entry/exit triggers that are often more reliable than simple overbought/oversold levels. The histogram visually represents the momentum (the velocity and acceleration) of the RSI itself, turning from light to dark green in a strengthening uptrend, for example.
█ DEVELOPMENT PHILOSOPHY
RSI: Evolved was forged from a single, guiding principle: momentum is not a fixed property; it is a dynamic, multi-faceted force with a unique character in every market. This tool was designed for the trader who is no longer satisfied with a one-size-fits-all indicator. It is for the analyst, the tinkerer, the scientist—the individual who seeks to deconstruct, understand, and master the hidden physics of market momentum. This is a tool for forging your own alpha, not just following a lagging line.
RSI: Evolved is designed to give you that patience and discipline, providing a crystal-clear, multi-dimensional view of momentum so you can act with precision when the perfect setup finally arrives.
█ DISCLAIMER AND BEST PRACTICES
THIS IS AN ADVANCED ANALYTICAL TOOL: This indicator provides intelligence on momentum, not financial advice. It should be used as a core component of a complete trading strategy.
RISK MANAGEMENT IS PARAMOUNT: All trading involves substantial risk. Never risk more capital than you are prepared to lose.
START WITH A ROBUST BASE: The "DAFE Quantum Fusion" engine with the "SuperSmoother" is an exceptionally powerful and well-balanced starting point for most markets.
USE CONFLUENCE: The highest probability signals occur when multiple modules agree. For example: a Regular Bullish Divergence, as the RSI crosses up from an Extreme Oversold Dynamic Zone, while the Quantum Horizon shows the higher timeframes are also starting to turn up.
"The hard part is not making the decision to buy or sell, but having the patience and discipline to wait for the right setup."
— Mark Weinstein
Taking you to school. - Dskyz, Trade with Anticipation. Trade with Strength. Trade with RSI: Evolved

RSI Distribution [Kodexius]RSI Distribution is a statistics driven visualization companion for the classic RSI oscillator. In addition to plotting RSI itself, it continuously builds a rolling sample of recent RSI values and projects their distribution as a forward drawn histogram, so you can see where RSI has spent most of its time over the selected lookback window.
The indicator is designed to add context to oscillator readings. Instead of only treating RSI as a single point estimate that is either “high” or “low”, you can evaluate the current RSI level relative to its own recent history. This makes it easier to recognize when the market is operating inside a familiar regime, and when RSI is pushing into rarer tail conditions that tend to appear during momentum bursts, exhaustion, or volatility expansion.
To complement the histogram, the script can optionally overlay a Gaussian curve fitted to the sample mean and standard deviation. It also runs a Jarque Bera normality check, based on skewness and excess kurtosis, and surfaces the result both visually and in a compact dashboard. On the oscillator panel itself, RSI is presented with a clean gradient line and standard overbought and oversold references, with fills that become more visible when RSI meaningfully extends beyond key thresholds.
🔹 Features
1. Distribution Histogram of Recent RSI Values
The script stores the last N RSI values in an internal sample and uses that rolling window to compute a frequency distribution across a user selected number of bins. The histogram is drawn into the future by a configurable width in bars, which keeps it readable and prevents it from colliding with the active RSI plot. The result is a compact visual summary of where RSI clusters most often, whether it is spending more time near the center, or shifting toward higher or lower regimes.
2. Gaussian Overlay for Shape Intuition
If enabled, a fitted bell curve is drawn on top of the histogram using the sample mean and standard deviation. This overlay is not intended as a direct trading signal. Its purpose is to provide a fast visual comparator between the empirical RSI distribution and a theoretical normal shape. When the histogram diverges strongly from the curve, you can quickly spot skew, heavy tails, or regime changes that often occur when market structure or volatility conditions shift.
3. Jarque Bera Normality Check With Clear PASS/FAIL Feedback
The script computes skewness and excess kurtosis from the RSI sample, then forms the Jarque Bera statistic and compares it to a fixed 95% critical value. When the distribution is closer to normal under this test, the status is marked as PASS, otherwise it is marked as FAIL. This result is displayed in the dashboard and can also influence the histogram styling, giving immediate feedback about whether the recent RSI behavior resembles a bell shaped distribution or a more distorted, regime driven profile.
Jarque Bera is a goodness of fit test that evaluates whether a dataset looks consistent with a normal distribution by checking two shape properties: skewness (asymmetry) and kurtosis (tail heaviness, expressed here as excess kurtosis where a perfect normal has 0). Under the null hypothesis of normality, skewness should be near 0 and excess kurtosis should be near 0. The test combines deviations in both into a single statistic, which is then compared to a chi square threshold. A PASS in this script means the sample does not show strong evidence against normality at the chosen threshold, while a FAIL means the sample is meaningfully skewed, heavy tailed, or both. In practical trading terms, a FAIL often suggests RSI is behaving in a regime where extremes and asymmetry are more common, which is typical during strong trends, volatility expansions, or one sided market pressure. It is still a statistical diagnostic, not a prediction tool, and results can vary with lookback length and market conditions.
4. Integrated Stats Dashboard
A compact table in the top right summarizes key distribution moments and the normality result: Mean, StdDev, Skewness, Kurtosis, and the JB statistic with PASS/FAIL text. Skewness is color coded by sign to quickly distinguish right skew (more time at higher RSI) versus left skew (more time at lower RSI), which can be helpful when diagnosing trend bias and momentum persistence.
5. RSI Visual Quality and Context Zones
RSI is plotted with a gradient color scheme and standard overbought and oversold reference lines. The overbought and oversold areas are filled with a smart gradient so visual emphasis increases when RSI meaningfully extends beyond the 70 and 30 regions, improving readability without overwhelming the panel.
🔹 Calculations
This section summarizes the main calculations and transformations used internally.
1. RSI Series
RSI is computed from the selected source and length using the standard RSI function:
rsi_val = ta.rsi(rsi_src, rsi_len)
2. Rolling Sample Collection
A float array stores recent RSI values. Each bar appends the newest RSI, and if the array exceeds the configured lookback, the oldest value is removed. Conceptually:
rsi_history.push(rsi_val)
if rsi_history.size() > lookback
rsi_history.shift()
This maintains a fixed size window that represents the most recent RSI behavior.
3. Mean, Variance, and Standard Deviation
The script computes the sample mean across the array. Variance is computed as sample variance using (n - 1) in the denominator, and standard deviation is the square root of that variance. These values serve both the dashboard display and the Gaussian overlay parameters.
4. Skewness and Excess Kurtosis
Skewness is calculated from the standardized third central moment with a small sample correction. Kurtosis is computed as excess kurtosis (kurtosis minus 3), so the normal baseline is 0. These two metrics summarize asymmetry and tail heaviness, which are the core ingredients for the Jarque Bera statistic.
5. Jarque Bera Statistic and Decision Rule
Using skewness S and excess kurtosis K, the Jarque Bera statistic is computed as:
JB = (n / 6.0) * (S^2 + 0.25 * K^2)
Normality is flagged using a fixed critical value:
is_normal = JB < 5.991
This produces a simple PASS/FAIL classification suitable for fast chart interpretation.
6. Histogram Binning and Scaling
The RSI domain is treated as 0 to 100 and divided into a configurable number of bins. Bin size is:
bin_size = 100.0 / bins
Each RSI sample maps to a bin index via floor(rsi / bin_size), with clamping to ensure the index stays within valid bounds. The script counts occurrences per bin, tracks the maximum frequency, and normalizes each bar height by freq/max_freq so the histogram remains visually stable and comparable as the window updates.
7. Gaussian Curve Overlay (Optional)
The Gaussian overlay uses the normal probability density function with mu as the sample mean and sigma as the sample standard deviation:
normal_pdf(x) = (1 / (sigma * sqrt(2*pi))) * exp(-0.5 * ((x - mu)/sigma)^2)
For drawing, the script samples x across the histogram width, evaluates the PDF, and normalizes it relative to its peak so the curve fits within the same visual height scale as the histogram.

RSI Forecast Colorful [DiFlip]RSI Forecast Colorful
Introducing one of the most complete RSI indicators available — a highly customizable analytical tool that integrates advanced prediction capabilities. RSI Forecast Colorful is an evolution of the classic RSI, designed to anticipate potential future RSI movements using linear regression. Instead of simply reacting to historical data, this indicator provides a statistical projection of the RSI’s future behavior, offering a forward-looking view of market conditions.
⯁ Real-Time RSI Forecasting
For the first time, a public RSI indicator integrates linear regression (least squares method) to forecast the RSI’s future behavior. This innovative approach allows traders to anticipate market movements based on historical trends. By applying Linear Regression to the RSI, the indicator displays a projected trendline n periods ahead, helping traders make more informed buy or sell decisions.
⯁ Highly Customizable
The indicator is fully adaptable to any trading style. Dozens of parameters can be optimized to match your system. All 28 long and short entry conditions are selectable and configurable, allowing the construction of quantitative, statistical, and automated trading models. Full control over signals ensures precise alignment with your strategy.
⯁ Innovative and Science-Based
This is the first public RSI indicator to apply least-squares predictive modeling to RSI calculations. Technically, it incorporates machine-learning logic into a classic indicator. Using Linear Regression embeds strong statistical foundations into RSI forecasting, making this tool especially valuable for traders seeking quantitative and analytical advantages.
⯁ Scientific Foundation: Linear Regression
Linear regression is a fundamental statistical method that models the relationship between a dependent variable y and one or more independent variables x. The general formula for simple linear regression is:
y = β₀ + β₁x + ε
where:
y = predicted variable (e.g., future RSI value)
x = explanatory variable (e.g., bar index or time)
β₀ = intercept (value of y when x = 0)
β₁ = slope (rate of change of y relative to x)
ε = random error term
The goal is to estimate β₀ and β₁ by minimizing the sum of squared errors. This is achieved using the least squares method, ensuring the best linear fit to historical data. Once the coefficients are calculated, the model extends the regression line forward, generating the RSI projection based on recent trends.
⯁ Least Squares Estimation
To minimize the error between predicted and observed values, we use the formulas:
β₁ = Σ((xᵢ - x̄)(yᵢ - ȳ)) / Σ((xᵢ - x̄)²)
β₀ = ȳ - β₁x̄
Σ denotes summation; x̄ and ȳ are the means of x and y; and i ranges from 1 to n (number of observations). These equations produce the best linear unbiased estimator under the Gauss–Markov assumptions — constant variance (homoscedasticity) and a linear relationship between variables.
⯁ Linear Regression in Machine Learning
Linear regression is a foundational component of supervised learning. Its simplicity and precision in numerical prediction make it essential in AI, predictive algorithms, and time-series forecasting. Applying regression to RSI is akin to embedding artificial intelligence inside a classic indicator, adding a new analytical dimension.
⯁ Visual Interpretation
Imagine a time series of RSI values like this:
Time →
RSI →
The regression line smooths these historical values and projects itself n periods forward, creating a predictive trajectory. This projected RSI line can cross the actual RSI, generating sophisticated entry and exit signals. In summary, the RSI Forecast Colorful indicator provides both the current RSI and the forecasted RSI, allowing comparison between past and future trend behavior.
⯁ Summary of Scientific Concepts Used
Linear Regression: Models relationships between variables using a straight line.
Least Squares: Minimizes squared prediction errors for optimal fit.
Time-Series Forecasting: Predicts future values from historical patterns.
Supervised Learning: Predictive modeling based on known output values.
Statistical Smoothing: Reduces noise to highlight underlying trends.
⯁ Why This Indicator Is Revolutionary
Scientifically grounded: Built on statistical and mathematical theory.
First of its kind: The first public RSI with least-squares predictive modeling.
Intelligent: Incorporates machine-learning logic into RSI interpretation.
Forward-looking: Generates predictive, not just reactive, signals.
Customizable: Exceptionally flexible for any strategic framework.
⯁ Conclusion
By combining RSI and linear regression, the RSI Forecast Colorful allows traders to predict market momentum rather than simply follow it. It's not just another indicator: it's a scientific advancement in technical analysis technology. Offering 28 configurable entry conditions and advanced signals, this open-source indicator paves the way for innovative quantitative systems.
⯁ Example of simple linear regression with one independent variable
This example demonstrates how a basic linear regression works when there is only one independent variable influencing the dependent variable. This type of model is used to identify a direct relationship between two variables.
⯁ In linear regression, observations (red) are considered the result of random deviations (green) from an underlying relationship (blue) between a dependent variable (y) and an independent variable (x)
This concept illustrates that sampled data points rarely align perfectly with the true trend line. Instead, each observed point represents the combination of the true underlying relationship and a random error component.
⯁ Visualizing heteroscedasticity in a scatterplot with 100 random fitted values using Matlab
Heteroscedasticity occurs when the variance of the errors is not constant across the range of fitted values. This visualization highlights how the spread of data can change unpredictably, which is an important factor in evaluating the validity of regression models.
⯁ The datasets in Anscombe’s quartet were designed to have nearly the same linear regression line (as well as nearly identical means, standard deviations, and correlations) but look very different when plotted
This classic example shows that summary statistics alone can be misleading. Even with identical numerical metrics, the datasets display completely different patterns, emphasizing the importance of visual inspection when interpreting a model.
⯁ Result of fitting a set of data points with a quadratic function
This example illustrates how a second-degree polynomial model can better fit certain datasets that do not follow a linear trend. The resulting curve reflects the true shape of the data more accurately than a straight line.
⯁ What Is RSI?
The RSI (Relative Strength Index) is a technical indicator developed by J. Welles Wilder. It measures the velocity and magnitude of recent price movements to identify overbought and oversold conditions. The RSI ranges from 0 to 100 and is commonly used to identify potential reversals and evaluate trend strength.
⯁ How RSI Works
RSI is calculated from average gains and losses over a set period (commonly 14 bars) and plotted on a 0–100 scale. It consists of three key zones:
Overbought: RSI above 70 may signal an overbought market.
Oversold: RSI below 30 may signal an oversold market.
Neutral Zone: RSI between 30 and 70, indicating no extreme condition.
These zones help identify potential price reversals and confirm trend strength.
⯁ Entry Conditions
All conditions below are fully customizable and allow detailed control over entry signal creation.
📈 BUY
🧲 Signal Validity: Signal remains valid for X bars.
🧲 Signal Logic: Configurable using AND or OR.
🧲 RSI > Upper
🧲 RSI < Upper
🧲 RSI > Lower
🧲 RSI < Lower
🧲 RSI > Middle
🧲 RSI < Middle
🧲 RSI > MA
🧲 RSI < MA
🧲 MA > Upper
🧲 MA < Upper
🧲 MA > Lower
🧲 MA < Lower
🧲 RSI (Crossover) Upper
🧲 RSI (Crossunder) Upper
🧲 RSI (Crossover) Lower
🧲 RSI (Crossunder) Lower
🧲 RSI (Crossover) Middle
🧲 RSI (Crossunder) Middle
🧲 RSI (Crossover) MA
🧲 RSI (Crossunder) MA
🧲 MA (Crossover)Upper
🧲 MA (Crossunder)Upper
🧲 MA (Crossover) Lower
🧲 MA (Crossunder) Lower
🧲 RSI Bullish Divergence
🧲 RSI Bearish Divergence
🔮 RSI (Crossover) Forecast MA
🔮 RSI (Crossunder) Forecast MA
📉 SELL
🧲 Signal Validity: Signal remains valid for X bars.
🧲 Signal Logic: Configurable using AND or OR.
🧲 RSI > Upper
🧲 RSI < Upper
🧲 RSI > Lower
🧲 RSI < Lower
🧲 RSI > Middle
🧲 RSI < Middle
🧲 RSI > MA
🧲 RSI < MA
🧲 MA > Upper
🧲 MA < Upper
🧲 MA > Lower
🧲 MA < Lower
🧲 RSI (Crossover) Upper
🧲 RSI (Crossunder) Upper
🧲 RSI (Crossover) Lower
🧲 RSI (Crossunder) Lower
🧲 RSI (Crossover) Middle
🧲 RSI (Crossunder) Middle
🧲 RSI (Crossover) MA
🧲 RSI (Crossunder) MA
🧲 MA (Crossover)Upper
🧲 MA (Crossunder)Upper
🧲 MA (Crossover) Lower
🧲 MA (Crossunder) Lower
🧲 RSI Bullish Divergence
🧲 RSI Bearish Divergence
🔮 RSI (Crossover) Forecast MA
🔮 RSI (Crossunder) Forecast MA
🤖 Automation
All BUY and SELL conditions can be automated using TradingView alerts. Every configurable condition can trigger alerts suitable for fully automated or semi-automated strategies.
⯁ Unique Features
Linear Regression Forecast
Signal Validity: Keep signals active for X bars
Signal Logic: AND/OR configuration
Condition Table: BUY/SELL
Condition Labels: BUY/SELL
Chart Labels: BUY/SELL markers above price
Automation & Alerts: BUY/SELL
Background Colors: bgcolor
Fill Colors: fill
Linear Regression Forecast
Signal Validity: Keep signals active for X bars
Signal Logic: AND/OR configuration
Condition Table: BUY/SELL
Condition Labels: BUY/SELL
Chart Labels: BUY/SELL markers above price
Automation & Alerts: BUY/SELL
Background Colors: bgcolor
Fill Colors: fill

RSI + MACD Multi-Timeframe StrategyThis strategy combines the Relative Strength Index (RSI) from the daily timeframe with the Moving Average Convergence Divergence (MACD) from the 4-hour timeframe to generate precise long entry and exit signals.
The system uses a multi-timeframe approach to align longer-term trend conditions with shorter-term momentum shifts — allowing traders to catch dips with confirmation and exit before reversals.
🧠 Strategy Logic
✅ Long Entry Condition:
- RSI on the daily (1D) timeframe is oversold (below your defined threshold)
- MACD on the 4H timeframe crosses above the signal line
→ A long trade is opened when these two align
✅ Long Exit Condition:
- RSI on the daily timeframe is overbought
- MACD on the 4H timeframe crosses below the signal line
→ The long trade is closed when these two conditions are met
💡 This strategy currently supports long entries only. Short logic can be added if needed.
📊 Indicator Components
🔹 RSI (Relative Strength Index):
- A momentum oscillator that measures the speed and magnitude of price changes.
- Helps identify overbought (potential sell) and oversold (potential buy) conditions.
- Applied on the 1D timeframe (by default) to reflect broader market trend or exhaustion levels.
🔹 MACD (Moving Average Convergence Divergence):
- A trend-following momentum indicator based on moving averages.
- The MACD Line (fast EMA - slow EMA) crossing above the Signal Line indicates bullish momentum.
- Used here on the 4-hour timeframe (by default) for shorter-term momentum confirmation.
🔹 Multi-Timeframe (MTF) Logic:
- Uses request.security() to pull higher timeframe data (1D for RSI, 4H for MACD).
- Ensures no repainting, as it only uses closed candles from the higher timeframe.
- Aligns longer-term signals with shorter-term entries, reducing false signals.
📈 Plotting Options
The script includes a plot selector input allowing you to toggle between:
- RSI Plot (with overbought/oversold lines)
- MACD Plot (MACD line and signal line)
- This helps visualize signal conditions clearly on your chart.
🛠 Customization
- RSI & MACD settings are fully configurable
- RSI and MACD timeframes can be adjusted independently
⚠️ Disclaimer
This strategy is provided for educational and informational purposes only.
It is not financial advice or a recommendation to buy or sell any asset.
Past performance does not guarantee future results. Always test strategies in a simulated environment before live use, and consult with a licensed financial advisor for investment decisions.

Adiyogi Trend🟢🔴 “Adiyogi” Trend — Market Alignment Visualizer
“Adiyogi” Trend is a powerful, non-intrusive trend detection system built for traders who seek clarity, discipline, and alignment with true market flow. Inspired by the meditative stillness of Adiyogi and the need for mindful, high-probability decisions, this tool offers a clean and intuitive visual guide to trending environments — without cluttering the chart or pushing forced trades.
This is not a buy/sell signal generator. Instead, it is designed as a background confirmation engine that helps you stay on the right side of the market by identifying moments of true directional strength.
🧠 Core Logic
The “Adiyogi” Trend indicator highlights the background of your chart in green or red when multiple layers of strength and structure align — including momentum, market positioning, and relative force. Only when these internal components agree does the system activate a directional state.
It’s built on three foundational energies of trend confirmation:
Strength of movement
Structure in price action
Conviction in momentum
By combining these into one visual background, the indicator filters out indecision and helps you stay focused during real trend phases — whether you're day trading, swing trading, or holding longer-term positions.
📌 Core Concepts Behind the Tool
The indicator integrates three essential market filters—each confirming a different dimension of trend strength:
ADX (Average Directional Index) – Measures trend momentum.
You’ve chosen a very responsive setting (ADX Length = 2), which helps catch the earliest possible signs of momentum emergence.
The threshold is ADX ≥ 22, ensuring that weak or sideways markets are filtered out.
SuperTrend (10,1) – Captures short-term trend direction.
This setup follows price closely and reacts quickly to reversals, making it ideal for fast-moving assets or intraday strategies.
SuperTrend acts as the structural confirmation of directional bias.
RSI (Relative Strength Index) – Measures strength based on recent price closes.
You’ve configured RSI > 50 for bullish zones and < 50 for bearish—a neutral midpoint standard often used by professional traders.
This ensures that only trades in sync with momentum and recent strength are highlighted.
🌈 How It Visually Works
Background turns GREEN when:
ADX ≥ 22, indicating strong momentum
Price is above the 20 EMA and above SuperTrend (10,1)
RSI > 50, confirming recent strength
Background turns RED when:
ADX ≥ 22, indicating strong momentum
Price is below the 20 EMA and below SuperTrend (10,1)
RSI < 50, confirming recent weakness
The background remains neutral (transparent) when trend conditions are not clearly aligned—this is the tool's way of keeping you out of indecisive markets.
A label (BULL / BEAR) appears only when the bias flips from the previous one. This helps avoid repeated or redundant alerts, focusing your attention only when something changes.
📊 Practical Uses & Benefits
✅ Stay with the trend: Perfectly filters out choppy or sideways markets by only activating when conditions align across momentum, structure, and strength.
✅ Pre-trade confirmation: Use this tool to confirm trade setups from other indicators or price action patterns.
✅ Avoid noise: Prevent overtrading by focusing only on high-quality trend conditions.
✅ Visual clarity: Unlike arrows or plots that clutter the chart, this tool subtly highlights trend conditions in the background, preserving your price action view.
📍 Important Notes
This is not a buy/sell signal generator. It is a trend-confirmation system.
Use it in conjunction with your existing entry setups—such as breakouts, order blocks, retests, or candlestick patterns.
The tool helps you stay in sync with the dominant direction, especially when combining multiple timeframes.
Can be used on any market (stocks, forex, crypto, indices) and on any timeframe.

Multi TF Oscillators Screener [TradingFinder] RSI / ATR / Stoch🔵 Introduction
The oscillator screener is designed to simplify multi-timeframe analysis by allowing traders and analysts to monitor one or multiple symbols across their preferred timeframes—all at the same time. Users can track a single symbol through various timeframes simultaneously or follow multiple symbols in selected intervals. This flexibility makes the tool highly effective for analyzing diverse markets concurrently.
At the core of this screener lie two essential oscillators: RSI (Relative Strength Index) and the Stochastic Oscillator. The RSI measures the speed and magnitude of recent price movements and helps identify overbought or oversold conditions.
It's one of the most reliable indicators for spotting potential reversals. The Stochastic Oscillator, on the other hand, compares the current price to recent highs and lows to detect momentum strength and potential trend shifts. It’s especially effective in identifying divergences and short-term reversal signals.
In addition to these two primary indicators, the screener also displays helpful supplementary data such as the dominant candlestick type (Bullish, Bearish, or Doji), market volatility indicators like ATR and TR, and the four key OHLC prices (Open, High, Low, Close) for each symbol and timeframe. This combination of data gives users a comprehensive technical view and allows for quick, side-by-side comparison of symbols and timeframes.
🔵 How to Use
This tool is built for users who want to view the behavior of a single symbol across several timeframes simultaneously. Instead of jumping between charts, users can quickly grasp the state of a symbol like gold or Bitcoin across the 15-minute, 1-hour, and daily timeframes at a glance. This is particularly useful for traders who rely on multi-timeframe confirmation to strengthen their analysis and decision-making.
The tool also supports simultaneous monitoring of multiple symbols. Users can select and track various assets based on the timeframes that matter most to them. For example, if you’re looking for entry opportunities, the screener allows you to compare setups across several markets side by side—making it easier to choose the most favorable trade. Whether you’re a scalper focused on low timeframes or a swing trader using higher ones, the tool adapts to your workflow.
The screener utilizes the widely-used RSI indicator, which ranges from 0 to 100 and highlights market exhaustion levels. Readings above 70 typically indicate potential pullbacks, while values below 30 may suggest bullish reversals. Viewing RSI across timeframes can reveal meaningful divergences or alignments that improve signal quality.
Another key indicator in the screener is the Stochastic Oscillator, which analyzes the closing price relative to its recent high-low range. When the %K and %D lines converge and cross within the overbought or oversold zones, it often signals a momentum reversal. This oscillator is especially responsive in lower timeframes, making it ideal for spotting quick entries or exits.
Beyond these oscillators, the table includes other valuable data such as candlestick type (bullish, bearish, or doji), volatility measures like ATR and TR, and complete OHLC pricing. This layered approach helps users understand both market momentum and structure at a glance.
Ultimately, this screener allows analysts and traders to gain a full market overview with just one look—empowering faster, more informed, and lower-risk decision-making. It not only saves time but also enhances the precision and clarity of technical analysis.
🔵 Settings
🟣 Display Settings
Table Size : Lets you adjust the table’s visual size with options such as: auto, tiny, small, normal, large, huge.
Table Position : Sets the screen location of the table. Choose from 9 possible positions, combining vertical (top, middle, bottom) and horizontal (left, center, right) alignments.
🟣 Symbol Settings
Each of the 10 symbol slots comes with a full set of customizable parameters :
Enable Symbol : A checkbox to activate or hide each symbol from the table.
Symbol : Define or select the asset (e.g., XAUUSD, BTCUSD, EURUSD, etc.).
Timeframe : Set your desired timeframe for each symbol (e.g., 15, 60, 240, 1D).
RSI Length : Defines the period used in RSI calculation (default is 14).
Stochastic Length : Sets the period for the Stochastic Oscillator.
ATR Length : Sets the length used to calculate the Average True Range, a key volatility metric.
🔵 Conclusion
By combining powerful oscillators like RSI and Stochastic with full customization over symbols and timeframes, this tool provides a fast, flexible solution for technical analysts. Users can instantly monitor one or several assets across multiple timeframes without opening separate charts.
Individual configuration for each symbol, along with the inclusion of key metrics like candlestick type, ATR/TR, and OHLC prices, makes the tool suitable for a wide range of trading styles—from scalping to swing and position trading.
In summary, this screener enables traders to gain a clear, high-level view of various markets in seconds and make quicker, smarter, and lower-risk decisions. It saves time, streamlines analysis, and boosts overall efficiency and confidence in trading strategies.

Kalman Filtered RSI | [DeV]The Kalman Filtered RSI indicator is an advanced tool designed for traders who want precise, noise-free market insights. By enhancing the classic Relative Strength Index (RSI) with a Kalman filter, this indicator delivers a smoother, more reliable view of market momentum, helping you identify trends, reversals, and overbought/oversold conditions with greater accuracy. It’s an ideal choice for traders seeking clear signals amidst market volatility, giving you a competitive edge across any trading environment.
The RSI measures momentum by analyzing price movements over a set period, typically 14 bars. It calculates the average of price gains on up days and the average of price losses on down days, then compares these to produce a value between 0 and 100. An RSI above 70 often indicates an overbought market that may reverse downward, while below 30 suggests an oversold market that could reverse upward. RSI is great for spotting momentum shifts, potential reversals, and trend strength, but it can be noisy in choppy markets, leading to misleading signals.
That's where the Kalman filter comes in; it enhances the RSI by applying a sophisticated smoothing process that predicts the RSI’s next value based on its historical trend, then updates this prediction with the actual RSI reading. It operates in two phases: prediction and correction. In the prediction phase, it uses the previous filtered RSI and adds uncertainty from process noise (Q), which is derived from the historical variance of RSI changes, reflecting how much the RSI might unexpectedly shift. In the correction phase, it calculates a Kalman gain based on the ratio of prediction uncertainty to measurement noise (R), which is determined from the variance between raw RSI and a smoothed version, indicating the raw data’s noisiness. This gain weights how much the filter trusts the new RSI versus the prediction, blending them to produce a smoothed RSI that reduces noise while staying responsive to real trends, outperforming simpler methods like moving averages that often lag or oversmooth.
With the Kalman Filtered RSI, you get a refined view of momentum, making it easier to spot trends and reversals with clarity. This indicator’s ability to dynamically adapt to market changes delivers timely, reliable signals, making it a powerful addition to your trading strategy for any market or timeframe.

RSI with Trend LinesThe RSI with Trend Lines indicator is a tool designed to analyze the behavior of the Relative Strength Index (RSI) combined with dynamic trend lines. This indicator not only provides the standard RSI reading but also identifies pivot points on the RSI and draws bullish and bearish trend lines based on these points. It also includes customizable options for adjusting trend lines, displaying the RSI moving average, and highlighting key levels such as overbought, oversold, and the center line.
This indicator is ideal for finding and identifying clear trends in the RSI and taking advantage of market breakout or consolidation signals. It also includes a table with the POC value, which represents the price level at which the most trading activity has occurred, indicating the highest liquidity and highest trading volume.
Key Features:
1. Basic RSI:
• Calculates the RSI using a configurable period length (default 14).
• Colors the RSI based on its direction (green for rising, red for falling) and its position relative to the center line (50).
2. Key Levels:
• Displays overbought (70 and 80), oversold (20 and 30), and the center line (50) levels for easy visual interpretation.
3. RSI Moving Average:
• Enables and configures an RSI moving average (SMA, EMA, WMA, or ALMA) to smooth out fluctuations and detect clearer trends.
4. Dynamic Trend Lines:
• Identifies pivot points on the RSI and draws bullish and bearish trend lines.
• Trend lines can be extended into the future or limited to the visible range.
• Includes options to display broken lines (trends that are no longer valid) and customize the style (solid or dashed).
5. Pivot Points:
• Displays the high and low pivot points on the chart for a better understanding of trend changes.
6. Advanced Customization:
• Adjust the pivot point period.
• Control the number of pivot points to consider for trend lines.
• Customize the line thickness and style.
How to Use the Indicator:
1. RSI Interpretation:
• Overbought Zone (RSI > 70): Indicates that the asset may be overvalued and could correct downward.
• Oversold Zone (RSI < 30): Suggests that the asset may be undervalued and could rebound.
• Centerline Crossover (50): A cross above 50 indicates bullish strength, while a cross below suggests weakness.
2. Trend Lines:
• Bullish Lines: Drawn when the RSI forms ascending low pivot points. These lines represent dynamic support.
• Bearish Lines: These are drawn when the RSI forms descending high pivot points. These lines represent dynamic resistance.
• Broken Lines: When a trend line becomes invalid (the RSI breaks the line), they are displayed in a dotted style to highlight the breakout.
3. Possible Trading Signals:
• Buy: When the RSI breaks an upward downtrend line.
• Sell: When the RSI breaks a downward uptrend line.
• Trend Confirmation: When the RSI stays within a valid trend line, it suggests that the current trend is strong.
4. A chart with the POC value:
• The point of control is a price level at which the highest trading volume occurs in a given time period. It is a key component of the Volume Profile indicator, which displays volume by price.
• Use of the POC in trading:
• The POC is used to identify areas of high interest and liquidity for trading.
• The POC provides information about the equilibrium point where buyers and sellers are most evenly matched.
• Therefore, it can be considered a zone of interest, meaning it can act as support or resistance.

RSI Classic calculationClassic RSI with Moving Average
This script implements the Classic RSI (Relative Strength Index) method with the option to use either an Exponential Moving Average (EMA) or a Simple Moving Average (SMA) for smoothing the gains and losses. This custom implementation primarily aims to resolve a specific issue I encountered when cross-referencing RSI values with Python-based data, which is calculated differently than in Pine Script. However, the methodology here can benefit anyone who needs to align RSI calculations across different programming languages or platforms.
The Problem:
When working with Python for data analysis, the RSI values are calculated differently. The smoothing method, for example, can vary—RMA (Relative Moving Average) may be used instead of SMA or EMA, resulting in discrepancies when comparing RSI values across systems. To solve this problem, this script allows for the same type of smoothing to be applied (EMA or SMA) as used in Python, ensuring consistency in the data.
Why This Implementation:
The main goal of this approach was to align RSI calculations across Python and Pine Script so that I could cross-check the results accurately. By offering both EMA and SMA options, this script bridges the gap between Pine Script and Python, ensuring that the data is comparable and consistent. While this particular issue arose from my work with Python, this solution is valuable for anyone dealing with cross-platform RSI comparisons in different coding languages or systems.
Benefits:
Cross-Platform Consistency: This script ensures that RSI values calculated in Pine Script are directly comparable to those from Python (or any other platform), which is crucial for accurate analysis, especially in automated trading systems.
Flexibility: The ability to choose between EMA and SMA provides flexibility in line with the specific needs of your strategy or data source.
Ease of Use: The RSI is plotted with overbought and oversold levels clearly marked, making it easy to visualize and use in decision-making processes.
Limitations:
Calculation Differences: While this script bridges the gap between Pine Script and Python, if you're working with a different platform or coding language that uses variations like RMA, small discrepancies may still arise.
Sensitivity Trade-Off: The choice between EMA and SMA impacts the sensitivity of the RSI. EMA responds quicker to recent price changes, which could lead to faster signals, while SMA provides a more stable but slower response.
Conclusion:
This Classic RSI script, with its customizable moving average type (EMA or SMA), not only solves the issue I faced with Python-based calculations but also provides a solution for anyone needing consistency across different programming languages and platforms. Whether you're working with Pine Script, Python, or other languages, this script ensures that your RSI values are aligned for more accurate cross-platform analysis. However, always be mindful of the small differences that can arise when different smoothing techniques (like RMA) are used in other systems.

RSI with Bollinger Bands and Buy/Sell SignalsPurpose:
This indicator combines the Relative Strength Index (RSI) with Bollinger Bands to identify overbought and oversold conditions in the market. It also generates buy and sell signals based on the interaction between the RSI and the Bollinger Bands. It is particularly useful for traders looking for opportunities in volatile or trending markets.
How It Works:
RSI (Relative Strength Index):
The RSI measures the magnitude of recent price changes to evaluate whether an asset is overbought (values > 70) or oversold (values < 30).
In this indicator, horizontal lines at levels 70 (overbought) and 30 (oversold) are used as reference points.
Bollinger Bands:
Bollinger Bands are calculated around a smoothed moving average of the RSI. The upper band represents dynamic overbought levels, while the lower band indicates dynamic oversold levels.
These bands automatically adjust their width based on the volatility of the RSI, allowing them to adapt to different market conditions.
Buy and Sell Signals:
Buy Signal: A buy signal is generated when the RSI exceeds both the upper Bollinger Band and the overbought level (70). This suggests that the asset is in an extreme bullish phase.
Sell Signal: A sell signal is generated when the RSI falls below both the lower Bollinger Band and the oversold level (30). This suggests that the asset is in an extreme bearish phase.
Alerts:
The indicator includes automatic alerts to notify you when buy or sell signals are generated. This allows traders to act quickly on new opportunities.
Best Practices:
Confirmation in Lower Timeframes:
Although this indicator is powerful, it is recommended to confirm signals in lower timeframes before making trading decisions. For example:
If you receive a buy signal on a 4-hour chart, check if the RSI and Bollinger Bands on lower timeframes (such as 1 hour or 15 minutes) also show bullish signals.
This reduces the risk of false positives and increases the accuracy of your entries.
Use in Trends:
This indicator works best in markets with clear trends. In sideways or low-volatility markets, signals may be less reliable due to the lack of directional momentum.
Risk Management:
Always use stop-loss and take-profit to protect your positions. Buy and sell signals are just one tool for analysis; they do not guarantee results.
Combination with Other Indicators:
To improve accuracy, consider combining this indicator with others, such as MACD, Stochastic Oscillator, or Japanese candlestick patterns. This can provide additional confirmation before opening a position.
Summary:
The RSI + Bollinger Bands with Buy/Sell Signals indicator is an advanced tool designed to identify entry and exit points in the market based on extreme overbought and oversold conditions. However, to maximize its effectiveness, it is crucial to confirm signals in lower timeframes and use it in combination with other technical analysis tools. With proper risk management and careful interpretation of signals, this indicator can be a valuable ally in your trading strategy.

RShar Seasonal RSISeasonal RSI
This indicator, Seasonal RSI, is designed to enhance trading decisions by combining the **Relative Strength Index (RSI)** with insights derived from historical **seasonality patterns**. It not only calculates RSI but also overlays seasonality data for the current week of the year, providing traders with a more contextualized view of market conditions.
---
### **Key Features**
#### 1. **Relative Strength Index (RSI) Calculation**
- The script calculates the RSI for a user-defined period (`RSI Length`), which is an oscillator used to measure the speed and magnitude of price changes.
- RSI values are plotted on the chart, helping traders identify **overbought** and **oversold** conditions.
- Thresholds for **Overbought** and **Oversold** levels are customizable, with default values of 70 and 30, respectively.
---
#### 2. **Dynamic RSI Coloring Based on Seasonality**
- The color of the RSI line dynamically adjusts based on historical **win rates** for the current week of the year:
- **Bright Green** for win rates > 65%.
- **Green** for win rates between 50-65%.
- **Red** for win rates between 35-50%.
- **Dark Red** for win rates < 35%.
- This feature gives traders a quick visual cue about whether the historical performance of the current week tends to be bullish, neutral, or bearish.
---
#### 3. **Overbought and Oversold Level Visualization**
- Overbought and oversold levels are displayed as dotted horizontal lines on the RSI chart.
- These levels act as visual guides for potential price reversals:
- **Overbought (default 70)**: Indicates potential selling pressure.
- **Oversold (default 30)**: Indicates potential buying pressure.
---
#### 4. **Seasonality Data Integration**
- Historical **seasonality data** is used to analyze price performance patterns for each week of the year:
- **Win Rate**: The percentage of years in which prices closed higher during the current week.
- **Average Weekly Change**: The average price percentage change during the current week over historical data.
- This data provides additional context to RSI readings, helping traders align their strategies with seasonal tendencies.
---
#### 5. **Information Table Overlay**
- A table is displayed in the **top-right corner** of the chart, summarizing seasonality data for the current week:
- **Week Win Rate**: Displays the percentage of historical years where prices rose during this week.
- **Avg Weekly Change**: Shows the average percentage price change for the current week. Positive values are displayed in green, and negative values are shown in red.
- This overlay provides actionable insights without cluttering the chart.
---
### **How It Works**
1. **Seasonality Data**:
- A function (`getSeasonalityForWeek`) fetches or uses predefined mock seasonality data for each week of the year.
- For each week, it calculates:
- The **Win Rate** (percentage of years with positive performance).
- The **Mean Change** (average price percentage change).
2. **RSI Plot**:
- The RSI line is plotted on the chart.
- The line's color is determined by the win rate for the current week, providing a visual representation of historical performance trends.
3. **Threshold Visualization**:
- Horizontal lines for overbought and oversold levels are drawn to assist in identifying potential reversal points.
4. **Information Table**:
- The table summarizes the current week's seasonality data for quick reference, helping traders make data-driven decisions.
---
### **Use Cases**
- **Short-Term Traders**:
Use the dynamic RSI colors and seasonality table to align short-term trades with historical patterns of weekly performance.
- **Swing Traders**:
Identify whether a stock or market is in an overbought/oversold condition while considering the seasonal tendency for the week.
- **Contextual Decision-Making**:
Combine traditional RSI signals with historical data to reduce false signals and improve timing.
---
### **Limitations**
- The script uses **mock seasonality data** in its default state. To make it fully functional, replace the mock data with actual historical performance metrics for your specific ticker or market.
- The indicator does not fetch real-time external data due to Pine Script’s limitations, so all seasonality data must be manually updated or hardcoded.
---
This indicator provides a powerful way to combine technical analysis with historical trends, offering a unique edge to traders by adding seasonal context to RSI signals.

GocchiMulti-Indicator: RSI & Moving Averages
This versatile TradingView indicator combines two essential tools for technical analysis—Relative Strength Index (RSI) and Moving Averages (MAs)—into one comprehensive solution. It is designed for traders seeking flexibility, customization, and efficiency in their charting experience.
Features:
Relative Strength Index (RSI):
Customizable RSI length.
Adjustable overbought and oversold levels.
Selectable source input (e.g., close, open, high, low).
Visual levels for overbought and oversold zones, aiding in quick trend and momentum identification.
Three Moving Averages:
Three independently customizable moving averages.
Options for Simple Moving Average (SMA) or Exponential Moving Average (EMA) for each line.
Adjustable lengths for short-, medium-, and long-term trend tracking.
Visual Enhancements:
Clear, color-coded plots for RSI and each moving average.
Overbought and oversold zones are highlighted with horizontal dotted lines.
Alerts:
Get notified when RSI crosses above the overbought level or below the oversold level.
Alerts help traders stay on top of potential market reversals or breakout opportunities.
Use Cases:
RSI Analysis: Spot overbought or oversold conditions to identify potential reversals.
Trend Following: Use moving averages to confirm trends or identify crossovers for potential entry and exit points.
Custom Strategies: Tailor the settings to fit specific trading styles, such as scalping, swing trading, or long-term investing.
This all-in-one indicator streamlines your analysis by reducing the need for multiple overlays, making your charts cleaner and more actionable. Whether you're a novice or an experienced trader, this tool provides the flexibility and insights you need to succeed in any market condition.

RSI and Bollinger Bands Screener [deepakks444]Indicator Overview
The indicator is designed to help traders identify potential long signals by combining the Relative Strength Index (RSI) and Bollinger Bands across multiple timeframes. This combination allows traders to leverage the strengths of both indicators to make more informed trading decisions.
Understanding RSI
What is RSI?
The Relative Strength Index (RSI) is a momentum oscillator that measures the speed and change of price movements. Developed by J. Welles Wilder Jr. for stocks and forex trading, the RSI is primarily used to identify overbought or oversold conditions in an asset.
How RSI Works:
Calculation: The RSI is calculated using the average gains and losses over a specified period, typically 14 periods.
Range: The RSI oscillates between 0 and 100.
Interpretation:
Key Features of RSI:
Momentum Indicator: RSI helps identify the momentum of price movements.
Divergences: RSI can show divergences, where the price makes a higher high, but the RSI makes a lower high, indicating potential reversals.
Trend Identification: RSI can also help identify trends. In an uptrend, the RSI tends to stay above 50, and in a downtrend, it tends to stay below 50.
Understanding Bollinger Bands
What is Bollinger Bands?
Bollinger Bands are a type of trading band or envelope plotted two standard deviations (positively and negatively) away from a simple moving average (SMA) of a price. Developed by financial analyst John Bollinger, Bollinger Bands consist of three lines:
Upper Band: SMA + (Standard Deviation × Multiplier)
Middle Band (Basis): SMA
Lower Band: SMA - (Standard Deviation × Multiplier)
How Bollinger Bands Work:
Volatility Measure: Bollinger Bands measure the volatility of the market. When the bands are wide, it indicates high volatility, and when the bands are narrow, it indicates low volatility.
Price Movement: The price tends to revert to the mean (middle band) after touching the upper or lower bands.
Support and Resistance: The upper and lower bands can act as dynamic support and resistance levels.
Key Features of Bollinger Bands:
Volatility Indicator: Bollinger Bands help traders understand the volatility of the market.
Mean Reversion: Prices tend to revert to the mean (middle band) after touching the bands.
Squeeze: A Bollinger Band Squeeze occurs when the bands narrow significantly, indicating low volatility and a potential breakout.
Combining RSI and Bollinger Bands
Strategy Overview:
The strategy aims to identify potential long signals by combining RSI and Bollinger Bands across multiple timeframes. The key conditions are:
RSI Crossing Above 60: The RSI should cross above 60 on the 15-minute timeframe.
RSI Above 60 on Higher Timeframes: The RSI should already be above 60 on the hourly and daily timeframes.
Price Above 20MA or Walking on Upper Bollinger Band: The price should be above the 20-period moving average of the Bollinger Bands or walking on the upper Bollinger Band.
Strategy Details:
RSI Calculation:
Calculate the RSI for the 15-minute, 1-hour, and 1-day timeframes.
Check if the RSI crosses above 60 on the 15-minute timeframe.
Ensure the RSI is above 60 on the 1-hour and 1-day timeframes.
Bollinger Bands Calculation:
Calculate the Bollinger Bands using a 20-period moving average and 2 standard deviations.
Check if the price is above the 20-period moving average or walking on the upper Bollinger Band.
Entry and Exit Signals:
Long Signal: When all the above conditions are met, consider a long entry.
Exit: Exit the trade when the price crosses below the 20-period moving average or the stop-loss is hit.
Example Usage
Setup:
Add the indicator to your TradingView chart.
Configure the inputs as per your requirements.
Monitoring:
Look for the long signal on the chart.
Ensure that the RSI is above 60 on the 15-minute, 1-hour, and 1-day timeframes.
Check that the price is above the 20-period moving average or walking on the upper Bollinger Band.
Trading:
Enter a long position when the criteria are met.
Set a stop-loss below the low of the recent 15-minute candle or based on your risk management rules.
Monitor the trade and exit when the RSI returns below 60 on any of the timeframes or when the price crosses below the 20-period moving average.
House Rules Compliance
No Financial Advice: This strategy is for educational purposes only and should not be construed as financial advice.
Risk Management: Always use proper risk management techniques, including stop-loss orders and position sizing.
Past Performance: Past performance is not indicative of future results. Always conduct your own research and analysis.
TradingView Guidelines: Ensure that any shared scripts or strategies comply with TradingView's terms of service and community guidelines.
Conclusion
This strategy combines RSI and Bollinger Bands across multiple timeframes to identify potential long signals. By ensuring that the RSI is above 60 on higher timeframes and that the price is above the 20-period moving average or walking on the upper Bollinger Band, traders can make more informed decisions. Always remember to conduct thorough research and use proper risk management techniques.

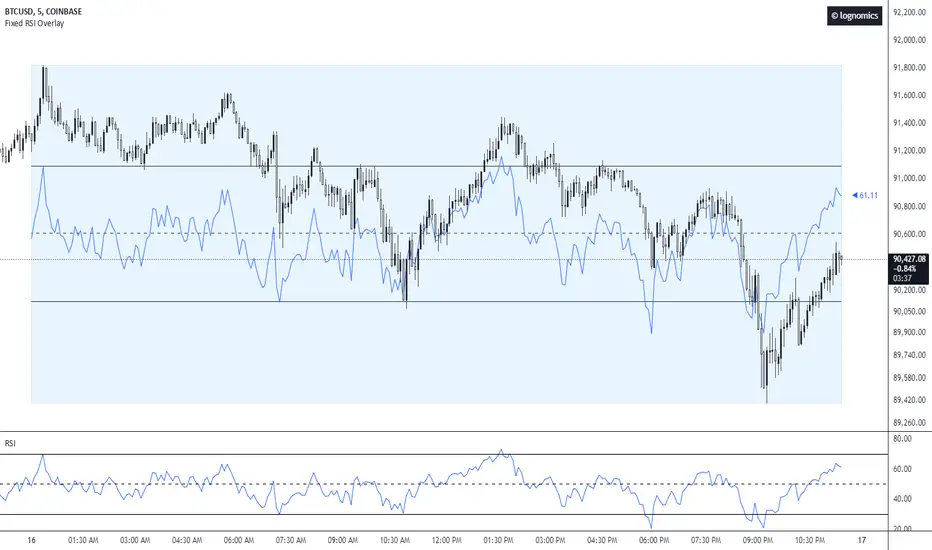
Fixed RSI Overlay [lognomics]This overlay indicator provides a dynamic visualization of the RSI on the instrument price chart. It enhances the standard RSI oscillator by scaling it relative to the anchor's maximum & minimum range, conceptualizing how price reacts at standard oscillation levels.
Starting at the anchor's open, the tool collects all the RSI values from each candle within the range, and stores them inside an array corresponding to each candle index. It then pulls relative values and plots a line connecting each point accordingly to the 0-100 range scale.
While determining each maximum and/or minimum the script will plot a box from the opening time of the anchor, encapsulating the high & low of the range, to end at the next anchor time. To the right to of the box, a label is plotted which is pushed to the current time & current RSI y value within the fixed scale.
RSI Standard Deviation | viResearchRSI Standard Deviation | viResearch
The "RSI Standard Deviation" indicator, developed by viResearch, introduces a new approach to combining the Relative Strength Index (RSI) with a standard deviation measure to offer a more dynamic view of market momentum. By applying standard deviation to the RSI values, this indicator refines the traditional RSI, providing a more precise and adaptive way to measure overbought and oversold conditions. This unique combination allows traders to better understand the underlying volatility in RSI movements, leading to more informed decisions in trending and ranging markets.
Technical Composition and Calculation:
The core of the "RSI Standard Deviation" lies in calculating the RSI based on user-defined input parameters and then applying standard deviation to these RSI values. This method enhances the sensitivity of the RSI, making it more responsive to market volatility.
RSI Calculation:
RSI Length (len): The script computes the Relative Strength Index over a customizable length (default: 21), offering a traditional measure of momentum in the market. The RSI tracks the speed and change of price movements, oscillating between 0 and 100 to indicate overbought and oversold conditions.
Standard Deviation Applied to RSI:
Standard Deviation Length (sdlen): The script calculates the standard deviation of the RSI values over a user-defined period (default: 35). This standard deviation represents the volatility in RSI movements, adding a new layer of analysis to traditional RSI.
Upper (u) and Lower (d) Bands:
The standard deviation values are used to create upper and lower bands around the RSI, offering an adaptive range that expands or contracts based on market volatility. This helps traders identify moments when the market is more likely to reverse or continue its trend.
Trend Identification:
Uptrend (L): The script identifies an uptrend when the RSI moves above the lower band and stays above the midline (50). This indicates that the market is gaining upward momentum, potentially signaling a long position.
Downtrend (S): A downtrend is identified when the RSI moves below 50, suggesting a weakening market and a potential short position.
Features and User Inputs:
The "RSI Standard Deviation" script offers various customization options, enabling traders to tailor it to their specific needs and strategies:
RSI Length: Traders can adjust the length of the RSI calculation to control how quickly the indicator responds to price movements.
Standard Deviation Length: Adjusting the standard deviation length allows users to control the sensitivity of the upper and lower bands, fine-tuning the indicator’s responsiveness to market volatility.
Source Input: The script can be applied to different price sources, offering flexibility in how it calculates RSI and standard deviation values.
Practical Applications:
The "RSI Standard Deviation" indicator is particularly useful in volatile markets, where traditional RSI may produce false signals due to rapid price movements. By adding a standard deviation measure, traders can filter out noise and better identify trends.
Key Uses:
Trend Following: The standard deviation bands provide a clearer view of momentum shifts in the RSI, allowing traders to follow the trend more confidently.
Volatility Assessment: The indicator dynamically adjusts to market volatility, making it easier to assess when the market is overbought or oversold and when a trend reversal is likely.
Signal Confirmation: By comparing the RSI to the adaptive standard deviation bands, traders can confirm signals and avoid false entries during periods of high volatility.
Advantages and Strategic Value:
The "RSI Standard Deviation" offers several advantages:
Enhanced Precision: The combination of RSI and standard deviation results in a more refined momentum indicator that adapts to market conditions.
Noise Reduction: The standard deviation bands help filter out short-term market noise, making it easier to identify significant trend changes.
Dynamic Volatility Awareness: By using standard deviation, the indicator adjusts its bands based on real-time volatility, providing more accurate overbought and oversold signals.
Summary and Usage Tips:
The "RSI Standard Deviation" is a powerful tool for traders looking to enhance their RSI analysis with volatility measures. For optimal performance, traders should experiment with different RSI and standard deviation lengths to suit their trading timeframe and strategy. Whether used to follow trends or confirm momentum signals, the "RSI Standard Deviation" provides a reliable and adaptive solution for modern trading environments.

RSI Trail [UAlgo]The RSI Trail indicator is a technical analysis tool designed to assist traders in making informed decisions by utilizing the Relative Strength Index (RSI) and various moving average calculations. This indicator dynamically plots support and resistance levels based on RSI values, providing visual cues for potential bullish and bearish signals. The inclusion of a trailing stop mechanism allows traders to adapt to market volatility, ensuring optimal entry and exit points.
🔶 Key Features
Multiple Moving Average Types: Choose from Simple Moving Average (SMA), Exponential Moving Average (EMA), Weighted Moving Average (WMA), Running Moving Average (RMA), and McGinley Dynamic for diverse analytical approaches.
Configurable RSI Bounds: Tailor the RSI lower and upper bounds to your specific trading preferences, with default settings at 40 and 60.
Signals: The indicator determines bullish and bearish market states and plots corresponding signals on the chart.
Customizable Visualization: Options to display the midline and color candles based on market state enhance visual analysis.
Alerts: Integrated alert conditions notify you of bullish and bearish signals.
🔶 Calculations
The RSI Trail indicator calculates dynamic support and resistance levels using a combination of moving averages and the Relative Strength Index (RSI). It starts by computing a chosen moving average (SMA, EMA, WMA, RMA, or McGinley) over a period of 27 using the typical price (ohlc4).
The indicator then defines upper and lower bounds based on customizable RSI levels (default 40 and 60) and adjusts these bounds using the Average True Range (ATR) to account for market volatility. The upper bound is calculated by adding a volatility-adjusted value to the moving average, while the lower bound is found by subtracting this value. Bullish signals occur when the price crosses above the upper bound, and bearish signals when it falls below the lower bound.
The RSI Trail indicator also can be used to identify pullback opportunities. When the price high/low crosses above/below the calculated upper/lower bound, it indicates a potential pullback, suggesting a favorable point to enter a trade during a pullback.
🔶 Disclaimer
This indicator is for informational purposes only and should not be considered financial advice.
Always conduct your own research and due diligence before making any trading decisions. Past performance is not necessarily indicative of future results.

Dual RSI Differential - Strategy [presentTrading]█ Introduction and How it is Different
The Dual RSI Differential Strategy introduces a nuanced approach to market analysis and trading decisions by utilizing two Relative Strength Index (RSI) indicators calculated over different time periods. Unlike traditional strategies that employ a single RSI and may signal premature or delayed entries, this method leverages the differential between a shorter and a longer RSI. This approach pinpoints more precise entry and exit points, providing a refined tool for traders to exploit market conditions effectively, particularly in overbought and oversold scenarios.
Most important: it is a good eductional code for swing trading.
For beginners, this Pine Script provides a complete function that includes crucial elements such as holding days and the option to configure take profit/stop loss settings:
- Hold Days: This feature ensures that trades are not exited too hastily, helping traders to ride out short-term market volatility. It's particularly valuable for swing trading where maintaining positions slightly longer can lead to capturing significant trends.
- TPSL Condition (None by default): This setting allows traders to focus solely on the strategy's robust entry and exit signals without being constrained by preset profit or loss limits. This flexibility is crucial for learning to adjust strategy settings based on personal risk tolerance and market observations.
BTCUSD 6h LS Performance
█ Strategy, How It Works: Detailed Explanation
🔶 RSI Calculation:
The RSI is a momentum oscillator that measures the speed and change of price movements. It is calculated using the formula:
RSI = 100 - (100 / (1 + RS))
Where RS (Relative Strength) = Average Gain of up periods / Average Loss of down periods.
🔶 Dual RSI Setup:
This strategy involves two RSI indicators:
RSI_Short (RSI_21): Calculated over a short period (21 days).
RSI_Long (RSI_42): Calculated over a longer period (42 days).
Differential Calculation:
The strategy focuses on the differential between these two RSIs:
RSI Differential = RSI_Long - RSI_Short
This differential helps to identify when the shorter-term sentiment diverges from longer-term trends, signaling potential trading opportunities.
BTCUSD Local picuture
🔶 Signal Triggers:
Entry Signal: A buy (long) signal is triggered when the RSI Differential exceeds -5, suggesting strengthening short-term momentum. Conversely, a sell (short) signal occurs when the RSI Differential falls below +5, indicating weakening short-term momentum.
Exit Signal: Trades are generally exited when the RSI Differential reverses past these thresholds, indicating a potential momentum shift.
█ Trade Direction
This strategy accommodates various trading preferences by allowing selections among long, short, or both directions, thus enabling traders to capitalize on diverse market movements and volatility.
█ Usage
The Dual RSI Differential Strategy is particularly suited for:
Traders who prefer a systematic approach to capture market trends.
Those who seek to minimize risks associated with rapid and unexpected market movements.
Traders who value strategies that can be finely tuned to different market conditions.
█ Default Settings
- Trading Direction: Both — allows capturing of upward and downward market movements.
- Short RSI Period: 21 days — balances sensitivity to market movements.
- Long RSI Period: 42 days — smoothens out longer-term fluctuations to provide a clearer market trend.
- RSI Difference Level: 5 — minimizes false signals by setting a moderate threshold for action.
Use Hold Days: True — introduces a temporal element to trading strategy, holding positions to potentially enhance outcomes.
- Hold Days: 5 — ensures that trades are not exited too hastily, helping to ride out short-term volatility.
- TPSL Condition: None — enables traders to focus solely on the strategy's entry and exit signals without preset profit or loss limits.
- Take Profit Percentage: 15% — aims for significant market moves to lock in profits.
- Stop Loss Percentage: 10% — safeguards against large losses, essential for long-term capital preservation.

RSI Confirm Trend with Williams (W%R)RSI Confirm Trend with Williams (W%R)
This is the "RSI Confirm Trend with Williams (W%R)" indicator
This is a modification of the "RSI Trends" indicator by zzzcrypto123.
What Is the Relative Strength Index (RSI)?
The relative strength index (RSI) is a momentum indicator used in technical analysis. RSI measures the speed and magnitude of a security's recent price changes to evaluate overvalued or undervalued conditions in the price of that security.
What is Williams %R?
Williams %R, also known as the Williams Percent Range, is a type of momentum indicator that moves between 0 and -100 and measures overbought and oversold levels. The Williams %R may be used to find entry and exit points in the market. The indicator is very similar to the Stochastic oscillator and is used in the same way. It was developed by Larry Williams and it compares a stock’s closing price to the high-low range over a specific period, typically 14 days or periods.
How Does "RSI Confirm Trend with Williams (W%R)" work?
This indicator combines the momentum of both RSI and Williams %R by adding upper and lower thresholds. When the thresholds are broken, this indicator changes color from gray to either green or red.
What Are The Thresholds?
The default RSI thresholds are 55 and 45. These values are configurable.
The default Williams %R thresholds are 80 and 20. These values are configurable and made positive so it can be plotted against the RSI line.
How To Use?
When the RSI exceeded the upper/lower thresholds, the RSI line color will change from gray to lighter green/red color.
When the Williams %R exceeded the upper/lower thresholds, the RSI color will change to darker green/red color signifying a strong momentum in that direction.
When the RSI color is gray, this means the RSI and Williams %R thresholds are not broken which can also signify as no trend or consolidation.
The Williams %R line is not displayed by default but can be enabled using the checkbox provided in the Style tab.
This "RSI Confirm Trend with Williams (W%R)" indicator can be combined with other technical indicators to verify the idea behind this theory.
-----------------
Disclaimer
The information contained in this indicator does not constitute any financial advice or a solicitation to buy or sell any securities of any type.
My scripts/indicators/ideas are for educational purposes only!

Best scalping toolExplanation:
This script is a comprehensive indicator that combines three essential technical analysis tools: Money Flow Index (MFI), Relative Strength Index (RSI), and Bollinger Bands (Bollinger %B). It provides insights into market conditions related to cross points of mfi,rsi and B%B.
A buy condition is created when the last candle RSI and MFI are under the bollinger bands, and then in the actual candle the RSI cross up the bollinger low band.
A sell condition is created when the last candle RSI and MFI are above the bollinger bands, and then in the actual candle the RSI cross down the bollinger high band.
Key Components:
MFI (Money Flow Index):
Utilizes the MFI indicator based on a specified length.
Overbought and oversold levels (80 and 20, respectively).
RSI (Relative Strength Index): (Adapted to the mfi chart)
Allows selection of different moving average types (SMA, EMA, etc.) for the RSI calculation.
RSI along with upper and lower bands (70 and 30).
Bollinger Bands:
Provides upper and lower Bollinger Bands based on the RSI's standard deviation.
Visualization Options:
Allows the user to choose between show the buy (green arrow) and the sell (red arrow) .
How It Works:
The indicator amalgamates these three powerful technical indicators to help traders identify potential entry or exit points. The green arrow its a buy signal and the red arrow is a sell signal.
By offering configurable settings and clear visual cues, this indicator assists traders in recognizing critical market conditions and potential trading opportunities.
Disclaimer: This indicator should be used as a tool in a broader trading strategy and not solely for making trading decisions. It's recommended to combine it with other technical or fundamental analysis for comprehensive trading decisions.

EUR/USD 45 MIN Strategy - FinexBOTThis strategy uses three indicators:
RSI (Relative Strength Index) - It indicates if a stock is potentially overbought or oversold.
CCI (Commodity Channel Index) - It measures the current price level relative to an average price level over a certain period of time.
Williams %R - It is a momentum indicator that shows whether a stock is at the high or low end of its trading range.
Long (Buy) Trades Open:
When all three indicators suggest that the stock is oversold (RSI is below 25, CCI is below -130, and Williams %R is below -85), the strategy will open a buy position, assuming there is no current open trade.
Short (Sell) Trades Open:
When all three indicators suggest the stock is overbought (RSI is above 75, CCI is above 130, and Williams %R is above -15), the strategy will open a sell position, assuming there is no current open trade.
SL (Stop Loss) and TP (Take Profit):
SL (Stop Loss) is 0.45%.
TP (Take Profit) is 1.2%.
The strategy automatically sets these exit points as a percentage of the entry price for both long and short positions to manage risks and secure profits. You can easily adopt these inputs according to your strategy. However, default settings are recommended.

RSI Divergence SmoothedRSI Divergence Smoothed
This indicator is based on the RSI Divergence indicator by @InvestitoreComune.
The "RSI Divergence Smoothed" is a custom technical indicator designed to highlight divergence between two RSI (Relative Strength Index) lines: a fast RSI and a slow RSI. The divergence is then visualized on the chart, assisting traders in recognizing potential market reversals and trend continuation.
Here's a breakdown of its smoothing options added:
1. **WMA Difference**: The indicator first computes a weighted moving average (WMA) difference, which takes the difference between the WMA of half the input length and the WMA of the full length.
2. **Hull Moving Average (HMA)**: The indicator can use the HMA as a filter. HMA combines the benefits of a simple moving average and a linear weighted moving average, aiming to be faster in response to price changes.
3. **Sine Weighted Moving Average (SWMA)**: Another filter option, SWMA, weighs the data points by the sine of their position in the data set, giving more weight to the central data points.
4. **Kaufman's Adaptive Moving Average (KAMA)**: KAMA adapts to price volatility and can also be used as a filter. It's especially useful in choppy markets, adjusting the smoothing constant based on the relative volatility of the price series.
5. **Gaussian Moving Average (GMA)**: This filter uses a Gaussian kernel to weigh the data points, emphasizing the more recent data while giving lesser importance to older data. It helps smooth out the price data, potentially eliminating some of the noise.
I've personally found the KAMA smoothing to be most helpful but keen to hear of anyone's personal experiences and recommendations.
RSI divergence computations are based on the filtered price (or raw price if no filter is chosen) - the indicator calculates two RSIs:
- Fast RSI: With a default length of 5 periods.
- Slow RSI: With a default length of 14 periods.
The core functionality of this indicator is to compute the divergence between the Fast and Slow RSI. The divergence is plotted on the chart, with the color indicating its direction: white for positive divergence and red for negative.