DataDoodles ATR RangeThe "DataDoodles ATR Range" indicator provides a comprehensive visual representation of the Average True Range (ATR) levels based on the previous bar's close price . It includes both the raw ATR and an Exponential Moving Average (EMA) of the ATR to offer a smoother view of the range volatility. This indicator is ideal for traders who want to quickly assess potential price movements relative to recent volatility.
Key Features:
ATR Levels Above and Below Close: The indicator calculates and displays three levels of ATR-based ranges above and below the previous close price. These levels are visualized on the chart using distinct colors:
- 1ATR Above/Below
- 2ATR Above/Below
- 3ATR Above/Below
EMA of ATR
Includes the EMA of ATR to provide a smoother trend of the ATR values, helping traders identify long-term volatility trends.
Color-Coded Ranges: The plotted ranges are color-coded for easy identification, with warm gradient tones applied to the corresponding data table for quick reference.
Customizable Table: A data table is displayed at the bottom right corner of the chart, providing real-time values for ATR, EMA ATR, and the various ATR ranges.
Usage
This indicator is useful for traders who rely on volatility analysis to set stop losses, take profit levels, or simply understand the current market conditions. By visualizing ATR ranges directly on the chart, traders can better anticipate potential price movements and adjust their strategies accordingly.
Customization
ATR Length: The default ATR length is set to 14 but can be customized to fit your trading strategy.
Table Positioning: The data table is placed in the bottom right corner by default but can be moved as needed.
How to Use
Add the "DataDoodles ATR Range" indicator to your chart.
Observe the plotted lines for potential support and resistance levels based on recent volatility.
Use the data table for quick reference to ATR values and range levels.
Disclaimer: This indicator is a tool for analysis and should be used in conjunction with other indicators and analysis methods. Always practice proper risk management and consider market conditions before making trading decisions.
Search in scripts for "Table"

Qty CalculatorThis Pine Script indicator, titled "Qty Calculator," is a customizable tool designed to assist traders in managing their trades by calculating key metrics related to risk management. It takes into account your total capital, entry price, stop-loss level, and desired risk percentage to provide a comprehensive overview of potential trade outcomes.
Key Features:
User Inputs:
Total Capital: The total amount of money available for trading.
Entry Price: The price at which the trader enters the trade.
Stop Loss: The price level at which the trade will automatically close to prevent further losses.
Risk Percentage: The percentage of the total capital that the trader is willing to risk on a single trade.
Customizable Table:
Position: The indicator allows you to choose the position of the table on the chart, with options including top-left, top-center, top-right, bottom-left, bottom-center, and bottom-right.
Size: You can adjust the number of rows and columns in the table to fit your needs.
Risk Management Calculations:
Difference Calculation: The difference between the entry price and the stop-loss level.
Risk Per Trade: Calculated as a percentage of your total capital.
Risk Levels: The indicator evaluates multiple risk levels (0.10%, 0.25%, 0.50%, 1.00%) and calculates the quantity, capital per trade, percentage of total capital, and the risk amount associated with each level.
R-Multiples Calculation:
The indicator calculates potential profit levels at 2x, 3x, 4x, and 5x the risk (R-Multiples), showing the potential gains if the trade moves in your favor by these multiples.
Table Display:
The table includes the following columns:
CapRisk%: Displays the risk percentage.
Qty: The quantity of the asset you should trade.
Cap/Trade: The capital allocated per trade.
%OfCapital: The percentage of total capital used in the trade.
Risk Amount: The monetary risk taken on each trade.
R Gains: Displays potential gains at different R-Multiples.
This indicator is particularly useful for traders who prioritize risk management and want to ensure that their trades are aligned with their capital and risk tolerance. By providing a clear and customizable table of critical metrics, it helps traders make informed decisions and better manage their trading strategies.

Multi-Frame Market Sentiment DashboardOverview
This Pine Script™ code generates a "Market Sentiment Dashboard" on TradingView, providing a visual summary of market sentiment across multiple timeframes. This tool aids traders in making informed decisions by displaying real-time sentiment analysis based on Exponential Moving Averages (EMA).
Key Features
Panel Positioning:
Custom Placement: Traders can position the dashboard at the top, middle, or bottom of the chart and align it to the left, center, or right, ensuring optimal integration with other chart elements.
Customizable Colors:
Sentiment Colors: Users can define colors for bullish, bearish, and neutral market conditions, enhancing the dashboard's readability.
Text Color: Customizable text color ensures clarity against various background colors.
Label Size:
Scalable Labels: Adjustable label sizes (from very small to very large) ensure readability across different screen sizes and resolutions.
Market Sentiment Calculation:
EMA-Based Sentiment: The dashboard calculates sentiment using a 9-period EMA. If the EMA is higher than two bars ago, the sentiment is bullish; if lower, it's bearish; otherwise, it's neutral.
Multiple Timeframes: Sentiment is calculated for several timeframes: 1 minute, 3 minutes, 5 minutes, 15 minutes, 30 minutes, 1 hour, 4 hours, and 1 day. This broad analysis provides a comprehensive view of market conditions.
Dynamic Table:
Structured Display: The dashboard uses a table to organize and display sentiment data clearly.
Real-Time Updates: The table updates in real-time, providing traders with up-to-date market information.
How It Works
EMA Calculation: The script requests EMA(9) values for each specified timeframe and compares the current EMA with the EMA from two bars ago to determine market sentiment.
Color Coding: Depending on the sentiment (Bullish, Bearish, or Neutral), the corresponding cell in the table is color-coded using predefined colors.
Table Display: The table displays the timeframe and corresponding sentiment, allowing traders to quickly assess market trends.
Benefits to Traders
Quick Assessment: Traders can quickly evaluate market sentiment across multiple timeframes without switching charts or manually calculating indicators.
Enhanced Visualization: The color-coded sentiment display makes it easy to identify trends at a glance.
Multi-Timeframe Analysis: Provides a broad view of short-term and long-term market trends, helping traders confirm trends and avoid false signals.
This dashboard enhances the overall trading experience by providing a comprehensive, customizable, and easy-to-read summary of market sentiment.
Usage Instructions
Add the Script to Your Chart: Apply the "Market Sentiment Dashboard" indicator to your TradingView chart.
Customize Settings: Adjust the panel position, colors, and label sizes to fit your preferences.
Interpret Sentiment: Use the color-coded table to quickly understand the market sentiment across different timeframes and make informed trading decisions.

Nadaraya-Watson Probability [Yosiet]The script calculates and displays probability bands around price movements, offering insights into potential market trends.
Setting Up the Script
Window Size: Determines the length of the window for the Nadaraya-Watson estimation. A larger window smooths the data more but might lag current market conditions.
Bandwidth: Controls the bandwidth for the kernel regression, affecting the smoothness of the probability bands.
Reading the Data Table
The script dynamically updates a table positioned at the bottom right of your chart, providing real-time insights into market probabilities. Here's how to interpret the table:
Table Columns: The table is organized into three columns:
Up: Indicates the probability or relative change percentage for the upper band.
Down: Indicates the probability or relative change percentage for the lower band.
Table Rows: There are two main rows of interest:
P%: Shows the price change percentage difference between the bands and the closing price. A positive value in the "Up" column suggests the upper band is above the current close, indicating potential upward momentum. Conversely, a negative value in the "Down" column suggests downward momentum.
R%: Displays the relative inner change percentage difference between the bands, offering a measure of the market's volatility or stability within the bands.
Utilizing the Insights
Market Trends: A widening gap between the "Up" and "Down" percentages in the "P%" row might indicate increasing market volatility. Traders can use this information to adjust their risk management strategies accordingly.
Entry and Exit Points: The "R%" row provides insights into the relative position of the current price within the probability bands. Traders might consider positions closer to the lower band as potential entry points and positions near the upper band as exit points or take-profit levels.
Conclusion
The Nadaraya-Watson Probability script offers a sophisticated tool for traders looking to incorporate statistical analysis into their trading strategy. By understanding and utilizing the data presented in the script's table, traders can gain insights into market trends and volatility, aiding in decision-making processes. Remember, no indicator is foolproof; always consider multiple data sources and analyses when making trading decisions.

Smart Money Concept + Strategy Backtesting Toolkit [Shah]This indicator, primarily designed for strategy backtest. It’s important to emphasize that the orders generated by this indicator are in the form of stop-limit orders .
For Long setup , When lower lows and lower highs form, after price moving up from the last higher high, a “change of character” occurs. Entry will takes place in the golden zone.
This the Long setup:
And this is the Long setup Example on chart:
For Short setup , When higher lows and higher highs form after the price moves down from the last higher low, a “change of character” occurs. Entry will take place within the golden zone.
This the Short setup:
And this is the Short setup Example on chart:
Key Features:
Date Period:
Users can customize the date period during which the strategy is tested, allowing for a more granular analysis of performance over specific timeframes.
DCA Entry:
Entry is based on Fibonacci level between the Lower Low and Higher High pivots for Long deals .
Entry is based on Fibonacci level between the Higher High and Lower Low pivots for Short deals .
Allowing a second entry with a specified position size
Entering at a different price based on a Percent or ATR change.
There is a feature that If the risk-to-reward ratio is below the specified input (rr), the trading deal wont initiate, and the signal alert wont be triggered.
Stop Loss:
Adjustable based on Fibonacci levels , Percent and ATR.
The percent and ATR is calculate from LL pivot point for Long and HH pivot point for short (not Entry price)’
Targets:
Adjustable based on Source, Fibonacci levels , Percent and ATR.
Source indicates the maximum (minimum) value between the open and close of the candle where the Higher High (Lower Low) pivot point was formed for Long (Short) deals.
Percent and ATR calculates from Entry 1 Price
There is a feature that closes the part of the position size at Target 1 based on a percentage, leaving the rest to close at Target 2, entry, exit price, or stop loss.
Plots:
The visual representation of the indicator includes the key plots:
Reset Deal Calculation Fibonacci Level
Alert Fire Fibonacci Level
Entry 1
Entry 2
Entry Average
Stop Loss
Target 1
Target 2
Labels:
Displays informative labels upon trade open and close, providing details about each transaction like gain and equity and etc.
Risk Management:
Allows setting initial capital, risk per trade, and commission for each transaction.
Score Table:
Provides statistical information for Regular deals (refers to deals that closed in Target price or Stop loss price) and Exited deals (representing deals that didn’t touch the stop loss or targets.):
Number of trades
Win rate
Profit factor
Average Risk to Reward ratio
Total Profit and Loss (PnL)
Commission paid
Live equity
It should note that Winrate calculated based on closed deals at target or stop loss. (Exited trades doesn’t into account in calculation of Winrate)
Exit Methods :
The goal is to offer users a diverse set of exits before the price touches the target or stop loss.
1. Pending Entry Time-out
cancel pending entry based on candle counting since alert fired. (before deal started)
2. Break Even
If Target 2 is reached, the stop loss automatically adjusts to the entry price.
3. Active Deal Reverse
If a deal (long or short position) is currently open, and the reverse signal is emitted, the script will close the existing deal.
4. Reverse Deal Exit
If a deal (long or short position) is currently open, and the reverse signal is emitted, the script will automatically close the existing deal.
5. Move Exit
With this method, if Entry 2 is triggered, the deal will be closed when the price touches the Entry price.
6. Candle Counting Exit
This exit type is based on the number of candles since the deal started.
7. Profit Zone Shield Exit
Once a deal enters profit, the Exit level moves to the entry level after reaching a Fibonacci level between TP1 and Entry 1.
Deep Backtesting Table:
It includes:
Time period of the backtest
Pair name and timeframe
Count the long and short trades
Win streak and loss streak
Total deal chances and missed chances
Count the deals goes directly from entry 1 to tp1 and entry 2 to tp1
Count the deals that touched entry 2 and entry 2 filled percent
Count the number of each exit type
Other statistics such as CAGR, Sharpe, Kurtosis, Skewness, and Max Drawdown.

Stock WatchOverview
Watch list are very common in trading, but most of them simply provide the means of tracking a list of symbols and their current price. Then, you click through the list and perform some additional analysis individually from a chart setup. What this indicator is designed to do is provide a watch list that employs a high/low price range analysis in a table view across multiple time ranges for a much faster analysis of the symbols you are watching.
Discussion
The concept of this Stock Watch indicator is best understood when you think in terms of a 52 Week Range indication on many financial web sites. Taken a given symbol, what is the high and the low over a 52 week range and then determine where current price is within that range from a percentage perspective between 0% and 100%.
With this concept in mind, let's see how this Stock Watch indicator is meant to benefit.
There are four different H/L ranges relative to the chart's setting and a Scope property. Let's use a three month (3M) chart as our example and set the indicator's Scope = 4. A 3M chart provides three months of data in a single candle, now when we set the Scope = 4 we are stating that 1X is going to look over four candles for the high/low range.
The Scope property is used to determine how many candles it is to scan to determine the high/low range for the corresponding 1X, 3X, 5X and 10X periods. This is how different time ranges are put into perspective. Using a 3M chart with Scope = 4 would represent the following time windows:
- 1X = 3M * 4 is a 12 Months or 1 Year High/Low Range
- 3X = 3M * 4 * 3 is a 36 Months or 3 Years High/Low Range
- 5X = 3M * 4 * 5 is a 60 Months or 5 Years High/Low Range
- 10X = 3M * 4 * 10 is a 120 Months or 10 Years High/Low Range.
With these calculations, the indicator then determines where current price is within each of these High/Low ranges from a percentage perspective between 0% and 100%.
Once the 0% to 100% value is calculated, it then will shade the value according to a color gradient from red to green (or any other two colors you set the indictor to). This color shading really helps to interpret current price quickly.
The greater power to this range and color shading comes when you are able to see where price is according to price history across the multiple time windows. In this example, there is quick analysis across 1 Year, 3 Year, 5 Year and 10 Year windows.
Now let's further improve this quick analysis over 15 different stocks for which the indicator allows you to watch up to at any one time.
For value traders this is huge, because we're always looking for the bargains and we wait for price to be in the value range. Using this indicator helps to instantly see if price has entered a value range before we decide to do further analysis with other charting and fundamental tools.
The Code
The heart of all this is really very simple as you can see in the following code snippet. We're simply looking for the highest high and lowest low across the different scopes and calculating the percentage of the range where current price is for each symbol being watched.
scope = baseScope
watch1X = math.round(((watchClose - ta.lowest(watchLow, scope)) / (ta.highest(watchHigh, scope) - ta.lowest(watchLow, scope))) * 100, 0)
table.cell(tblWatch, columnId, 2, str.format("{0, number, #}%", watch1X), text_size = size.small, text_color = colorText, bgcolor = getBackColor(watch1X))
//3X Lookback
scope := baseScope * 3
watch3X = math.round(((watchClose - ta.lowest(watchLow, scope)) / (ta.highest(watchHigh, scope) - ta.lowest(watchLow, scope))) * 100, 0)
table.cell(tblWatch, columnId, 3, str.format("{0, number, #}%", watch3X), text_size = size.small, text_color = colorText, bgcolor = getBackColor(watch3X))
Conclusion
The example I've laid out here are for large time windows, because I'm a long term investor. However, keep in mind that this can work on any chart setting, you just need to remember that your chart's time period and scope work together to determine what 1X, 3X, 5X and 10X represent.
Let me try and give you one last scenario on this. Consider your chart is set for a 60 minute chart, meaning each candle represents 60 minutes of time and you set the Stock Watch indicator to a scope = 4. These settings would now represent the following and you would be watching up to 15 different stocks across these windows at one time.
1X = 60 minutes * 4 is 240 minutes or 4 hours of time.
3X = 60 minutes * 4 * 3 = 720 minutes or 12 hours of time.
5X = 60 minutes * 4 * 5 = 1200 minutes or 20 hours of time.
10X = 60 minutes * 4 * 10 = 2400 minutes or 40 hours of time.
I hope you find value in my contribution to the cause of trading, and if you have any comments or critiques, I would love to here from you in the comments.

Dividend Calendar (Zeiierman)█ Overview
The Dividend Calendar is a financial tool designed for investors and analysts in the stock market. Its primary function is to provide a schedule of expected dividend payouts from various companies.
Dividends, which are portions of a company's earnings distributed to shareholders, represent a return on their investment. This calendar is particularly crucial for investors who prioritize dividend income, as it enables them to plan and manage their investment strategies with greater effectiveness. By offering a comprehensive overview of when dividends are due, the Dividend Calendar aids in informed decision-making, allowing investors to time their purchases and sales of stocks to optimize their dividend income. Additionally, it can be a valuable tool for forecasting cash flow and assessing the financial health and dividend-paying consistency of different companies.
█ How to Use
Dividend Yield Analysis:
By tracking dividend growth and payouts, traders can identify stocks with attractive dividend yields. This is particularly useful for income-focused investors who prioritize steady cash flow from their investments.
Income Planning:
For those relying on dividends as a source of income, the calendar helps in forecasting income.
Trend Identification:
Analyzing the growth rates of dividends helps in identifying long-term trends in a company's financial health. Consistently increasing dividends can be a sign of a company's strong financial position, while decreasing dividends might signal potential issues.
Portfolio Diversification:
The tool can assist in diversifying a portfolio by identifying a range of dividend-paying stocks across different sectors. This can help mitigate risk as different sectors may react differently to market conditions.
Timing Investments:
For those who follow a dividend capture strategy, this indicator can be invaluable. It can help in timing the buying and selling of stocks around their ex-dividend dates to maximize dividend income.
█ How it Works
This script is a comprehensive tool for tracking and analyzing stock dividend data. It calculates growth rates, monthly and yearly totals, and allows for custom date handling. Structured to be visually informative, it provides tables and alerts for the easy monitoring of dividend-paying stocks.
Data Retrieval and Estimation: It fetches dividend payout times and amounts for a list of stocks. The script also estimates future values based on historical data.
Growth Analysis: It calculates the average growth rate of dividend payments for each stock, providing insights into dividend consistency and growth over time.
Summation and Aggregation: The script sums up dividends on a monthly and yearly basis, allowing for a clear view of total payouts.
Customization and Alerts: Users can input custom months for dividend tracking. The script also generates alerts for upcoming or current dividend payouts.
Visualization: It produces various tables and visual representations, including full calendar views and income tables, to display the dividend data in an easily understandable format.
█ Settings
Overview:
Currency:
Description: This setting allows the user to specify the currency in which dividend values are displayed. By default, it's set to USD, but users can change it to their local currency.
Impact: Changing this value alters the currency denomination for all dividend values displayed by the script.
Ex-Date or Pay-Date:
Description: Users can select whether to show the Ex-dividend day or the Actual Payout day.
Impact: This changes the reference date for dividend data, affecting the timing of when dividends are shown as due or paid.
Estimate Forward:
Description: Enables traders to predict future dividends based on historical data.
Impact: When enabled, the script estimates future dividend payments, providing a forward-looking view of potential income.
Dividend Table Design:
Description: Choose between viewing the full dividend calendar, just the cumulative monthly dividend, or a summary view.
Impact: This alters the format and extent of the dividend data displayed, catering to different levels of detail a user might require.
Show Dividend Growth:
Description: Users can enable dividend growth tracking over a specified number of years.
Impact: When enabled, the script displays the growth rate of dividends over the selected number of years, providing insight into dividend trends.
Customize Stocks & User Inputs:
This setting allows users to customize the stocks they track, the number of shares they hold, the dividend payout amount, and the payout months.
Impact: Users can tailor the script to their specific portfolio, making the dividend data more relevant and personalized to their investments.
-----------------
Disclaimer
The information contained in my Scripts/Indicators/Ideas/Algos/Systems does not constitute financial advice or a solicitation to buy or sell any securities of any type. I will not accept liability for any loss or damage, including without limitation any loss of profit, which may arise directly or indirectly from the use of or reliance on such information.
All investments involve risk, and the past performance of a security, industry, sector, market, financial product, trading strategy, backtest, or individual's trading does not guarantee future results or returns. Investors are fully responsible for any investment decisions they make. Such decisions should be based solely on an evaluation of their financial circumstances, investment objectives, risk tolerance, and liquidity needs.
My Scripts/Indicators/Ideas/Algos/Systems are only for educational purposes!

Liquidity Depth [Pro+]Description:
Liquidity Depth Pro+ is a trading tool with a remarkable adaptability and perfectly aligned with the intricate demands of the futures, forex, and bond markets. This indicator is based on a concept taught by the Inner Circle Trader (ICT), who explains that institutions tend to dig deeper into Liquidity Pools above highs and below lows. Specifically, ICT mentions how in Forex these Liquidity Depths are classically manifested as 10-20-30 pips respectively.
This tool allows the Analyst to adapt this concept based on their understanding of price. It delves into the essence of institutional trading, exposing deeper liquidity depth pursued by institutional giants and astute bank traders that lay further than the mere extremities of price.
CME_MINI:NQ1! Example (Tuesday):
Price raids Monday's low
Price raids Friday's low
Price digs deeper into one of Friday's Deep Liquidity Pools
Low of the Day Reversal
Note: the Depths used in this example are 30-60-90 points.
Key Features:
Versatility Across Assets: Liquidity Depth Pro+ is finely tailored for futures, forex, and bond markets, making it an all-encompassing solution suitable for a broad range of financial instruments.
Timeframe Customization: Liquidity Depth Pro+ allows users to decide Timeframe Liquidity empowering the analyst with flexibility.
Historical Pools: Choose up to the last 20 highs and lows to mark liquidity pools from the User Selected Timeframe.
Universal Trading Style: Regardless of your trading approach, be it trend-following or reversal models, this indicator embraces all styles. It offers a holistic perspective to navigating liquidity zones above highs and below lows of the chosen Timeframe.
Visual Precision: This indicator visualizes the liquidity depth with a customizable style, allowing the analyst to frame the position of deeper liquidity pools above highs and below lows.
Liquidity Table: Keep track of liquidity levels and unlock faster decision making by taking advantage of the visual Liquidity Table cues.
Adaptive Table Colors: When price is above your desired liquidity pool high, the table will match the liquidity high color to indicate a current liquidity raid or deeper pool being attacked. Vice versa, when price is below your desired liquidity pool low, the table will match the liquidity low color.
Real-Time Alerts: Save Time with live alerts that provide valuable insights into potential opportunities and liquidity purges at your desired liquidity levels.
Other Features:
Choose the Depth Type ("Auto", "Value", "Ticks", "Pips"). The “Auto” feature will select the best unit of measurement for the depths based on the current market on chart.
Choose to show up to Three Liquidity Depths.
Customize the Liquidity Line Style.
Customize the Liquidity Line Color.
Customize the Liquidity Line Width.
Customize Table Size and Location
Usage Guidance:
Add Liquidity Depth to your Tradingview chart.
Customize your desired Timeframe and Liquidity Depths to align with your personal preference.
Observe where the Liquidity Lines manifest above and below your chosen Timeframe’s highs and lows respectively, once they are raided.
Leverage this invaluable information to frame the narrative, whether you opt to pursue liquidity or capitalize on post-purge reversals.
These tools are available ONLY on the TradingView platform.
Terms and Conditions
Our charting tools are products provided for informational and educational purposes only and do not constitute financial, investment, or trading advice. Our charting tools are not designed to predict market movements or provide specific recommendations. Users should be aware that past performance is not indicative of future results and should not be relied upon for making financial decisions. By using our charting tools, the purchaser agrees that the seller and the creator are not responsible for any decisions made based on the information provided by these charting tools. The purchaser assumes full responsibility and liability for any actions taken and the consequences thereof, including any loss of money or investments that may occur as a result of using these products. Hence, by purchasing these charting tools, the customer accepts and acknowledges that the seller and the creator are not liable nor responsible for any unwanted outcome that arises from the development, the sale, or the use of these products.
Finally, the purchaser indemnifies the seller from any and all liability. If the purchaser was invited through the Friends and Family Program, they acknowledge that the provided discount code only applies to the first initial purchase of the Toodegrees Premium Suite subscription. The purchaser is therefore responsible for cancelling – or requesting to cancel – their subscription in the event that they do not wish to continue using the product at full retail price. If the purchaser no longer wishes to use the products, they must unsubscribe from the membership service, if applicable. We hold no reimbursement, refund, or chargeback policy. Once these Terms and Conditions are accepted by the Customer, before purchase, no reimbursements, refunds or chargebacks will be provided under any circumstances.
By continuing to use these charting tools, the user acknowledges and agrees to the Terms and Conditions outlined in this legal disclaimer.

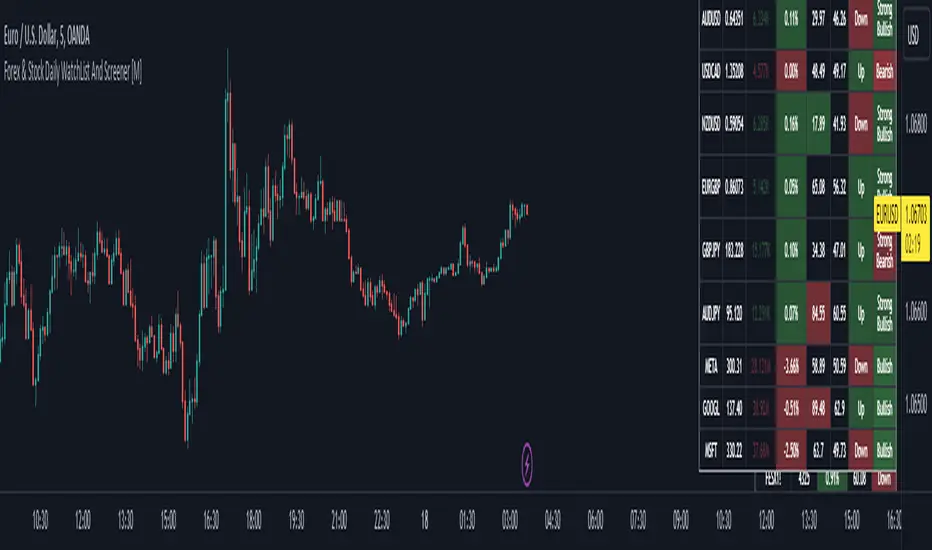
Forex & Stock Daily WatchList And Screener [M]Hi, this is a watchlist and screener indicator for Forex and Stocks.
This indicator is designed for traders who trade in the forex markets and monitor developments in indices and other currency pairs.
It includes information on 14 indices such as the volatility index, Baltic dry index, etc. You can customize the indices as you wish. The indices table contains the index's price (or points), daily change, stochastic value, and trend direction.
The second table is designed for trading forex and stock currency pairs.
In this table, you will find information such as price, volume, change, stochastic, RSI, trend direction, and MACD result for all traded pairs. You can customize all the currency pairs in this table as you wish, and you can also tailor the oscillator settings to your preferences.
In the settings section, you can use checkboxes to hide the pairs in both tables.
The "Customize" section in the settings allows you to personalize the table appearances according to your preferences.
Buy/Sell EMA CandleThis indicator is designed to display various technical indicators, candle patterns, and trend directions on a price chart. Let's break down the code and explain its different sections:
Exponential Moving Averages (EMA):
The code calculates and plots five EMAs of different lengths (13, 21, 55, 90, and 200) on the price chart. These EMAs are used to identify trends and potential crossovers.
Engulfing Candle Patterns:
The code identifies and highlights potential bullish and bearish engulfing candle patterns. It checks if the current candle's body size is larger than the combined body sizes of the previous and subsequent four candles. If this condition is met, it marks the pattern on the chart.
s3.tradingview.com
EMA Crossovers:
The code identifies and highlights points where the shorter EMA (ema1) crosses above or below the longer EMA (ema2). It plots circles to indicate these crossover points.
Candle Direction and RSI Trend:
The code determines the trend direction of the last candle based on whether it closed higher or lower than its open price. It also calculates the RSI (Relative Strength Index) and determines its trend direction (overbought, oversold, or neutral) based on predefined thresholds.
s3.tradingview.com
Table Display:
The code creates a table displaying trend directions for different timeframes (monthly, weekly, daily, 4-hour, and 1-hour) for candle direction and RSI trends. The trends are labeled with "L" for long, "S" for short, and "N/A" for not applicable.
High Volume Bars (HVB):
The code identifies and colors bars with above-average volume as either bullish or bearish based on whether the price closed higher or lower than it opened. The color and conditions for high volume bars can be customized.
s3.tradingview.com
Doji Candle Pattern:
The code identifies and marks doji candle patterns, where the open and close prices are very close to each other within a certain percentage of the candle's high-low range.
RSI-Based Candle Coloring:
The code adjusts the color of the candles based on the RSI value. If the RSI value is above the overbought threshold or below the oversold threshold, the candles are colored yellow.
Usage and Interpretation:
Traders can use this indicator to identify potential trend changes based on EMA crossovers and candle patterns like engulfing and doji.
The RSI trend direction can provide additional insight into potential overbought or oversold conditions.
High volume bars can indicate potential price reversals or continuation patterns.
The table provides an overview of trend directions on different timeframes for both candle direction and RSI trends.
Keep in mind that this is a complex indicator with multiple features. Users should carefully evaluate its performance and consider combining it with other indicators and analysis methods for more accurate trading decisions.
The table is designed to provide a consolidated view of trend directions and other indicators across multiple timeframes. It is displayed on the chart and organized into rows and columns. Each row corresponds to a specific aspect of analysis, and each column corresponds to a different timeframe.
Here's a breakdown of the components of the table:
Row 1: Separation.
Row 2 (Header Row): This row contains the headers for the columns. The headers represent the different timeframes being analyzed, such as Monthly (M), Weekly (W), Daily (D), 4-hour (4h), and 1-hour (1h).
Row 3 (Content Row): This row contains labels indicating the types of information being displayed in the columns. The labels include "T" for Trend, "C" for Current Candle, and "R" for RSI Trend.
Row 4 and Onwards: These rows display the actual data for each aspect of analysis across different timeframes.
For each aspect of analysis (Trend, Current Candle, RSI Trend), the corresponding rows display the following information:
Monthly (M): The trend direction for the given aspect on the monthly timeframe.
Weekly (W): The trend direction for the given aspect on the weekly timeframe.
Daily (D): The trend direction for the given aspect on the daily timeframe.
4-hour (4h): The trend direction for the given aspect on the 4-hour timeframe.
1-hour (1h): The trend direction for the given aspect on the 1-hour timeframe.
The trend directions are represented by labels such as "L" for Long, "S" for Short, or "N/A" for Not Applicable.
The table's purpose is to provide a quick overview of trend directions and related information across multiple timeframes, aiding traders in making informed decisions based on the analysis of trend changes and other indicators.

ProfitAlgoOverview
ProfitAlgo is a powerful and intuitive trading tool specifically developed to cater to the requirements of both beginners and experienced traders. It is designed to function in every timeframe and on all cryptocurrencies, stocks, indices, forex, futures, currencies, ETF's, energy and commodities. This innovative tool provides real-time signals, comprehensive trend analysis, and advanced risk management features, making it an indispensable asset for traders of all levels. This cutting-edge tool generates 'BUY' and 'SELL' signals, complemented by an array of robust analytical tools. Empower your trading analysis with this all-in-one solution and add to your arsenal of indicators to make well-informed decisions.
This algorithm incorporates a sophisticated Fourier smoothing technique to effectively filter price data, reduce noise and reveal underlying patterns and trends. By utilizing multiple price series data and incorporating Price Volume Trend, it leverages volume analysis and price movement patterns. Furthermore, the algorithm employs relative and simple moving average calculations to enhance signal clarity and filter out outliers, resulting in a more refined and robust indicator.
Features
Buy/Sell signals: Visually illustrated by 'BUY' and 'SELL' labels, these signals provide indications to traders about optimal times to enter or exit positions in the market based on the particular asset they are trading. Traders may want to enter long positions when buy signals appear, and enter short positions when 'SELL' signals appear.
Stop Loss/Take Profit Levels: Stop loss and take profit levels are predefined price thresholds that allow traders to automatically exit trades to limit losses or secure profits, respectively. Stop loss and take profit levels are visually depicted through three dotted lines on the trading chart, including the entry price, take profit (TP), and stop loss (SL). Additionally, a table displays the corresponding price entries for all three levels, providing a comprehensive overview of the trade. Traders can effectively manage their risk and optimize their trading by implementing predefined threshold settings and establishing take profit levels, thus safeguarding their profits using a strategic approach.
Support and Resistance Levels: Support and resistance levels are key price levels in the market that act as barriers or turning points for the price movement of an asset. Traders utilize these levels to identify potential areas of buying and selling opportunities. These can be depicted as red (resistance) and green (support) horizontal lines. These levels can serve as valuable complements to stop/loss and take profit levels, providing confirmation for profit-taking opportunities and facilitating effective risk management. Moreover, they can synergistically work alongside the price lines to identify potential reversal zones by visualizing market highs/lows in conjunction with areas of supply & demand.
Moving Average Bands: Moving average bands, plotted alongside the price data, dynamically change color based on the prevailing trend, with red indicating a downtrend and green representing an uptrend. This visual tool provides valuable insights to users, allowing them to quickly identify and interpret market trends. Integrating Moving Average bands with our buy/sell signals offers added confidence in identifying market trends, enabling traders to seek validation and enhance their decision-making process.
Trend Table: The trend table provides real-time information on the current trend of an asset, displaying three distinct outputs: "Uptrend," "Downtrend," and "Ranging Trend." This valuable tool enables users to assess the live trend of an asset, which may differ from the buy/sell signals. The primary objective of this feature is to analyze real-time trends in both ranging and trending market conditions. While the current signal may indicate a 'BUY' signal, the table can present an alternative output, providing valuable insights for traders and investors.
Price Lines: Price lines are depicted as two parallel grey lines running alongside the price data, representing the highs and lows of the market. This visual tool is utilized to identify patterns of higher highs and lower lows, enabling traders to gain insights into the overall trend and potential reversals in the market. When used in conjunction with our signals, MA bands and trend table, it may reinforce your interpretation of the underlying trend as well as provide insights into the trend strength.
*Note: These features are customizable via the settings menu in TradingView.
Calculations
How are buy/sell signals calculated?
The buy and sell signals are generated through a comprehensive calculation process that encompasses various types of analysis techniques. With permission from the author, wbburgin's Fourier transform is utilized to filter and extract relevant information from the price data, removing noise from the signals (filter is only applied in this feature). The buy and sell conditions are calculated based on a combination of volume-based analysis, and price movement patterns, employed to assess the direction and strength of market trends. The combination aims to produce a comprehensive view of both volume-based and price-based market dynamics. By integrating these analysis techniques, traders can gain insights into the relationship between volume, price, and market trends. This combined approach, as well as Fourier smoothing, can help identify potential market reversals, confirm trend strength, produce less noisy data and provide additional confirmation signals for trading decisions. By considering the insights provided by this analysis, the algorithm determines the appropriate actions, signaling the opportunities to enter or exit positions in the market. In summary, these calculations aim to identify favorable trading opportunities by considering factors such as trend strength, volume dynamics, and price patterns, ultimately assisting traders in making well-informed decisions in the market.
How are stop/loss and take/profit levels calculated?
The stop loss and take profit levels are calculated using a combination of technical factors, including the Average True Range (ATR) and Exponential Moving Average (EMA). The rationale for this combination is to enable dynamic risk management and align profit targets with the prevailing market conditions; ATR provides a measure of volatility and risk, while EMA helps identify the underlying trend, allowing for effective stop-loss and take-profit placement. These indicators are utilized to gauge market volatility and determine suitable levels for managing risk and securing potential profits. By incorporating ATR and EMA calculations, the algorithm generates dynamic stop loss and take profit levels that adapt to market conditions.
Calculating support and resistance levels
These levels help identify areas where the price tends to find support (support levels) or encounter resistance (resistance levels). This script utilizes pivot point calculations to determine these significant price levels, which can assist traders in trading decisions regarding potential price reversals, trend continuations, and entry/exit points in their strategies.
What are the moving average bands based on?
The moving average bands, based on VWMA (Volume Weighted Moving Average) calculations using OHLC4 price data, are visualized as unique bands on the chart. VWMA bands are chosen to find trends because they effectively combine volume-weighted calculations with moving averages, providing valuable insights into the strength and direction of price movements. These bands dynamically change color to reflect the prevailing trend. In an uptrend, the bands are represented by a green color, while in a downtrend, they appear in red. The VWMA bands utilize a unique counting method to capture trend movements and potential reversals.
How is the Trend Table calculated?
The underlying trends in the trend table are calculated based on counting methods applied to the VWMA bands. It utilizes specific thresholds to determine different trends, such as "Up Trend," "Down Trend," and "Ranging Trend." These thresholds are used to assess the current trend of the asset and provide valuable insights for traders.
Price Lines Calculation
The price lines are calculated based on the price data. They represent the range of prices, with one line plotted above the closing price and another line plotted below it. The space between these lines is filled to visualize the price volatility. Traders can utilize these lines to identify significant price levels and observe the overall price movement.
Disclaimer:
The information provided in my indicators/strategies/systems is not intended as financial advice. I assume no responsibility for any losses or damages, including loss of profits, resulting from the use of or reliance on such information.
All investments carry risks, and past performance of a security, industry, sector, market, financial product, trading strategy, backtest, or individual's trading does not guarantee future results or returns. Investors bear full responsibility for their investment decisions, which should be based on their own evaluation of financial circumstances, investment objectives, risk tolerance, and liquidity requirements.
Please note that my indicators/strategies/systems are solely for educational purposes! DO NOT request access in the comment's section.

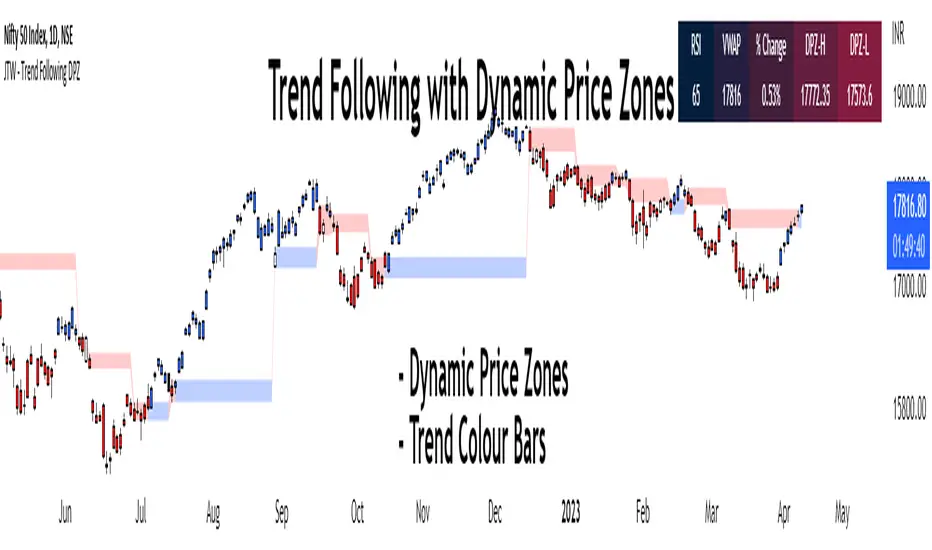
Trend Following with Dynamic Price ZonesThis script provides a complete framework for following trends , especially on those assets which are sufficiently liquid and don't go through random spikes.
Since it is a trend-following system, it works well during trends only. However, I cannot claim any numbers since the execution requires some discretion at the user's end. This framework can also be combined with other technical tools such as trend lines to increase its efficacy.
Features:
Dynamic Price Zones:
• The Dynamic Price Zones (DPZ) are determined using a proprietary logic that incorporates price movement and certain other factors.
• These zones change more rapidly than conventional support and resistance (S/R) zones, which is why I have named them "Dynamic".
• DPZs can serve as support and resistance zones and help with trend identification to some extent.
• The upper boundary of a zone is called Dynamic Price Zone High (DPZ-H) , while the lower boundary is called Dynamic Price Zone Low (DPZ-L) .
Colour Bars:
• Candle colours are based on another proprietary logic, independent of dynamic price zones .
• These are not traditional moving average-based coloured bars, which is evident from the presence of uncoloured bars in between.
• The uncoloured bars indicate periods of uncertain trends .
• Colour functionality helps in smoothening the trend and assists in riding it for as long as possible.
Stats Table:
• RSI
• VWAP
• % Change from the previous day's closing
• Dynamic Price Zone High (DPZ-H) value
• Dynamic Price Zone Low (DPZ-L) value
Settings:
• DPZs are displayed as horizontal lines with background fill by default, but users can toggle lines and background fill on or off.
• Bar colours can be customized according to user preferences.
• The table can be enabled or disabled based on user input.
• The position of the table can be changed based on 4 available options: Top Left, Top Right, Bottom Left, and Bottom Right.
• Users can toggle individual table fields on or off . For example: If the user wants to hide "Vwap" and "%Change" values, he can turn them off. In that case, only 3 fields will be displayed on the table without occupying additional space.
• Background and text colours for each field of the table can be customized based on user preferences.
How to Use the Dynamic Price Zones:
• When the price is above a DPZ, it indicates a bullish trend , suggesting the possibility of higher prices. These zones are termed Bullish DPZs.
• Conversely, if the price is below a DPZ, it signals a bearish trend , with an expectation of lower prices. These zones are termed Bearish DPZs.
• In a trending market, when the price returns to a previous DPZ, it can present a trading opportunity in the direction of the prior trend (e.g., if the market is falling and the price returns to a previous DPZ, it is likely to reject it).
• Consecutive ascending DPZs indicate a shift in buyers from lower to higher levels and can provide buying opportunities. This also indicates a period of a strong bullish trend.
• Similarly, consecutive descending DPZs indicate a shift in sellers from higher to lower levels and can provide selling opportunities. This also indicates a period of a strong bearish trend.
• Please note that we must be flexible when determining the consecutive zones. For example: There may be a few smaller bearish DPZs in between the bullish DPZs but if the area is dominated by the bullish DPZs then we can consider the zones as consecutive. Similar is true for bearish consecutive zones.
• Closely stacked or adjacent zones suggest that prices will likely remain within a range, moving sideways.
• Wider zones act as big hurdles and, the price may struggle to cross them. They may also lead to a sideways movement.
• Zones that remain clean and untested for several sessions are likely to act as strong support or resistance when the price revisits them.
Bullish Examples:
Bearish Examples:
Some Examples of the Complete System
Trend follower system combined with Trendlines
Special Thanks
I would like to extend my special thanks to all the experts whose lectures and blogs I have studied to gain a limited yet significant knowledge of the Pine language.
Best regards,
Rajat Kumar Singh (@johntradingwick)
Community Manager (India), TradingView.
Market Structure & Liquidity: CHoCHs+Nested Pivots+FVGs+Sweeps//Purpose:
This indicator combines several tools to help traders track and interpret price action/market structure; It can be divided into 4 parts;
1. CHoCHs, 2. Nested Pivot highs & lows, 3. Grade sweeps, 4. FVGs.
This gives the trader a toolkit for determining market structure and shifts in market structure to help determine a bull or bear bias, whether it be short-term, med-term or long-term.
This indicator also helps traders in determining liquidity targets: wether they be voids/gaps (FVGS) or old highs/lows+ typical sweep distances.
Finally, the incorporation of HTF CHoCH levels printing on your LTF chart helps keep the bigger picture in mind and tells traders at a glance if they're above of below Custom HTF CHoCH up or CHoCH down (these HTF CHoCHs can be anything from Hourly up to Monthly).
//Nomenclature:
CHoCH = Change of Character
STH/STL = short-term high or low
MTH/MTL = medium-term high or low
LTH/LTL = long-term high or low
FVG = Fair value gap
CE = consequent encroachement (the midline of a FVG)
~~~ The Four components of this indicator ~~~
1. CHoCHs:
•Best demonstrated in the below charts. This was a method taught to me by @Icecold_crypto. Once a 3 bar fractal pivot gets broken, we count backwards the consecutive higher lows or lower highs, then identify the CHoCH as the opposite end of the candle which ended the consecutive backwards count. This CHoCH (UP or DOWN) then becomes a level to watch, if price passes through it in earnest a trader would consider shifting their bias as market structure is deemed to have shifted.
•HTF CHoCHs: Option to print Higher time frame chochs (default on) of user input HTF. This prints only the last UP choch and only the last DOWN choch from the input HTF. Solid line by default so as to distinguish from local/chart-time CHoCHs. Can be any Higher timeframe you like.
•Show on table: toggle on show table(above/below) option to show in table cells (top right): is price above the latest HTF UP choch, or is price below HTF DOWN choch (or is it sat between the two, in a state of 'uncertainty').
•Most recent CHoCHs which have not been met by price will extend 10 bars into the future.
• USER INPUTS: overall setting: SHOW CHOCHS | Set bars lookback number to limit historical Chochs. Set Live CHoCHs number to control the number of active recent chochs unmet by price. Toggle shrink chochs once hit to declutter chart and minimize old chochs to their origin bars. Set Multi-timeframe color override : to make Color choices auto-set to your preference color for each of 1m, 5m, 15m, H, 4H, D, W, M (where up and down are same color, but 'up' icon for up chochs and down icon for down chochs remain printing as normal)
2. Nested Pivot Highs & Lows; aka 'Pivot Highs & Lows (ST/MT/LT)'
•Based on a seperate, longer lookback/lookforward pivot calculation. Identifies Pivot highs and lows with a 'spikeyness' filter (filtering out weak/rounded/unimpressive Pivot highs/lows)
•by 'nested' I mean that the pivot highs are graded based on whether a pivot high sits between two lower pivot highs or vice versa.
--for example: STH = normal pivot. MTH is pivot high with a lower STH on either side. LTH is a pivot high with a lower MTH on either side. Same applies to pivot lows (STL/MTL/LTL)
•This is a useful way to measure the significance of a high or low. Both in terms of how much it might be typically swept by (see later) and what it would imply for HTF bias were we to break through it in earnest (more than just a sweep).
• USER INPUTS: overall setting: show pivot highs & lows | Bars lookback (historical pivots to show) | Pivots: lookback/lookforward length (determines the scale of your pivot highs/lows) | toggle on/off Apply 'Spikeyness' filter (filters out smooth/unimpressive pivot highs/lows). Set Spikeyness index (determines the strength of this filter if turned on) | Individually toggle on each of STH, MTH, LTH, STL, MTL, LTL along with their label text type , and size . Toggle on/off line for each of these Pivot highs/lows. | Set label spacer (atr multiples above / below) | set line style and line width
3. Grade Sweeps:
•These are directly related to the nested pivots described above. Most assets will have a typical sweep distance. I've added some of my expected sweeps for various assets in the indicator tooltips.
--i.e. Eur/Usd 10-20-30 pips is a typical 'grade' sweep. S&P HKEX:5 - HKEX:10 is a typical grade sweep.
•Each of the ST/MT/LT pivot highs and lows have optional user defined grade sweep boxes which paint above until filled (or user option for historical filled boxes to remain).
•Numbers entered into sweep input boxes are auto converted into appropriate units (i.e. pips for FX, $ or 'handles' for indices, $ for Crypto. Very low $ units can be input for low unit value crypto altcoins.
• USER INPUTS: overall setting: Show sweep boxes | individually select colors of each of STH, MTH, LTH, STL, MTL, LTL sweep boxes. | Set Grade sweep ($/pips) number for each of ST, MT, LT. This auto converts between pips and $ (i.e. FX vs Indices/Crypto). Can be a float as small or large as you like ($0.000001 to HKEX:1000 ). | Set box text position (horizontal & vertical) and size , and color . | Set Box width (bars) (for non extended/ non-auto-terminating at price boxes). | toggle on/off Extend boxes/lines right . | Toggle on/off Shrink Grade sweeps on fill (they will disappear in realtime when filled/passed through)
4. FVGs:
•Fair Value gaps. Represent 'naked' candle bodies where the wicks to either side do not meet, forming a 'gap' of sorts which has a tendency to fill, or at least to fill to midline (CE).
•These are ICT concepts. 'UP' FVGS are known as BISIs (Buyside imbalance, sellside inefficiency); 'DOWN' FVGs are known as SIBIs (Sellside imbalance, buyside inefficiency).
• USER INPUTS: overall setting: show FVGs | Bars lookback (history). | Choose to display: 'UP' FVGs (BISI) and/or 'DOWN FVGs (SIBI) . Choose to display the midline: CE , the color and the line style . Choose threshold: use CE (as opposed to Full Fill) |toggle on/off Shrink FVG on fill (CE hit or Full fill) (declutter chart/see backtesting history)
////••Alerts (general notes & cautionary notes)::
•Alerts are optional for most of the levels printed by this indicator. Set them via the three dots on indicator status line.
•Due to dynamic repainting of levels, alerts should be used with caution. Best use these alerts either for Higher time frame levels, or when closely monitoring price.
--E.g. You may set an alert for down-fill of the latest FVG below; but price will keep marching up; form a newer/higher FVG, and the alert will trigger on THAT FVG being down-filled (not the original)
•Available Alerts:
-FVG(BISI) cross above threshold(CE or full-fill; user choice). Same with FVG(SIBI).
-HTF last CHoCH down, cross below | HTF last CHoCH up, cross above.
-last CHoCH down, cross below | last CHoCH up, cross above.
-LTH cross above, MTH cross above, STH cross above | LTL cross below, MTL cross below, STL cross below.
////••Formatting (general)::
•all table text color is set from the 'Pivot highs & Lows (ST, MT, LT)' section (for those of you who prefer black backgrounds).
•User choice of Line-style, line color, line width. Same with Boxes. Icon choice for chochs. Char or label text choices for ST/MT/LT pivot highs & lows.
////••User Inputs (general):
•Each of the 4 components of this indicator can be easily toggled on/off independently.
•Quite a lot of options and toggle boxes, as described in full above. Please take your time and read through all the tooltips (hover over '!' icon) to get an idea of formatting options.
•Several Lookback periods defined in bars to control how much history is shown for each of the 4 components of this indicator.
•'Shrink on fill' settings on FVGs and CHoCHs: Basically a way to declutter chart; toggle on/off depending on if you're backtesting or reading live price action.
•Table Display: applies to ST/MT/LT pivot highs and to HTF CHoCHs; Toggle table on or off (in part or in full)
////••Credits:
•Credit to ICT (Inner Circle Trader) for some of the concepts used in this indicator (FVGS & CEs; Grade sweeps).
•Credit to @Icecold_crypto for the specific and novel concept of identifying CHoCHs in a simple, objective and effective manner (as demonstrated in the 1st chart below).
CHoCH demo page 1: shifting tweak; arrow diagrams to demonstrate how CHoCHs are defined:
CHoCH demo page 2: Simplified view; short lookback history; few CHoCHs, demo of 'latest' choch being extended into the future by 10 bars:
USAGE: Bitcoin Hourly using HTF daily CHoCHs:
USAGE-2: Cotton Futures (CT1!) 2hr. Painting a rather bullish picture. Above HTF UP CHoCH, Local CHoCHs show bullish order flow, Nice targets above (MTH/LTH + grade sweeps):
Full Demo; 5min chart; CHoCHs, Short term pivot highs/lows, grade sweeps, FVGs:
Full Demo, Eur/Usd 15m: STH, MTH, LTH grade sweeps, CHoCHs, Usage for finding bias (part A):
Full Demo, Eur/Usd 15m: STH, MTH, LTH grade sweeps, CHoCHs, Usage for finding bias, 3hrs later (part B):
Realtime Vs Backtesting(A): btc/usd 15m; FVGs and CHoCHs: shrink on fill, once filled they repaint discreetly on their origin bar only. Realtime (Shrink on fill, declutter chart):
Realtime Vs Backtesting(B): btc/usd 15m; FVGs and CHoCHs: DON'T shrink on fill; they extend to the point where price crosses them, and fix/paint there. Backtesting (seeing historical behaviour):

Nasdaq 100 ScreenerNasdaq 100 screener is comprehensive table displaying the following parameters :
Op = Open Price of the Day.
LaP = Last Price.
O-L = Open Price of the Day - Last Price.
ROC = Rate of Change .
SMA20 = Simple Moving Average 20 period.
S20d = Last Price - SMA 20.
SMA50 = Simple Moving Average 50 period.
S50d = Last Price - SMA 50.
SMA200 = Simple Moving Average 200 period.
S200d = Last Price - SMA 200.
ADX(14) = Average Directional Index.
RSI(14) = Relative Strength Index.
CCI(20) = Commodity Channel Index.
ATR(14) = Average True Range.
MOM(10) = Momentum.
AcDis(K) = Accumulation/Distribution.
CMF(20) = Chaikin Money Flow.
MACD = Moving Average Convergence Divergence.
Sig = MACD signal.
Nasdaq 100 stocks are divided into following alphabetical grouping for input access purpose under “Options” in “Settings” menu.
A to B 21 stocks “Input symbols” are listed under the “Options” in “Input A to B”
C to E 18 stocks “Input symbols” are listed under the head “Options” in “Input C to E”
F to L 19 stocks “Input symbols” are listed under the head “Options” in “Input F to L”
M to P 22 stocks “Input symbols” are listed under the head “Options” in “Input M to P”
R to Z 20 stocks “Input symbols” are listed under the head “Options” in “Input R to Z”
A to Z 100 stocks “Input symbols” are listed under the head “Options” in “Input A to Z”
User after visiting the “Settings” menu simply is required to select the “input symbol” from the stock listed under respective alphabetical Input lists to which the particular stock belongs. The resultant data is tabulated under respective row in Table .At a time User can see 5 different stocks i.e one each in different alphabetical lists in respective alphabetical order rows stated in the Table. User can scroll in each list to access and shift to any other stock in the list. In addition a Master list of all 100 stocks is given under “ Input A to Z “ at the last row of table.
Nasdaq 100 screener is a simple table , which facilitate to view 6 different stocks at a time (inclusive one from Master list of “Input A to Z” with a display of 19 parameters.

RotationSUITE [BitAura]𝐑otation𝑺𝑼𝑰𝑻𝑬
This Pine Script® indicator is a dynamic, multi-asset rotation system designed to optimize portfolio allocation by selecting the strongest-performing cryptocurrency from a user-defined basket of up to four assets, with USD as a cash position. By leveraging two complementary relative strength strategies and a proprietary Confidence Score, the system adapts to changing market conditions to aim for superior risk-adjusted returns compared to a buy-and-hold approach.
Logic and Core Concepts
The system’s goal is to allocate capital to the strongest asset at any given time, dynamically switching between two strategies based on market conditions:
1. Ratios System (Primary Strategy)
Mechanism : Performs relative strength analysis by evaluating the trend of each asset pair (e.g., BTCUSD/ETHUSD, BTCUSD/SOLUSD) using a universal trend-capturing function.
Scoring : Each asset earns points based on how many other assets (including USD) it outperforms.
Allocation : Allocates 100% of the portfolio to the asset with the highest score, following a "long the strongest" approach.
2. Alpha System (Defensive Strategy)
Mechanism : Measures each asset’s alpha (excess return relative to market risk, or beta) against a broad market benchmark. A fast trend-following model confirms momentum.
Allocation : Allocates to the asset with the highest positive alpha and confirmed momentum, or to USD if no asset meets the criteria.
3. Confidence Score (Decision Engine)
Monitors the Ratios System’s performance.
High Confidence : Uses the Ratios System for allocation during strong trends.
Low Confidence : Switches to the Alpha System or USD during choppy or corrective markets.
Features
Dynamic Strategy Switching : Seamlessly transitions between Ratios and Alpha systems based on the Confidence Score.
Customizable Asset Basket : Supports up to four user-defined crypto assets (e.g., INDEX:BTCUSD , INDEX:ETHUSD , CRYPTO:SOLUSD , CRYPTO:SUIUSD ).
Comprehensive Visuals :
Performance Metrics Table : Displays Sharpe, Sortino, Omega, Max Drawdown, and Profit Factor for the system, its sub-strategies, and individual assets’ buy-and-hold performance.
Rotation Matrix : Shows pairwise trend scores for the Ratios System and alpha/trend data for the Alpha System.
Allocation Table : Indicates the current portfolio allocation (in %).
Equity Curve Analysis : Plots equity curves for the system, sub-strategies, and buy-and-hold for comparison.
Configurable Alerts : Notifies users of changes in allocation or Confidence Score.
Pine Script v6 : Utilizes advanced features like matrices and table formatting for enhanced usability.
How to Use
Add to Chart : Apply the indicator to any chart (the chart’s ticker does not affect calculations).
Configure Assets : In the settings ( Inputs -> Majors Rotation System Tickers ), define up to four crypto assets. Defaults include INDEX:BTCUSD , INDEX:ETHUSD , CRYPTO:SOLUSD , and CRYPTO:SUIUSD .
Set Allocation Type : Choose Aggressive (100% to top asset), Moderate (80/20 split), or Conservative (60/40 split) in the settings.
Monitor Output : The Portfolio Allocations table shows the current allocation. Use the Performance Metrics and Rotation Matrix tables for deeper insights.
Analyze Equity : Enable equity curve plots in the settings to visualize performance.
Set Alerts : Right-click a plot, select "Add alert," and choose "Confidence Score changed" or "Calculated Portfolio Allocations Changed" to receive notifications.
The system uses robust trend and alpha functions, tested across various timeframes (4h, 8h, 12h) and asset pools to ensure reliability.
Notes
The script is closed-source
Ensure the chart uses a standard price series (not Heikin Ashi or other non-standard types) for accurate results.
The script avoids lookahead bias by using barmerge.lookahead_off in request.security() calls.
Performance metrics are calculated only on the last confirmed bar to optimize runtime efficiency.
Disclaimer : This script is for educational and analytical purposes only and does not constitute financial advice. Trading involves significant risk, and past performance is not indicative of future results. Always conduct your own research and apply proper risk management.

Tzotchev Trend Measure [EdgeTools]Are you still measuring trend strength with moving averages? Here is a better variant at scientific level:
Tzotchev Trend Measure: A Statistical Approach to Trend Following
The Tzotchev Trend Measure represents a sophisticated advancement in quantitative trend analysis, moving beyond traditional moving average-based indicators toward a statistically rigorous framework for measuring trend strength. This indicator implements the methodology developed by Tzotchev et al. (2015) in their seminal J.P. Morgan research paper "Designing robust trend-following system: Behind the scenes of trend-following," which introduced a probabilistic approach to trend measurement that has since become a cornerstone of institutional trading strategies.
Mathematical Foundation and Statistical Theory
The core innovation of the Tzotchev Trend Measure lies in its transformation of price momentum into a probability-based metric through the application of statistical hypothesis testing principles. The indicator employs the fundamental formula ST = 2 × Φ(√T × r̄T / σ̂T) - 1, where ST represents the trend strength score bounded between -1 and +1, Φ(x) denotes the normal cumulative distribution function, T represents the lookback period in trading days, r̄T is the average logarithmic return over the specified period, and σ̂T represents the estimated daily return volatility.
This formulation transforms what is essentially a t-statistic into a probabilistic trend measure, testing the null hypothesis that the mean return equals zero against the alternative hypothesis of non-zero mean return. The use of logarithmic returns rather than simple returns provides several statistical advantages, including symmetry properties where log(P₁/P₀) = -log(P₀/P₁), additivity characteristics that allow for proper compounding analysis, and improved validity of normal distribution assumptions that underpin the statistical framework.
The implementation utilizes the Abramowitz and Stegun (1964) approximation for the normal cumulative distribution function, achieving accuracy within ±1.5 × 10⁻⁷ for all input values. This approximation employs Horner's method for polynomial evaluation to ensure numerical stability, particularly important when processing large datasets or extreme market conditions.
Comparative Analysis with Traditional Trend Measurement Methods
The Tzotchev Trend Measure demonstrates significant theoretical and empirical advantages over conventional trend analysis techniques. Traditional moving average-based systems, including simple moving averages (SMA), exponential moving averages (EMA), and their derivatives such as MACD, suffer from several fundamental limitations that the Tzotchev methodology addresses systematically.
Moving average systems exhibit inherent lag bias, as documented by Kaufman (2013) in "Trading Systems and Methods," where he demonstrates that moving averages inevitably lag price movements by approximately half their period length. This lag creates delayed signal generation that reduces profitability in trending markets and increases false signal frequency during consolidation periods. In contrast, the Tzotchev measure eliminates lag bias by directly analyzing the statistical properties of return distributions rather than smoothing price levels.
The volatility normalization inherent in the Tzotchev formula addresses a critical weakness in traditional momentum indicators. As shown by Bollinger (2001) in "Bollinger on Bollinger Bands," momentum oscillators like RSI and Stochastic fail to account for changing volatility regimes, leading to inconsistent signal interpretation across different market conditions. The Tzotchev measure's incorporation of return volatility in the denominator ensures that trend strength assessments remain consistent regardless of the underlying volatility environment.
Empirical studies by Hurst, Ooi, and Pedersen (2013) in "Demystifying Managed Futures" demonstrate that traditional trend-following indicators suffer from significant drawdowns during whipsaw markets, with Sharpe ratios frequently below 0.5 during challenging periods. The authors attribute these poor performance characteristics to the binary nature of most trend signals and their inability to quantify signal confidence. The Tzotchev measure addresses this limitation by providing continuous probability-based outputs that allow for more sophisticated risk management and position sizing strategies.
The statistical foundation of the Tzotchev approach provides superior robustness compared to technical indicators that lack theoretical grounding. Fama and French (1988) in "Permanent and Temporary Components of Stock Prices" established that price movements contain both permanent and temporary components, with traditional moving averages unable to distinguish between these elements effectively. The Tzotchev methodology's hypothesis testing framework specifically tests for the presence of permanent trend components while filtering out temporary noise, providing a more theoretically sound approach to trend identification.
Research by Moskowitz, Ooi, and Pedersen (2012) in "Time Series Momentum in the Cross Section of Asset Returns" found that traditional momentum indicators exhibit significant variation in effectiveness across asset classes and time periods. Their study of multiple asset classes over decades revealed that simple price-based momentum measures often fail to capture persistent trends in fixed income and commodity markets. The Tzotchev measure's normalization by volatility and its probabilistic interpretation provide consistent performance across diverse asset classes, as demonstrated in the original J.P. Morgan research.
Comparative performance studies conducted by AQR Capital Management (Asness, Moskowitz, and Pedersen, 2013) in "Value and Momentum Everywhere" show that volatility-adjusted momentum measures significantly outperform traditional price momentum across international equity, bond, commodity, and currency markets. The study documents Sharpe ratio improvements of 0.2 to 0.4 when incorporating volatility normalization, consistent with the theoretical advantages of the Tzotchev approach.
The regime detection capabilities of the Tzotchev measure provide additional advantages over binary trend classification systems. Research by Ang and Bekaert (2002) in "Regime Switches in Interest Rates" demonstrates that financial markets exhibit distinct regime characteristics that traditional indicators fail to capture adequately. The Tzotchev measure's five-tier classification system (Strong Bull, Weak Bull, Neutral, Weak Bear, Strong Bear) provides more nuanced market state identification than simple trend/no-trend binary systems.
Statistical testing by Jegadeesh and Titman (2001) in "Profitability of Momentum Strategies" revealed that traditional momentum indicators suffer from significant parameter instability, with optimal lookback periods varying substantially across market conditions and asset classes. The Tzotchev measure's statistical framework provides more stable parameter selection through its grounding in hypothesis testing theory, reducing the need for frequent parameter optimization that can lead to overfitting.
Advanced Noise Filtering and Market Regime Detection
A significant enhancement over the original Tzotchev methodology is the incorporation of a multi-factor noise filtering system designed to reduce false signals during sideways market conditions. The filtering mechanism employs four distinct approaches: adaptive thresholding based on current market regime strength, volatility-based filtering utilizing ATR percentile analysis, trend strength confirmation through momentum alignment, and a comprehensive multi-factor approach that combines all methodologies.
The adaptive filtering system analyzes market microstructure through price change relative to average true range, calculates volatility percentiles over rolling windows, and assesses trend alignment across multiple timeframes using exponential moving averages of varying periods. This approach addresses one of the primary limitations identified in traditional trend-following systems, namely their tendency to generate excessive false signals during periods of low volatility or sideways price action.
The regime detection component classifies market conditions into five distinct categories: Strong Bull (ST > 0.3), Weak Bull (0.1 < ST ≤ 0.3), Neutral (-0.1 ≤ ST ≤ 0.1), Weak Bear (-0.3 ≤ ST < -0.1), and Strong Bear (ST < -0.3). This classification system provides traders with clear, quantitative definitions of market regimes that can inform position sizing, risk management, and strategy selection decisions.
Professional Implementation and Trading Applications
The indicator incorporates three distinct trading profiles designed to accommodate different investment approaches and risk tolerances. The Conservative profile employs longer lookback periods (63 days), higher signal thresholds (0.2), and reduced filter sensitivity (0.5) to minimize false signals and focus on major trend changes. The Balanced profile utilizes standard academic parameters with moderate settings across all dimensions. The Aggressive profile implements shorter lookback periods (14 days), lower signal thresholds (-0.1), and increased filter sensitivity (1.5) to capture shorter-term trend movements.
Signal generation occurs through threshold crossover analysis, where long signals are generated when the trend measure crosses above the specified threshold and short signals when it crosses below. The implementation includes sophisticated signal confirmation mechanisms that consider trend alignment across multiple timeframes and momentum strength percentiles to reduce the likelihood of false breakouts.
The alert system provides real-time notifications for trend threshold crossovers, strong regime changes, and signal generation events, with configurable frequency controls to prevent notification spam. Alert messages are standardized to ensure consistency across different market conditions and timeframes.
Performance Optimization and Computational Efficiency
The implementation incorporates several performance optimization features designed to handle large datasets efficiently. The maximum bars back parameter allows users to control historical calculation depth, with default settings optimized for most trading applications while providing flexibility for extended historical analysis. The system includes automatic performance monitoring that generates warnings when computational limits are approached.
Error handling mechanisms protect against division by zero conditions, infinite values, and other numerical instabilities that can occur during extreme market conditions. The finite value checking system ensures data integrity throughout the calculation process, with fallback mechanisms that maintain indicator functionality even when encountering corrupted or missing price data.
Timeframe validation provides warnings when the indicator is applied to unsuitable timeframes, as the Tzotchev methodology was specifically designed for daily and higher timeframe analysis. This validation helps prevent misapplication of the indicator in contexts where its statistical assumptions may not hold.
Visual Design and User Interface
The indicator features eight professional color schemes designed for different trading environments and user preferences. The EdgeTools theme provides an institutional blue and steel color palette suitable for professional trading environments. The Gold theme offers warm colors optimized for commodities trading. The Behavioral theme incorporates psychology-based color contrasts that align with behavioral finance principles. The Quant theme provides neutral colors suitable for analytical applications.
Additional specialized themes include Ocean, Fire, Matrix, and Arctic variations, each optimized for specific visual preferences and trading contexts. All color schemes include automatic dark and light mode optimization to ensure optimal readability across different chart backgrounds and trading platforms.
The information table provides real-time display of key metrics including current trend measure value, market regime classification, signal strength, Z-score, average returns, volatility measures, filter threshold levels, and filter effectiveness percentages. This comprehensive dashboard allows traders to monitor all relevant indicator components simultaneously.
Theoretical Implications and Research Context
The Tzotchev Trend Measure addresses several theoretical limitations inherent in traditional technical analysis approaches. Unlike moving average-based systems that rely on price level comparisons, this methodology grounds trend analysis in statistical hypothesis testing, providing a more robust theoretical foundation for trading decisions.
The probabilistic interpretation of trend strength offers significant advantages over binary trend classification systems. Rather than simply indicating whether a trend exists, the measure quantifies the statistical confidence level associated with the trend assessment, allowing for more nuanced risk management and position sizing decisions.
The incorporation of volatility normalization addresses the well-documented problem of volatility clustering in financial time series, ensuring that trend strength assessments remain consistent across different market volatility regimes. This normalization is particularly important for portfolio management applications where consistent risk metrics across different assets and time periods are essential.
Practical Applications and Trading Strategy Integration
The Tzotchev Trend Measure can be effectively integrated into various trading strategies and portfolio management frameworks. For trend-following strategies, the indicator provides clear entry and exit signals with quantified confidence levels. For mean reversion strategies, extreme readings can signal potential turning points. For portfolio allocation, the regime classification system can inform dynamic asset allocation decisions.
The indicator's statistical foundation makes it particularly suitable for quantitative trading strategies where systematic, rules-based approaches are preferred over discretionary decision-making. The standardized output range facilitates easy integration with position sizing algorithms and risk management systems.
Risk management applications benefit from the indicator's ability to quantify trend strength and provide early warning signals of potential trend changes. The multi-timeframe analysis capability allows for the construction of robust risk management frameworks that consider both short-term tactical and long-term strategic market conditions.
Implementation Guide and Parameter Configuration
The practical application of the Tzotchev Trend Measure requires careful parameter configuration to optimize performance for specific trading objectives and market conditions. This section provides comprehensive guidance for parameter selection and indicator customization.
Core Calculation Parameters
The Lookback Period parameter controls the statistical window used for trend calculation and represents the most critical setting for the indicator. Default values range from 14 to 63 trading days, with shorter periods (14-21 days) providing more sensitive trend detection suitable for short-term trading strategies, while longer periods (42-63 days) offer more stable trend identification appropriate for position trading and long-term investment strategies. The parameter directly influences the statistical significance of trend measurements, with longer periods requiring stronger underlying trends to generate significant signals but providing greater reliability in trend identification.
The Price Source parameter determines which price series is used for return calculations. The default close price provides standard trend analysis, while alternative selections such as high-low midpoint ((high + low) / 2) can reduce noise in volatile markets, and volume-weighted average price (VWAP) offers superior trend identification in institutional trading environments where volume concentration matters significantly.
The Signal Threshold parameter establishes the minimum trend strength required for signal generation, with values ranging from -0.5 to 0.5. Conservative threshold settings (0.2 to 0.3) reduce false signals but may miss early trend opportunities, while aggressive settings (-0.1 to 0.1) provide earlier signal generation at the cost of increased false positive rates. The optimal threshold depends on the trader's risk tolerance and the volatility characteristics of the traded instrument.
Trading Profile Configuration
The Trading Profile system provides pre-configured parameter sets optimized for different trading approaches. The Conservative profile employs a 63-day lookback period with a 0.2 signal threshold and 0.5 noise sensitivity, designed for long-term position traders seeking high-probability trend signals with minimal false positives. The Balanced profile uses a 21-day lookback with 0.05 signal threshold and 1.0 noise sensitivity, suitable for swing traders requiring moderate signal frequency with acceptable noise levels. The Aggressive profile implements a 14-day lookback with -0.1 signal threshold and 1.5 noise sensitivity, optimized for day traders and scalpers requiring frequent signal generation despite higher noise levels.
Advanced Noise Filtering System
The noise filtering mechanism addresses the challenge of false signals during sideways market conditions through four distinct methodologies. The Adaptive filter adjusts thresholds based on current trend strength, increasing sensitivity during strong trending periods while raising thresholds during consolidation phases. The Volatility-based filter utilizes Average True Range (ATR) percentile analysis to suppress signals during abnormally volatile conditions that typically generate false trend indications.
The Trend Strength filter requires alignment between multiple momentum indicators before confirming signals, reducing the probability of false breakouts from consolidation patterns. The Multi-factor approach combines all filtering methodologies using weighted scoring to provide the most robust noise reduction while maintaining signal responsiveness during genuine trend initiations.
The Noise Sensitivity parameter controls the aggressiveness of the filtering system, with lower values (0.5-1.0) providing conservative filtering suitable for volatile instruments, while higher values (1.5-2.0) allow more signals through but may increase false positive rates during choppy market conditions.
Visual Customization and Display Options
The Color Scheme parameter offers eight professional visualization options designed for different analytical preferences and market conditions. The EdgeTools scheme provides high contrast visualization optimized for trend strength differentiation, while the Gold scheme offers warm tones suitable for commodity analysis. The Behavioral scheme uses psychological color associations to enhance decision-making speed, and the Quant scheme provides neutral colors appropriate for quantitative analysis environments.
The Ocean, Fire, Matrix, and Arctic schemes offer additional aesthetic options while maintaining analytical functionality. Each scheme includes optimized colors for both light and dark chart backgrounds, ensuring visibility across different trading platform configurations.
The Show Glow Effects parameter enhances plot visibility through multiple layered lines with progressive transparency, particularly useful when analyzing multiple timeframes simultaneously or when working with dense price data that might obscure trend signals.
Performance Optimization Settings
The Maximum Bars Back parameter controls the historical data depth available for calculations, with values ranging from 5,000 to 50,000 bars. Higher values enable analysis of longer-term trend patterns but may impact indicator loading speed on slower systems or when applied to multiple instruments simultaneously. The optimal setting depends on the intended analysis timeframe and available computational resources.
The Calculate on Every Tick parameter determines whether the indicator updates with every price change or only at bar close. Real-time calculation provides immediate signal updates suitable for scalping and day trading strategies, while bar-close calculation reduces computational overhead and eliminates signal flickering during bar formation, preferred for swing trading and position management applications.
Alert System Configuration
The Alert Frequency parameter controls notification generation, with options for all signals, bar close only, or once per bar. High-frequency trading strategies benefit from all signals mode, while position traders typically prefer bar close alerts to avoid premature position entries based on intrabar fluctuations.
The alert system generates four distinct notification types: Long Signal alerts when the trend measure crosses above the positive signal threshold, Short Signal alerts for negative threshold crossings, Bull Regime alerts when entering strong bullish conditions, and Bear Regime alerts for strong bearish regime identification.
Table Display and Information Management
The information table provides real-time statistical metrics including current trend value, regime classification, signal status, and filter effectiveness measurements. The table position can be customized for optimal screen real estate utilization, and individual metrics can be toggled based on analytical requirements.
The Language parameter supports both English and German display options for international users, while maintaining consistent calculation methodology regardless of display language selection.
Risk Management Integration
Effective risk management integration requires coordination between the trend measure signals and position sizing algorithms. Strong trend readings (above 0.5 or below -0.5) support larger position sizes due to higher probability of trend continuation, while neutral readings (between -0.2 and 0.2) suggest reduced position sizes or range-trading strategies.
The regime classification system provides additional risk management context, with Strong Bull and Strong Bear regimes supporting trend-following strategies, while Neutral regimes indicate potential for mean reversion approaches. The filter effectiveness metric helps traders assess current market conditions and adjust strategy parameters accordingly.
Timeframe Considerations and Multi-Timeframe Analysis
The indicator's effectiveness varies across different timeframes, with higher timeframes (daily, weekly) providing more reliable trend identification but slower signal generation, while lower timeframes (hourly, 15-minute) offer faster signals with increased noise levels. Multi-timeframe analysis combining trend alignment across multiple periods significantly improves signal quality and reduces false positive rates.
For optimal results, traders should consider trend alignment between the primary trading timeframe and at least one higher timeframe before entering positions. Divergences between timeframes often signal potential trend reversals or consolidation periods requiring strategy adjustment.
Conclusion
The Tzotchev Trend Measure represents a significant advancement in technical analysis methodology, combining rigorous statistical foundations with practical trading applications. Its implementation of the J.P. Morgan research methodology provides institutional-quality trend analysis capabilities previously available only to sophisticated quantitative trading firms.
The comprehensive parameter configuration options enable customization for diverse trading styles and market conditions, while the advanced noise filtering and regime detection capabilities provide superior signal quality compared to traditional trend-following indicators. Proper parameter selection and understanding of the indicator's statistical foundation are essential for achieving optimal trading results and effective risk management.
References
Abramowitz, M. and Stegun, I.A. (1964). Handbook of Mathematical Functions with Formulas, Graphs, and Mathematical Tables. Washington: National Bureau of Standards.
Ang, A. and Bekaert, G. (2002). Regime Switches in Interest Rates. Journal of Business and Economic Statistics, 20(2), 163-182.
Asness, C.S., Moskowitz, T.J., and Pedersen, L.H. (2013). Value and Momentum Everywhere. Journal of Finance, 68(3), 929-985.
Bollinger, J. (2001). Bollinger on Bollinger Bands. New York: McGraw-Hill.
Fama, E.F. and French, K.R. (1988). Permanent and Temporary Components of Stock Prices. Journal of Political Economy, 96(2), 246-273.
Hurst, B., Ooi, Y.H., and Pedersen, L.H. (2013). Demystifying Managed Futures. Journal of Investment Management, 11(3), 42-58.
Jegadeesh, N. and Titman, S. (2001). Profitability of Momentum Strategies: An Evaluation of Alternative Explanations. Journal of Finance, 56(2), 699-720.
Kaufman, P.J. (2013). Trading Systems and Methods. 5th Edition. Hoboken: John Wiley & Sons.
Moskowitz, T.J., Ooi, Y.H., and Pedersen, L.H. (2012). Time Series Momentum. Journal of Financial Economics, 104(2), 228-250.
Tzotchev, D., Lo, A.W., and Hasanhodzic, J. (2015). Designing robust trend-following system: Behind the scenes of trend-following. J.P. Morgan Quantitative Research, Asset Management Division.

Simplified Market ForecastSimplified Market Forecast Indicator
This indicator pairs nicely with the Contrarian 100 MA and can be located here:
Overview
The "Simplified Market Forecast" (SMF) indicator is a streamlined technical analysis tool designed for traders to identify potential buy and sell opportunities based on a momentum-based oscillator. By analyzing price movements relative to a defined lookback period, SMF generates clear buy and sell signals when the oscillator crosses customizable threshold levels. This indicator is versatile, suitable for various markets (e.g., forex, stocks, cryptocurrencies), and optimized for daily timeframes, though it can be adapted to other timeframes with proper testing. Its intuitive design and visual cues make it accessible for both novice and experienced traders.
How It Works
The SMF indicator calculates a momentum oscillator based on the price’s position within a specified range over a user-defined lookback period. It then smooths this value to reduce noise and plots the result as a line in a separate lower pane. Buy and sell signals are generated when the smoothed oscillator crosses above a user-defined buy level or below a user-defined sell level, respectively. These signals are visualized as triangles either on the main chart or in the lower pane, with a table displaying the current ticker and oscillator value for quick reference.
Key Components
Momentum Oscillator: The indicator measures the price’s position relative to the highest high and lowest low over a specified period, normalized to a 0–100 scale.
Signal Generation: Buy signals occur when the oscillator crosses above the buy level (default: 15), indicating potential oversold conditions. Sell signals occur when the oscillator crosses below the sell level (default: 85), suggesting potential overbought conditions.
Visual Aids: The indicator includes customizable horizontal lines for buy and sell levels, shaded zones for clarity, and a table showing the ticker and current oscillator value.
Mathematical Concepts
Oscillator Calculation: The indicator uses the following formula to compute the raw oscillator value:
c1I = close - lowest(low, medLen)
c2I = highest(high, medLen) - lowest(low, medLen)
fastK_I = (c1I / c2I) * 100
The result is smoothed using a 5-period Simple Moving Average (SMA) to produce the final oscillator value (inter).
Signal Logic:
A buy signal is triggered when the smoothed oscillator crosses above the buy level (ta.crossover(inter, buyLevel)).
A sell signal is triggered when the smoothed oscillator crosses below the sell level (ta.crossunder(inter, sellLevel)).
Entry and Exit Rules
Buy Signal (Blue Triangle): Triggered when the oscillator crosses above the buy level (default: 15), indicating a potential oversold condition and a buying opportunity. The signal appears as a blue triangle either below the price bar (if plotted on the main chart) or at the bottom of the lower pane.
Sell Signal (White Triangle): Triggered when the oscillator crosses below the sell level (default: 85), indicating a potential overbought condition and a selling opportunity. The signal appears as a white triangle either above the price bar (if plotted on the main chart) or at the top of the lower pane.
Exit Rules: Traders can exit positions when an opposite signal occurs (e.g., exit a buy on a sell signal) or based on additional technical analysis tools (e.g., support/resistance, trendlines). Always apply proper risk management.
Recommended Usage
The SMF indicator is optimized for the daily timeframe but can be adapted to other timeframes (e.g., 1H, 4H) with careful testing. It performs best in markets with clear momentum shifts, such as trending or range-bound conditions. Traders should:
Backtest the indicator on their chosen asset and timeframe to validate signal reliability.
Combine with other indicators (e.g., moving averages, support/resistance) or price action for confirmation.
Adjust the lookback period and buy/sell levels to suit market volatility and trading style.
Customization Options
Intermediate Length: Adjust the lookback period for the oscillator calculation (default: 31 bars).
Buy/Sell Levels: Customize the threshold levels for buy (default: 15) and sell (default: 85) signals.
Colors: Modify the colors of the oscillator line, buy/sell signals, and threshold lines.
Signal Display: Toggle whether signals appear on the main chart or in the lower pane.
Visual Aids: The indicator includes dotted horizontal lines at the buy (green) and sell (red) levels, with shaded zones between 0–buy level (green) and sell level–100 (red) for clarity.
Ticker Table: A table in the top-right corner displays the current ticker and oscillator value (in percentage), with customizable colors.
Why Use This Indicator?
The "Simplified Market Forecast" indicator provides a straightforward, momentum-based approach to identifying potential reversals in overbought or oversold markets. Its clear signals, customizable settings, and visual aids make it easy to integrate into various trading strategies. Whether you’re a swing trader or a day trader, SMF offers a reliable tool to enhance decision-making and improve market timing.
Tips for Users
Test the indicator thoroughly on your chosen asset and timeframe to optimize settings.
Use in conjunction with other technical tools for stronger trade confirmation.
Adjust the buy and sell levels based on market conditions (e.g., lower levels for less volatile markets).
Monitor the ticker table for real-time oscillator values to gauge market momentum.
Happy trading with the Simplified Market Forecast indicator!

Calculator - AOC📊 Calculator - AOC Indicator 🚀
The Calculator - AOC indicator is a powerful and user-friendly tool designed for TradingView to help traders plan and visualize trades with precision. It calculates key trade metrics, displays entry, take-profit (TP), stop-loss (SL), and liquidation levels, and provides a clear overview of risk management and potential profits. Perfect for both novice and experienced traders! 💡
✨ Features
📈 Trade Planning: Input your Entry Price, Take Profit (TP), Stop Loss (SL), and Trade Direction (Long/Short) to visualize your trade setup on the chart.
💰 Risk Management: Set your Initial Capital and Risk per Trade (%) to calculate the optimal Position Size and Risk Amount for each trade.
⚖️ Leverage Support: Define your Leverage to compute the Required Margin and Liquidation Price, ensuring you stay aware of potential risks.
📊 Risk/Reward Ratio: Automatically calculates the Risk-to-Reward Ratio to evaluate trade profitability.
🎨 Visuals: Displays Entry, TP, SL, and Liquidation levels as lines and boxes on the chart, with customizable Line Width, Line Style, and Label Size.
✅ Trade Validation: Checks if your trade setup is valid (e.g., correct TP/SL placement) and highlights issues like potential liquidation risks with color-coded statuses (Correct ✅, Incorrect ❌, or Liquidation ⚠️).
📋 Summary Table: A clean, top-right table summarizes key metrics: Capital, Risk %, Risk Amount, Position Size, Potential Profit, Risk/Reward, Margin, Liquidation Price, Trade Status, and % to TP/SL.
🖌️ Customization: Adjust Line Extension (Bars) for how far lines extend, and choose from Solid, Dashed, or Dotted line styles for a personalized chart experience.
🛠️ How to Use
Add to Chart: Apply the indicator to your TradingView chart.
Configure Inputs:
Accountability: Set your Initial Capital and Risk per Trade (%).
Target: Enter Entry Price, TP, and SL prices.
Leverage: Specify your leverage (e.g., 10x).
Direction: Choose Long or Short.
Display Settings: Customize Line Width, Line Style, Label Size, and Line Extension.
Analyze: The indicator plots Entry, TP, SL, and Liquidation levels on the chart and displays a table with all trade metrics.
Validate: Check the Trade Status in the table to ensure your setup is valid or if adjustments are needed.
🎯 Why Use It?
Plan Smarter: Visualize your trade setup and understand your risk/reward profile instantly.
Stay Disciplined: Precise position sizing and risk calculations help you stick to your trading plan.
Avoid Mistakes: Clear validation warnings prevent costly errors like incorrect TP/SL placement or liquidation risks.
User-Friendly: Intuitive visuals and a summary table make trade analysis quick and easy.
📝 Notes
Ensure Entry, TP, and SL prices align with your trade direction to avoid "Incorrect" or "Liquidation" statuses.
The indicator updates dynamically on the latest bar, ensuring real-time visuals.
Best used with proper risk management to maximize trading success! 💪
Happy trading! 🚀📈
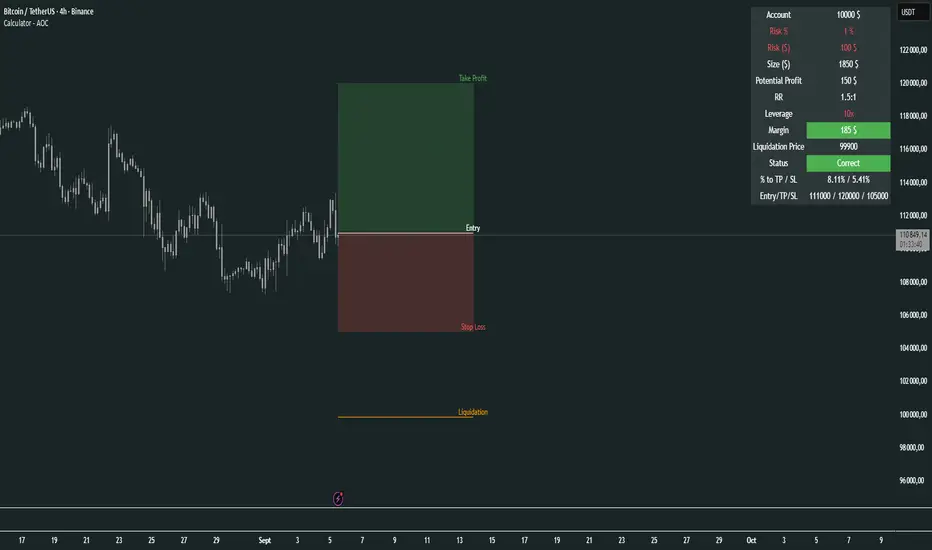
Engulfing Candles Tarama// This Pine Scriptâ„¢ code is subject to the terms of the Mozilla Public License 2.0 at mozilla.org
// © dipavcisi0007
//@version=5
indicator('Engulfing Candles Tarama', overlay=true)
longer = ta.sma(close, 50)
short = ta.sma(close, 20)
length1 = input(14)
price = close
length = input.int(20, minval=1)
ad = close == high and close == low or high == low ? 0 : (close - open) / (high - low) * volume
//ad = close==high and close==low or high==low ? 0 : ((2*close-low-high)/(high-low))*volume
mf = math.sum(ad, length) / math.sum(volume, length)
crsis = mf
openBarCurrent1 = open
closeBarCurrent1 = close
highBarCurrent1 = high
lowBarCurrent1 = low
volumeBarCurrent1 = volume
topvolumeBarCurrent1 = math.sum(volume , 50) / 50
BarOran1 = (closeBarCurrent1 - openBarCurrent1) / (highBarCurrent1 - lowBarCurrent1)
//BarOran1=(2*closeBarCurrent1-lowBarCurrent1-highBarCurrent1)/(highBarCurrent1-lowBarCurrent1)
openBarCurrent2 = open
closeBarCurrent2 = close
highBarCurrent2 = high
lowBarCurrent2 = low
volumeBarCurrent2 = volume
topvolumeBarCurrent2 = math.sum(volume , 50) / 50
BarOran2 = (closeBarCurrent2 - openBarCurrent2) / (highBarCurrent2 - lowBarCurrent2)
//BarOran2=(2*closeBarCurrent2-lowBarCurrent2-highBarCurrent2)/(highBarCurrent2-lowBarCurrent2)
openBarCurrent3 = open
closeBarCurrent3 = close
highBarCurrent3 = high
lowBarCurrent3 = low
volumeBarCurrent3 = volume
topvolumeBarCurrent3 = math.sum(volume , 50) / 50
BarOran3 = (closeBarCurrent3 - openBarCurrent3) / (highBarCurrent3 - lowBarCurrent3)
//BarOran3=(2*closeBarCurrent3-lowBarCurrent3-highBarCurrent3)/(highBarCurrent3-lowBarCurrent3)
cmi = 0.15
oran = 0.90
katsayi = 1.05
stoporan = 1
length2 = input(14)
price1 = close
vrsi = ta.rsi(price1, length2)
//If current bar open is less than equal to the previous bar close AND current bar open is less than previous bar open AND current bar close is greater than previous bar open THEN True
bullishEngulfing1 = BarOran1 > oran and BarOran1 * volumeBarCurrent1 > topvolumeBarCurrent1 * katsayi and crsis > cmi and close > highBarCurrent1
//If current bar open is greater than equal to previous bar close AND current bar open is greater than previous bar open AND current bar close is less than previous bar open THEN True
bullishEngulfing2 = BarOran2 > oran and BarOran2 * volumeBarCurrent2 > topvolumeBarCurrent2 * katsayi and crsis > cmi and close > highBarCurrent2
//If current bar open is greater than equal to previous bar close AND current bar open is greater than previous bar open AND current bar close is less than previous bar open THEN True
bullishEngulfing3 = BarOran3 > oran and BarOran3 * volumeBarCurrent3 > topvolumeBarCurrent3 * katsayi and crsis > cmi and close > highBarCurrent3
var K1 = 0.0
res = input.timeframe(title='Time Frame', defval='D')
if bullishEngulfing1
K1 := lowBarCurrent1
else if bullishEngulfing2
K1 := lowBarCurrent2
else if bullishEngulfing3
K1 := lowBarCurrent3
plot(K1, linewidth=2, color=color.new(color.purple, 0), title='TSL')
//bullishEngulfing/bearishEngulfing return a value of 1 or 0; if 1 then plot on chart, if 0 then don't plot
plotshape(bullishEngulfing1 or bullishEngulfing2 or bullishEngulfing3, style=shape.triangleup, location=location.belowbar, color=color.new(#43A047, 0), size=size.tiny)
////////////////////////
grupSec = input.string(defval='1', options= , group='Taraması yapılacak 40\'arlı gruplardan birini seçin', title='Grup seç')
per = input.timeframe(defval='', title='PERİYOT',group = "Tarama yapmak istediğiniz periyotu seçin")
func() =>
cond = bullishEngulfing1 or bullishEngulfing2 or bullishEngulfing3
//GRUP VE TARANACAK HÄ°SSE SAYISINI AYNI ÅEKÄ°LDE DÄ°LEDÄ°ÄÄ°NÄ°Z GÄ°BÄ° ARTIRABÄ°LÄ°RSÄ°NÄ°Z.
a01 = grupSec == '1' ? 'BIST:A1CAP' : grupSec == '2' ? 'BIST:ANSGR' : grupSec == '3' ? 'BIST:BEYAZ' : grupSec == '4' ? 'BIST:CEMZY' : grupSec == '5' ? 'BIST:DURKN' : grupSec == '6' ? 'BIST:EUYO' : grupSec == '7' ? 'BIST:HALKB' : grupSec == '8' ? 'BIST:ISGYO' : grupSec == '9' ? 'BIST:KOPOL' : grupSec == '10' ? 'BIST:MARKA' : grupSec == '11' ? 'BIST:ONCSM' : grupSec == '12' ? 'BIST:POLTK' : grupSec == '13' ? 'BIST:SISE' : grupSec == '14' ? 'BIST:TOASO' : grupSec == '15' ? 'BIST:YBTAS' : na
a02 = grupSec == '1' ? 'BIST:ACSEL' : grupSec == '2' ? 'BIST:ARASE' : grupSec == '3' ? 'BIST:BFREN' : grupSec == '4' ? 'BIST:CEOEM' : grupSec == '5' ? 'BIST:DYOBY' : grupSec == '6' ? 'BIST:EYGYO' : grupSec == '7' ? 'BIST:HATEK' : grupSec == '8' ? 'BIST:ISKPL' : grupSec == '9' ? 'BIST:KORDS' : grupSec == '10' ? 'BIST:MARTI' : grupSec == '11' ? 'BIST:ONRYT' : grupSec == '12' ? 'BIST:PRDGS' : grupSec == '13' ? 'BIST:SKBNK' : grupSec == '14' ? 'BIST:TRCAS' : grupSec == '15' ? 'BIST:YEOTK' : na
a03 = grupSec == '1' ? 'BIST:ADEL' : grupSec == '2' ? 'BIST:ARCLK' : grupSec == '3' ? 'BIST:BIENY' : grupSec == '4' ? 'BIST:CIMSA' : grupSec == '5' ? 'BIST:DZGYO' : grupSec == '6' ? 'BIST:FADE' : grupSec == '7' ? 'BIST:HATSN' : grupSec == '8' ? 'BIST:ISKUR' : grupSec == '9' ? 'BIST:KOTON' : grupSec == '10' ? 'BIST:MAVI' : grupSec == '11' ? 'BIST:ORCAY' : grupSec == '12' ? 'BIST:PRKAB' : grupSec == '13' ? 'BIST:SKTAS' : grupSec == '14' ? 'BIST:TRGYO' : grupSec == '15' ? 'BIST:YESIL' : na
a04 = grupSec == '1' ? 'BIST:ADESE' : grupSec == '2' ? 'BIST:ARDYZ' : grupSec == '3' ? 'BIST:BIGCH' : grupSec == '4' ? 'BIST:CLEBI' : grupSec == '5' ? 'BIST:EBEBK' : grupSec == '6' ? 'BIST:FENER' : grupSec == '7' ? 'BIST:HDFGS' : grupSec == '8' ? 'BIST:ISMEN' : grupSec == '9' ? 'BIST:KOZAA' : grupSec == '10' ? 'BIST:MEDTR' : grupSec == '11' ? 'BIST:ORGE' : grupSec == '12' ? 'BIST:PRKME' : grupSec == '13' ? 'BIST:SKYLP' : grupSec == '14' ? 'BIST:TRILC' : grupSec == '15' ? 'BIST:YGGYO' : na
a05 = grupSec == '1' ? 'BIST:ADGYO' : grupSec == '2' ? 'BIST:ARENA' : grupSec == '3' ? 'BIST:BIMAS' : grupSec == '4' ? 'BIST:CMBTN' : grupSec == '5' ? 'BIST:ECILC' : grupSec == '6' ? 'BIST:FLAP' : grupSec == '7' ? 'BIST:HEDEF' : grupSec == '8' ? 'BIST:ISSEN' : grupSec == '9' ? 'BIST:KOZAL' : grupSec == '10' ? 'BIST:MEGAP' : grupSec == '11' ? 'BIST:ORMA' : grupSec == '12' ? 'BIST:PRZMA' : grupSec == '13' ? 'BIST:SKYMD' : grupSec == '14' ? 'BIST:TSGYO' : grupSec == '15' ? 'BIST:YGYO' : na
a06 = grupSec == '1' ? 'BIST:AEFES' : grupSec == '2' ? 'BIST:ARSAN' : grupSec == '3' ? 'BIST:BINBN' : grupSec == '4' ? 'BIST:CMENT' : grupSec == '5' ? 'BIST:ECZYT' : grupSec == '6' ? 'BIST:FMIZP' : grupSec == '7' ? 'BIST:HEKTS' : grupSec == '8' ? 'BIST:ISYAT' : grupSec == '9' ? 'BIST:KRDMA' : grupSec == '10' ? 'BIST:MEGMT' : grupSec == '11' ? 'BIST:OSMEN' : grupSec == '12' ? 'BIST:PSDTC' : grupSec == '13' ? 'BIST:SMART' : grupSec == '14' ? 'BIST:TSKB' : grupSec == '15' ? 'BIST:YIGIT' : na
a07 = grupSec == '1' ? 'BIST:AFYON' : grupSec == '2' ? 'BIST:ARTMS' : grupSec == '3' ? 'BIST:BINHO' : grupSec == '4' ? 'BIST:CONSE' : grupSec == '5' ? 'BIST:EDATA' : grupSec == '6' ? 'BIST:FONET' : grupSec == '7' ? 'BIST:HKTM' : grupSec == '8' ? 'BIST:IZENR' : grupSec == '9' ? 'BIST:KRDMB' : grupSec == '10' ? 'BIST:MEKAG' : grupSec == '11' ? 'BIST:OSTIM' : grupSec == '12' ? 'BIST:PSGYO' : grupSec == '13' ? 'BIST:SMRTG' : grupSec == '14' ? 'BIST:TSPOR' : grupSec == '15' ? 'BIST:YKBNK' : na
a08 = grupSec == '1' ? 'BIST:AGESA' : grupSec == '2' ? 'BIST:ARZUM' : grupSec == '3' ? 'BIST:BIOEN' : grupSec == '4' ? 'BIST:COSMO' : grupSec == '5' ? 'BIST:EDIP' : grupSec == '6' ? 'BIST:FORMT' : grupSec == '7' ? 'BIST:HLGYO' : grupSec == '8' ? 'BIST:IZFAS' : grupSec == '9' ? 'BIST:KRDMD' : grupSec == '10' ? 'BIST:MEPET' : grupSec == '11' ? 'BIST:OTKAR' : grupSec == '12' ? 'BIST:QNBFK' : grupSec == '13' ? 'BIST:SNGYO' : grupSec == '14' ? 'BIST:TTKOM' : grupSec == '15' ? 'BIST:YKSLN' : na
a09 = grupSec == '1' ? 'BIST:AGHOL' : grupSec == '2' ? 'BIST:ASELS' : grupSec == '3' ? 'BIST:BIZIM' : grupSec == '4' ? 'BIST:CRDFA' : grupSec == '5' ? 'BIST:EFORC' : grupSec == '6' ? 'BIST:FORTE' : grupSec == '7' ? 'BIST:HOROZ' : grupSec == '8' ? 'BIST:IZINV' : grupSec == '9' ? 'BIST:KRGYO' : grupSec == '10' ? 'BIST:MERCN' : grupSec == '11' ? 'BIST:OTTO' : grupSec == '12' ? 'BIST:QNBTR' : grupSec == '13' ? 'BIST:SNICA' : grupSec == '14' ? 'BIST:TTRAK' : grupSec == '15' ? 'BIST:YONGA' : na
a10 = grupSec == '1' ? 'BIST:AGROT' : grupSec == '2' ? 'BIST:ASGYO' : grupSec == '3' ? 'BIST:BJKAS' : grupSec == '4' ? 'BIST:CRFSA' : grupSec == '5' ? 'BIST:EGEEN' : grupSec == '6' ? 'BIST:FRIGO' : grupSec == '7' ? 'BIST:HRKET' : grupSec == '8' ? 'BIST:IZMDC' : grupSec == '9' ? 'BIST:KRONT' : grupSec == '10' ? 'BIST:MERIT' : grupSec == '11' ? 'BIST:OYAKC' : grupSec == '12' ? 'BIST:QUAGR' : grupSec == '13' ? 'BIST:SNKRN' : grupSec == '14' ? 'BIST:TUCLK' : grupSec == '15' ? 'BIST:YUNSA' : na
a11 = grupSec == '1' ? 'BIST:AGYO' : grupSec == '2' ? 'BIST:ASTOR' : grupSec == '3' ? 'BIST:BLCYT' : grupSec == '4' ? 'BIST:CUSAN' : grupSec == '5' ? 'BIST:EGEPO' : grupSec == '6' ? 'BIST:FROTO' : grupSec == '7' ? 'BIST:HTTBT' : grupSec == '8' ? 'BIST:JANTS' : grupSec == '9' ? 'BIST:KRPLS' : grupSec == '10' ? 'BIST:MERKO' : grupSec == '11' ? 'BIST:OYAYO' : grupSec == '12' ? 'BIST:RALYH' : grupSec == '13' ? 'BIST:SNPAM' : grupSec == '14' ? 'BIST:TUKAS' : grupSec == '15' ? 'BIST:YYAPI' : na
a12 = grupSec == '1' ? 'BIST:AHGAZ' : grupSec == '2' ? 'BIST:ASUZU' : grupSec == '3' ? 'BIST:BMSCH' : grupSec == '4' ? 'BIST:CVKMD' : grupSec == '5' ? 'BIST:EGGUB' : grupSec == '6' ? 'BIST:FZLGY' : grupSec == '7' ? 'BIST:HUBVC' : grupSec == '8' ? 'BIST:KAPLM' : grupSec == '9' ? 'BIST:KRSTL' : grupSec == '10' ? 'BIST:METRO' : grupSec == '11' ? 'BIST:OYLUM' : grupSec == '12' ? 'BIST:RAYSG' : grupSec == '13' ? 'BIST:SODSN' : grupSec == '14' ? 'BIST:TUPRS' : grupSec == '15' ? 'BIST:YYLGD' : na
a13 = grupSec == '1' ? 'BIST:AHSGY' : grupSec == '2' ? 'BIST:ATAGY' : grupSec == '3' ? 'BIST:BMSTL' : grupSec == '4' ? 'BIST:CWENE' : grupSec == '5' ? 'BIST:EGPRO' : grupSec == '6' ? 'BIST:GARAN' : grupSec == '7' ? 'BIST:HUNER' : grupSec == '8' ? 'BIST:KAREL' : grupSec == '9' ? 'BIST:KRTEK' : grupSec == '10' ? 'BIST:METUR' : grupSec == '11' ? 'BIST:OYYAT' : grupSec == '12' ? 'BIST:REEDR' : grupSec == '13' ? 'BIST:SOKE' : grupSec == '14' ? 'BIST:TUREX' : grupSec == '15' ? 'BIST:ZEDUR' : na
a14 = grupSec == '1' ? 'BIST:AKBNK' : grupSec == '2' ? 'BIST:ATAKP' : grupSec == '3' ? 'BIST:BNTAS' : grupSec == '4' ? 'BIST:DAGHL' : grupSec == '5' ? 'BIST:EGSER' : grupSec == '6' ? 'BIST:GARFA' : grupSec == '7' ? 'BIST:HURGZ' : grupSec == '8' ? 'BIST:KARSN' : grupSec == '9' ? 'BIST:KRVGD' : grupSec == '10' ? 'BIST:MGROS' : grupSec == '11' ? 'BIST:OZATD' : grupSec == '12' ? 'BIST:RGYAS' : grupSec == '13' ? 'BIST:SOKM' : grupSec == '14' ? 'BIST:TURGG' : grupSec == '15' ? 'BIST:ZOREN' : na
a15 = grupSec == '1' ? 'BIST:AKCNS' : grupSec == '2' ? 'BIST:ATATP' : grupSec == '3' ? 'BIST:BOBET' : grupSec == '4' ? 'BIST:DAGI' : grupSec == '5' ? 'BIST:EKGYO' : grupSec == '6' ? 'BIST:GEDIK' : grupSec == '7' ? 'BIST:ICBCT' : grupSec == '8' ? 'BIST:KARTN' : grupSec == '9' ? 'BIST:KSTUR' : grupSec == '10' ? 'BIST:MHRGY' : grupSec == '11' ? 'BIST:OZGYO' : grupSec == '12' ? 'BIST:RNPOL' : grupSec == '13' ? 'BIST:SONME' : grupSec == '14' ? 'BIST:TURSG' : grupSec == '15' ? 'BIST:ZRGYO' : na
a16 = grupSec == '1' ? 'BIST:AKENR' : grupSec == '2' ? 'BIST:ATEKS' : grupSec == '3' ? 'BIST:BORLS' : grupSec == '4' ? 'BIST:DAPGM' : grupSec == '5' ? 'BIST:EKIZ' : grupSec == '6' ? 'BIST:GEDZA' : grupSec == '7' ? 'BIST:ICUGS' : grupSec == '8' ? 'BIST:KARYE' : grupSec == '9' ? 'BIST:KTLEV' : grupSec == '10' ? 'BIST:MIATK' : grupSec == '11' ? 'BIST:OZKGY' : grupSec == '12' ? 'BIST:RODRG' : grupSec == '13' ? 'BIST:SRVGY' : grupSec == '14' ? 'BIST:UFUK' : grupSec == '15' ? 'BIST:AKFIS' :na
a17 = grupSec == '1' ? 'BIST:AKFGY' : grupSec == '2' ? 'BIST:ATLAS' : grupSec == '3' ? 'BIST:BORSK' : grupSec == '4' ? 'BIST:DARDL' : grupSec == '5' ? 'BIST:EKOS' : grupSec == '6' ? 'BIST:GENIL' : grupSec == '7' ? 'BIST:IDGYO' : grupSec == '8' ? 'BIST:KATMR' : grupSec == '9' ? 'BIST:KTSKR' : grupSec == '10' ? 'BIST:MMCAS' : grupSec == '11' ? 'BIST:OZRDN' : grupSec == '12' ? 'BIST:ROYAL' : grupSec == '13' ? 'BIST:SUMAS' : grupSec == '14' ? 'BIST:ULAS' : grupSec == '15' ? 'BIST:ARMGD': na
a18 = grupSec == '1' ? 'BIST:AKFYE' : grupSec == '2' ? 'BIST:ATSYH' : grupSec == '3' ? 'BIST:BOSSA' : grupSec == '4' ? 'BIST:DCTTR' : grupSec == '5' ? 'BIST:EKSUN' : grupSec == '6' ? 'BIST:GENTS' : grupSec == '7' ? 'BIST:IEYHO' : grupSec == '8' ? 'BIST:KAYSE' : grupSec == '9' ? 'BIST:KUTPO' : grupSec == '10' ? 'BIST:MNDRS' : grupSec == '11' ? 'BIST:OZSUB' : grupSec == '12' ? 'BIST:RTALB' : grupSec == '13' ? 'BIST:SUNTK' : grupSec == '14' ? 'BIST:ULKER' : grupSec == '15' ? 'BIST:BALSU': na
a19 = grupSec == '1' ? 'BIST:AKGRT' : grupSec == '2' ? 'BIST:AVGYO' : grupSec == '3' ? 'BIST:BRISA' : grupSec == '4' ? 'BIST:DENGE' : grupSec == '5' ? 'BIST:ELITE' : grupSec == '6' ? 'BIST:GEREL' : grupSec == '7' ? 'BIST:IHAAS' : grupSec == '8' ? 'BIST:KBORU' : grupSec == '9' ? 'BIST:KUVVA' : grupSec == '10' ? 'BIST:MNDTR' : grupSec == '11' ? 'BIST:OZYSR' : grupSec == '12' ? 'BIST:RUBNS' : grupSec == '13' ? 'BIST:SURGY' : grupSec == '14' ? 'BIST:ULUFA' : grupSec == '15' ? 'BIST:BESLR':na
a20 = grupSec == '1' ? 'BIST:AKMGY' : grupSec == '2' ? 'BIST:AVHOL' : grupSec == '3' ? 'BIST:BRKO' : grupSec == '4' ? 'BIST:DERHL' : grupSec == '5' ? 'BIST:EMKEL' : grupSec == '6' ? 'BIST:GESAN' : grupSec == '7' ? 'BIST:IHEVA' : grupSec == '8' ? 'BIST:KCAER' : grupSec == '9' ? 'BIST:KUYAS' : grupSec == '10' ? 'BIST:MOBTL' : grupSec == '11' ? 'BIST:PAGYO' : grupSec == '12' ? 'BIST:RYGYO' : grupSec == '13' ? 'BIST:SUWEN' : grupSec == '14' ? 'BIST:ULUSE' : grupSec == '15' ? 'BIST:DSTKF': na
a21 = grupSec == '1' ? 'BIST:AKSA' : grupSec == '2' ? 'BIST:AVOD' : grupSec == '3' ? 'BIST:BRKSN' : grupSec == '4' ? 'BIST:DERIM' : grupSec == '5' ? 'BIST:EMNIS' : grupSec == '6' ? 'BIST:GIPTA' : grupSec == '7' ? 'BIST:IHGZT' : grupSec == '8' ? 'BIST:KCHOL' : grupSec == '9' ? 'BIST:KZBGY' : grupSec == '10' ? 'BIST:MOGAN' : grupSec == '11' ? 'BIST:PAMEL' : grupSec == '12' ? 'BIST:RYSAS' : grupSec == '13' ? 'BIST:TABGD' : grupSec == '14' ? 'BIST:ULUUN' : grupSec == '15' ? 'BIST:GLRMK': na
a22 = grupSec == '1' ? 'BIST:AKSEN' : grupSec == '2' ? 'BIST:AVPGY' : grupSec == '3' ? 'BIST:BRKVY' : grupSec == '4' ? 'BIST:DESA' : grupSec == '5' ? 'BIST:ENERY' : grupSec == '6' ? 'BIST:GLBMD' : grupSec == '7' ? 'BIST:IHLAS' : grupSec == '8' ? 'BIST:KENT' : grupSec == '9' ? 'BIST:KZGYO' : grupSec == '10' ? 'BIST:MPARK' : grupSec == '11' ? 'BIST:PAPIL' : grupSec == '12' ? 'BIST:SAFKR' : grupSec == '13' ? 'BIST:TARKM' : grupSec == '14' ? 'BIST:UMPAS' : grupSec == '15' ? 'BIST:KLYPV': na
a23 = grupSec == '1' ? 'BIST:AKSGY' : grupSec == '2' ? 'BIST:AVTUR' : grupSec == '3' ? 'BIST:BRLSM' : grupSec == '4' ? 'BIST:DESPC' : grupSec == '5' ? 'BIST:ENJSA' : grupSec == '6' ? 'BIST:GLCVY' : grupSec == '7' ? 'BIST:IHLGM' : grupSec == '8' ? 'BIST:KERVN' : grupSec == '9' ? 'BIST:LIDER' : grupSec == '10' ? 'BIST:MRGYO' : grupSec == '11' ? 'BIST:PARSN' : grupSec == '12' ? 'BIST:SAHOL' : grupSec == '13' ? 'BIST:TATEN' : grupSec == '14' ? 'BIST:UNLU' :grupSec == '15' ? 'BIST:MOPAS': na
a24 = grupSec == '1' ? 'BIST:AKSUE' : grupSec == '2' ? 'BIST:AYCES' : grupSec == '3' ? 'BIST:BRMEN' : grupSec == '4' ? 'BIST:DEVA' : grupSec == '5' ? 'BIST:ENKAI' : grupSec == '6' ? 'BIST:GLRYH' : grupSec == '7' ? 'BIST:IHYAY' : grupSec == '8' ? 'BIST:LIDFA' : grupSec == '10' ? 'BIST:MRSHL' : grupSec == '11' ? 'BIST:PASEU' : grupSec == '12' ? 'BIST:SAMAT' : grupSec == '13' ? 'BIST:TATGD' : grupSec == '14' ? 'BIST:USAK' : grupSec == '15' ? 'BIST:A1YEN': na
a25 = grupSec == '1' ? 'BIST:AKYHO' : grupSec == '2' ? 'BIST:AYDEM' : grupSec == '3' ? 'BIST:BRSAN' : grupSec == '4' ? 'BIST:DGATE' : grupSec == '5' ? 'BIST:ENSRI' : grupSec == '6' ? 'BIST:GLYHO' : grupSec == '7' ? 'BIST:IMASM' : grupSec == '8' ? 'BIST:KFEIN' : grupSec == '9' ? 'BIST:LILAK' : grupSec == '10' ? 'BIST:MSGYO' : grupSec == '11' ? 'BIST:PATEK' : grupSec == '12' ? 'BIST:SANEL' : grupSec == '13' ? 'BIST:TAVHL' : grupSec == '14' ? 'BIST:VAKBN' : grupSec == '15' ? 'BIST:BIGEN': na
a26 = grupSec == '1' ? 'BIST:ALARK' : grupSec == '2' ? 'BIST:AYEN' : grupSec == '3' ? 'BIST:BRYAT' : grupSec == '4' ? 'BIST:DGGYO' : grupSec == '5' ? 'BIST:ENTRA' : grupSec == '6' ? 'BIST:GMTAS' : grupSec == '7' ? 'BIST:INDES' : grupSec == '8' ? 'BIST:KGYO' : grupSec == '9' ? 'BIST:LINK' : grupSec == '10' ? 'BIST:MTRKS' : grupSec == '11' ? 'BIST:PCILT' : grupSec == '12' ? 'BIST:SANFM' : grupSec == '13' ? 'BIST:TBORG' : grupSec == '14' ? 'BIST:VAKFN' : grupSec == '15' ? 'BIST:BULGS': na
a27 = grupSec == '1' ? 'BIST:ALBRK' : grupSec == '2' ? 'BIST:AYES' : grupSec == '3' ? 'BIST:BSOKE' : grupSec == '4' ? 'BIST:DGNMO' : grupSec == '5' ? 'BIST:EPLAS' : grupSec == '6' ? 'BIST:GOKNR' : grupSec == '7' ? 'BIST:INFO' : grupSec == '8' ? 'BIST:KIMMR' : grupSec == '9' ? 'BIST:LKMNH' : grupSec == '10' ? 'BIST:MTRYO' : grupSec == '11' ? 'BIST:PEHOL' : grupSec == '12' ? 'BIST:SANKO' : grupSec == '13' ? 'BIST:TCELL' : grupSec == '14' ? 'BIST:VAKKO' : grupSec == '15' ? 'BIST:CGCAM': na
a28 = grupSec == '1' ? 'BIST:ALCAR' : grupSec == '2' ? 'BIST:AYGAZ' : grupSec == '3' ? 'BIST:BTCIM' : grupSec == '4' ? 'BIST:DIRIT' : grupSec == '5' ? 'BIST:ERBOS' : grupSec == '6' ? 'BIST:GOLTS' : grupSec == '7' ? 'BIST:INGRM' : grupSec == '8' ? 'BIST:KLGYO' : grupSec == '9' ? 'BIST:LMKDC' : grupSec == '10' ? 'BIST:MZHLD' : grupSec == '11' ? 'BIST:PEKGY' : grupSec == '12' ? 'BIST:SARKY' : grupSec == '13' ? 'BIST:TCKRC' : grupSec == '14' ? 'BIST:VANGD' : grupSec == '15' ? 'BIST:EGEGY': na
a29 = grupSec == '1' ? 'BIST:ALCTL' : grupSec == '2' ? 'BIST:AZTEK' : grupSec == '3' ? 'BIST:BUCIM' : grupSec == '4' ? 'BIST:DITAS' : grupSec == '5' ? 'BIST:ERCB' : grupSec == '6' ? 'BIST:GOODY' : grupSec == '7' ? 'BIST:INTEK' : grupSec == '8' ? 'BIST:KLKIM' : grupSec == '9' ? 'BIST:LOGO' : grupSec == '10' ? 'BIST:NATEN' : grupSec == '11' ? 'BIST:PENGD' : grupSec == '12' ? 'BIST:SASA' : grupSec == '13' ? 'BIST:TDGYO' : grupSec == '14' ? 'BIST:VBTYZ' : grupSec == '15' ? 'BIST:ENDAE':na
a30 = grupSec == '1' ? 'BIST:ALFAS' : grupSec == '2' ? 'BIST:BAGFS' : grupSec == '3' ? 'BIST:BURCE' : grupSec == '4' ? 'BIST:DMRGD' : grupSec == '5' ? 'BIST:EREGL' : grupSec == '6' ? 'BIST:GOZDE' : grupSec == '7' ? 'BIST:INTEM' : grupSec == '8' ? 'BIST:KLMSN' : grupSec == '9' ? 'BIST:LRSHO' : grupSec == '10' ? 'BIST:NETAS' : grupSec == '11' ? 'BIST:PENTA' : grupSec == '12' ? 'BIST:SAYAS' : grupSec == '13' ? 'BIST:TEKTU' : grupSec == '14' ? 'BIST:VERTU' : grupSec == '15' ? 'BIST:RUZYE': na
a31 = grupSec == '1' ? 'BIST:ALGYO' : grupSec == '2' ? 'BIST:BAHKM' : grupSec == '3' ? 'BIST:BURVA' : grupSec == '4' ? 'BIST:DMSAS' : grupSec == '5' ? 'BIST:ERSU' : grupSec == '6' ? 'BIST:GRNYO' : grupSec == '7' ? 'BIST:INVEO' : grupSec == '8' ? 'BIST:KLNMA' : grupSec == '9' ? 'BIST:LUKSK' : grupSec == '10' ? 'BIST:NIBAS' : grupSec == '11' ? 'BIST:PETKM' : grupSec == '12' ? 'BIST:SDTTR' : grupSec == '13' ? 'BIST:TERA' : grupSec == '14' ? 'BIST:VERUS' : grupSec == '15' ? 'BIST:SERNT': na
a32 = grupSec == '1' ? 'BIST:ALKA' : grupSec == '2' ? 'BIST:BAKAB' : grupSec == '3' ? 'BIST:BVSAN' : grupSec == '4' ? 'BIST:DNISI' : grupSec == '5' ? 'BIST:ESCAR' : grupSec == '6' ? 'BIST:GRSEL' : grupSec == '7' ? 'BIST:INVES' : grupSec == '8' ? 'BIST:KLRHO' : grupSec == '9' ? 'BIST:LYDHO' : grupSec == '10' ? 'BIST:NTGAZ' : grupSec == '11' ? 'BIST:PETUN' : grupSec == '12' ? 'BIST:SEGMN' : grupSec == '13' ? 'BIST:TEZOL' : grupSec == '14' ? 'BIST:VESBE' : grupSec == '15' ? 'BIST:SMRVA':na
a33 = grupSec == '1' ? 'BIST:ALKIM' : grupSec == '2' ? 'BIST:BALAT' : grupSec == '3' ? 'BIST:BYDNR' : grupSec == '4' ? 'BIST:DOAS' : grupSec == '5' ? 'BIST:ESCOM' : grupSec == '6' ? 'BIST:GRTHO' : grupSec == '7' ? 'BIST:IPEKE' : grupSec == '8' ? 'BIST:KLSER' : grupSec == '9' ? 'BIST:LYDYE' : grupSec == '10' ? 'BIST:NTHOL' : grupSec == '11' ? 'BIST:PGSUS' : grupSec == '12' ? 'BIST:SEGYO' : grupSec == '13' ? 'BIST:TGSAS' : grupSec == '14' ? 'BIST:VESTL' : grupSec == '15' ? 'BIST:VSNMD':na
a34 = grupSec == '1' ? 'BIST:ALKLC' : grupSec == '2' ? 'BIST:BANVT' : grupSec == '3' ? 'BIST:CANTE' : grupSec == '4' ? 'BIST:DOBUR' : grupSec == '5' ? 'BIST:ESEN' : grupSec == '6' ? 'BIST:GSDDE' : grupSec == '7' ? 'BIST:ISATR' : grupSec == '8' ? 'BIST:KLSYN' : grupSec == '9' ? 'BIST:MAALT' : grupSec == '10' ? 'BIST:NUGYO' : grupSec == '11' ? 'BIST:PINSU' : grupSec == '12' ? 'BIST:SEKFK' : grupSec == '13' ? 'BIST:THYAO' : grupSec == '14' ? 'BIST:VKFYO' : na
a35 = grupSec == '1' ? 'BIST:ALMAD' : grupSec == '2' ? 'BIST:BARMA' : grupSec == '3' ? 'BIST:CASA' : grupSec == '4' ? 'BIST:DOCO' : grupSec == '5' ? 'BIST:ETILR' : grupSec == '6' ? 'BIST:GSDHO' : grupSec == '7' ? 'BIST:ISBIR' : grupSec == '8' ? 'BIST:KMPUR' : grupSec == '9' ? 'BIST:MACKO' : grupSec == '10' ? 'BIST:NUHCM' : grupSec == '11' ? 'BIST:PKART' : grupSec == '12' ? 'BIST:SEKUR' : grupSec == '13' ? 'BIST:TKFEN' : grupSec == '14' ? 'BIST:VKGYO' : na
a36 = grupSec == '1' ? 'BIST:ALTNY' : grupSec == '2' ? 'BIST:BASCM' : grupSec == '3' ? 'BIST:CATES' : grupSec == '4' ? 'BIST:DOFER' : grupSec == '5' ? 'BIST:ETYAT' : grupSec == '6' ? 'BIST:GSRAY' : grupSec == '7' ? 'BIST:ISBTR' : grupSec == '8' ? 'BIST:KNFRT' : grupSec == '9' ? 'BIST:MAGEN' : grupSec == '10' ? 'BIST:OBAMS' : grupSec == '11' ? 'BIST:PKENT' : grupSec == '12' ? 'BIST:SELEC' : grupSec == '13' ? 'BIST:TKNSA' : grupSec == '14' ? 'BIST:VKING' : na
a37 = grupSec == '1' ? 'BIST:ALVES' : grupSec == '2' ? 'BIST:BASGZ' : grupSec == '3' ? 'BIST:CCOLA' : grupSec == '4' ? 'BIST:DOGUB' : grupSec == '5' ? 'BIST:EUHOL' : grupSec == '6' ? 'BIST:GUBRF' : grupSec == '7' ? 'BIST:ISCTR' : grupSec == '8' ? 'BIST:KOCMT' : grupSec == '9' ? 'BIST:MAKIM' : grupSec == '10' ? 'BIST:OBASE' : grupSec == '11' ? 'BIST:PLTUR' : grupSec == '12' ? 'BIST:SELGD' : grupSec == '13' ? 'BIST:TLMAN' : grupSec == '14' ? 'BIST:VRGYO' : na
a38 = grupSec == '1' ? 'BIST:ANELE' : grupSec == '2' ? 'BIST:BAYRK' : grupSec == '3' ? 'BIST:CELHA' : grupSec == '4' ? 'BIST:DOHOL' : grupSec == '5' ? 'BIST:EUKYO' : grupSec == '6' ? 'BIST:GUNDG' : grupSec == '7' ? 'BIST:ISDMR' : grupSec == '8' ? 'BIST:KONKA' : grupSec == '9' ? 'BIST:MAKTK' : grupSec == '10' ? 'BIST:ODAS' : grupSec == '11' ? 'BIST:PNLSN' : grupSec == '12' ? 'BIST:SELVA' : grupSec == '13' ? 'BIST:TMPOL' : grupSec == '14' ? 'BIST:YAPRK' : na
a39 = grupSec == '1' ? 'BIST:ANGEN' : grupSec == '2' ? 'BIST:BEGYO' : grupSec == '3' ? 'BIST:CEMAS' : grupSec == '4' ? 'BIST:DOKTA' : grupSec == '5' ? 'BIST:EUPWR' : grupSec == '6' ? 'BIST:GWIND' : grupSec == '7' ? 'BIST:ISFIN' : grupSec == '8' ? 'BIST:KONTR' : grupSec == '9' ? 'BIST:MANAS' : grupSec == '10' ? 'BIST:ODINE' : grupSec == '11' ? 'BIST:PNSUT' : grupSec == '12' ? 'BIST:SEYKM' : grupSec == '13' ? 'BIST:TMSN' : grupSec == '14' ? 'BIST:YATAS' : na
a40 = grupSec == '1' ? 'BIST:ANHYT' : grupSec == '2' ? 'BIST:BERA' : grupSec == '3' ? 'BIST:CEMTS' : grupSec == '4' ? 'BIST:DURDO' : grupSec == '5' ? 'BIST:EUREN' : grupSec == '6' ? 'BIST:GZNMI' : grupSec == '7' ? 'BIST:ISGSY' : grupSec == '8' ? 'BIST:KONYA' : grupSec == '9' ? 'BIST:MARBL' : grupSec == '10' ? 'BIST:OFSYM' : grupSec == '11' ? 'BIST:POLHO' : grupSec == '12' ? 'BIST:SILVR' : grupSec == '13' ? 'BIST:TNZTP' : grupSec == '14' ? 'BIST:YAYLA' : na
= request.security(a01, per, func())
= request.security(a02, per, func())
= request.security(a03, per, func())
= request.security(a04, per, func())
= request.security(a05, per, func())
= request.security(a06, per, func())
= request.security(a07, per, func())
= request.security(a08, per, func())
= request.security(a09, per, func())
= request.security(a10, per, func())
= request.security(a11, per, func())
= request.security(a12, per, func())
= request.security(a13, per, func())
= request.security(a14, per, func())
= request.security(a15, per, func())
= request.security(a16, per, func())
= request.security(a17, per, func())
= request.security(a18, per, func())
= request.security(a19, per, func())
= request.security(a20, per, func())
= request.security(a21, per, func())
= request.security(a22, per, func())
= request.security(a23, per, func())
= request.security(a24, per, func())
= request.security(a25, per, func())
= request.security(a26, per, func())
= request.security(a27, per, func())
= request.security(a28, per, func())
= request.security(a29, per, func())
= request.security(a30, per, func())
= request.security(a31, per, func())
= request.security(a32, per, func())
= request.security(a33, per, func())
= request.security(a34, per, func())
= request.security(a35, per, func())
= request.security(a36, per, func())
= request.security(a37, per, func())
= request.security(a38, per, func())
= request.security(a39, per, func())
= request.security(a40, per, func())
roundn(x, n) =>
mult = 1
if n != 0
for i = 1 to math.abs(n) by 1
mult *= 10
mult
n >= 0 ? math.round(x * mult) / mult : math.round(x / mult) * mult
scr_label = 'TARAMA\n'
scr_label := s1 ? scr_label + syminfo.ticker(a01) + ' ' + str.tostring(roundn(v1, 2)) + '\n' : scr_label
scr_label := s2 ? scr_label + syminfo.ticker(a02) + ' ' + str.tostring(roundn(v2, 2)) + '\n' : scr_label
scr_label := s3 ? scr_label + syminfo.ticker(a03) + ' ' + str.tostring(roundn(v3, 2)) + '\n' : scr_label
scr_label := s4 ? scr_label + syminfo.ticker(a04) + ' ' + str.tostring(roundn(v4, 2)) + '\n' : scr_label
scr_label := s5 ? scr_label + syminfo.ticker(a05) + ' ' + str.tostring(roundn(v5, 2)) + '\n' : scr_label
scr_label := s6 ? scr_label + syminfo.ticker(a06) + ' ' + str.tostring(roundn(v6, 2)) + '\n' : scr_label
scr_label := s7 ? scr_label + syminfo.ticker(a07) + ' ' + str.tostring(roundn(v7, 2)) + '\n' : scr_label
scr_label := s8 ? scr_label + syminfo.ticker(a08) + ' ' + str.tostring(roundn(v8, 2)) + '\n' : scr_label
scr_label := s9 ? scr_label + syminfo.ticker(a09) + ' ' + str.tostring(roundn(v9, 2)) + '\n' : scr_label
scr_label := s10 ? scr_label + syminfo.ticker(a10) + ' ' + str.tostring(roundn(v10, 2)) + '\n' : scr_label
scr_label := s11 ? scr_label + syminfo.ticker(a11) + ' ' + str.tostring(roundn(v11, 2)) + '\n' : scr_label
scr_label := s12 ? scr_label + syminfo.ticker(a12) + ' ' + str.tostring(roundn(v12, 2)) + '\n' : scr_label
scr_label := s13 ? scr_label + syminfo.ticker(a13) + ' ' + str.tostring(roundn(v13, 2)) + '\n' : scr_label
scr_label := s14 ? scr_label + syminfo.ticker(a14) + ' ' + str.tostring(roundn(v14, 2)) + '\n' : scr_label
scr_label := s15 ? scr_label + syminfo.ticker(a15) + ' ' + str.tostring(roundn(v15, 2)) + '\n' : scr_label
scr_label := s16 ? scr_label + syminfo.ticker(a16) + ' ' + str.tostring(roundn(v16, 2)) + '\n' : scr_label
scr_label := s17 ? scr_label + syminfo.ticker(a17) + ' ' + str.tostring(roundn(v17, 2)) + '\n' : scr_label
scr_label := s18 ? scr_label + syminfo.ticker(a18) + ' ' + str.tostring(roundn(v18, 2)) + '\n' : scr_label
scr_label := s19 ? scr_label + syminfo.ticker(a19) + ' ' + str.tostring(roundn(v19, 2)) + '\n' : scr_label
scr_label := s20 ? scr_label + syminfo.ticker(a20) + ' ' + str.tostring(roundn(v20, 2)) + '\n' : scr_label
scr_label := s21 ? scr_label + syminfo.ticker(a21) + ' ' + str.tostring(roundn(v21, 2)) + '\n' : scr_label
scr_label := s22 ? scr_label + syminfo.ticker(a22) + ' ' + str.tostring(roundn(v22, 2)) + '\n' : scr_label
scr_label := s23 ? scr_label + syminfo.ticker(a23) + ' ' + str.tostring(roundn(v23, 2)) + '\n' : scr_label
scr_label := s24 ? scr_label + syminfo.ticker(a24) + ' ' + str.tostring(roundn(v24, 2)) + '\n' : scr_label
scr_label := s25 ? scr_label + syminfo.ticker(a25) + ' ' + str.tostring(roundn(v25, 2)) + '\n' : scr_label
scr_label := s26 ? scr_label + syminfo.ticker(a26) + ' ' + str.tostring(roundn(v26, 2)) + '\n' : scr_label
scr_label := s27 ? scr_label + syminfo.ticker(a27) + ' ' + str.tostring(roundn(v27, 2)) + '\n' : scr_label
scr_label := s28 ? scr_label + syminfo.ticker(a28) + ' ' + str.tostring(roundn(v28, 2)) + '\n' : scr_label
scr_label := s29 ? scr_label + syminfo.ticker(a29) + ' ' + str.tostring(roundn(v29, 2)) + '\n' : scr_label
scr_label := s30 ? scr_label + syminfo.ticker(a30) + ' ' + str.tostring(roundn(v30, 2)) + '\n' : scr_label
scr_label := s31 ? scr_label + syminfo.ticker(a31) + ' ' + str.tostring(roundn(v31, 2)) + '\n' : scr_label
scr_label := s32 ? scr_label + syminfo.ticker(a32) + ' ' + str.tostring(roundn(v32, 2)) + '\n' : scr_label
scr_label := s33 ? scr_label + syminfo.ticker(a33) + ' ' + str.tostring(roundn(v33, 2)) + '\n' : scr_label
scr_label := s34 ? scr_label + syminfo.ticker(a34) + ' ' + str.tostring(roundn(v34, 2)) + '\n' : scr_label
scr_label := s35 ? scr_label + syminfo.ticker(a35) + ' ' + str.tostring(roundn(v35, 2)) + '\n' : scr_label
scr_label := s36 ? scr_label + syminfo.ticker(a36) + ' ' + str.tostring(roundn(v36, 2)) + '\n' : scr_label
scr_label := s37 ? scr_label + syminfo.ticker(a37) + ' ' + str.tostring(roundn(v37, 2)) + '\n' : scr_label
scr_label := s38 ? scr_label + syminfo.ticker(a38) + ' ' + str.tostring(roundn(v38, 2)) + '\n' : scr_label
scr_label := s39 ? scr_label + syminfo.ticker(a39) + ' ' + str.tostring(roundn(v39, 2)) + '\n' : scr_label
scr_label := s40 ? scr_label + syminfo.ticker(a40) + ' ' + str.tostring(roundn(v40, 2)) + '\n' : scr_label
var panel =table.new(position = position.top_right,columns = 10,rows=10,bgcolor = color.green,frame_color = color.black,border_color = color.red)
//lab_1 = label.new(bar_index + loc,50, scr_label, color=color.green, textcolor=color.white, style=label.style_label_center)
//label.delete(lab_1 )
if barstate.islast
table.cell(panel,0,0,text = str.tostring(scr_label))
if str.length(scr_label) > 8
alert(scr_label,alert.freq_once_per_bar_close)
//------------------------------------------------------

SAPSAN TRADE: Regression ChannelSAPSAN TRADE: Regression Channel
The SAPSAN TRADE: Regression Channel indicator provides traders with a powerful visual tool to identify trends, deviations, and potential reversal zones using linear regression analysis.
Key Features:
Custom Time Range: Set the start and end time to focus the regression calculation on a specific portion of the chart.
Regression Line: Automatically calculates and plots the best-fit linear regression line based on closing prices.
± StdDev Levels: Shows upper and lower standard deviation levels, giving insight into price volatility and potential support/resistance zones.
Styled Parameters Table: Displays slope (a), intercept (b), and standard deviation in a clear, color-coded table on the chart.
Benefits:
Quickly identify the dominant trend over a selected time range.
Easily spot overextended price movements beyond ± StdDev levels.
Track regression parameters visually with the table for quick decision-making.
Fully customizable colors and line width for optimal readability on any chart.
How to Use:
Set the desired time range for the regression calculation.
Enable or disable the regression line and StdDev levels according to your preference.
Observe the slope and intercept values in the table to understand trend strength and direction.
Use the ± StdDev levels as dynamic zones for potential entries or exits.
Ideal for:
Traders who want a clear visual representation of trend direction, price deviations, and statistical analysis directly on the chart. Perfect for forex, crypto, stocks, and other markets where trend and volatility analysis is essential.

AlphaADX Trend Meter - Enhanced ADX VisualizationTechnical Overview
This indicator enhances the traditional Average Directional Index (ADX) with advanced visualization techniques and adaptive threshold management. It demonstrates several Pine Script programming concepts including dynamic color gradients, conditional plotting, and real-time information display systems.
Mathematical Methodology
Core ADX Calculation
Uses standard DMI (Directional Movement Index) calculation: ta.dmi(diLength, adxSmoothing)
Applies configurable smoothing to reduce noise while preserving trend signals
Maintains mathematical integrity of Welles Wilder's original ADX formula
Dynamic Color System
Gradient Implementation:
pinecolor.from_gradient(adxValue, minThreshold, maxThreshold, startColor, endColor)
Color Logic:
Strong trends (ADX > 25): Bright colors (green for bullish, red for bearish)
Weak trends (15 < ADX ≤ 25): Muted colors with transparency
Choppy markets (ADX ≤ 15): Gray coloring to indicate low directional movement
Gradient mode creates smooth color transitions based on ADX intensity
Adaptive Threshold Framework
While maintaining standard ADX interpretation levels, the indicator allows customization of:
Strong trend threshold (default: 25)
Weak trend threshold (default: 20)
Chop zone threshold (default: 15)
This flexibility accommodates different market conditions and trading styles.
Technical Features
1. Multi-Layer Visualization
Primary ADX Line: Color-coded based on strength and direction
Histogram Display: Shows ADX momentum with transparency effects
Trend Meter Bar: Simplified visual reference at bottom of chart
Background Zones: Subtle shading for strong trends and chop zones
2. Signal Generation
Automatic Detection:
Strong trend emergence (ADX crosses above strong threshold)
Chop zone entry warnings (ADX falls below chop threshold)
Trend direction changes in strong trending markets
Visual Markers:
Triangle arrows for strong trend signals
Cross markers for chop zone warnings
Color-coded based on bullish/bearish bias
3. Information Dashboard
Real-time table displaying:
Current ADX value with dynamic background coloring
Trend status classification (Strong/Weak/Neutral/Choppy)
Directional bias (Bullish ↑/Bearish ↓)
DI+ and DI- values for detailed analysis
4. Alert System
Programmatic alerts for:
Strong trend emergence
Entry into consolidation zones
Trend reversals during strong directional moves
Breakouts from choppy conditions
Programming Techniques Demonstrated
Advanced Pine Script Concepts:
Dynamic Color Functions: Custom color selection based on multiple conditions
Conditional Plotting: Different visual elements based on user preferences
Table Implementation: Real-time information display with formatting
Alert Integration: Multiple condition monitoring system
Input Validation: Parameter bounds and logical constraints
Visual Enhancement Methods:
Gradient color transitions for smooth visual feedback
Transparency effects to reduce visual clutter
Multi-component display system for comprehensive analysis
Customizable visual elements for user preference accommodation
Educational Value
This indicator serves as a learning tool for:
Enhanced ADX Implementation: Shows how to extend built-in indicators with additional functionality
Visual Design Principles: Demonstrates effective use of colors, transparency, and layout
User Interface Development: Table creation and information display techniques
Alert System Design: Comprehensive condition monitoring and notification
Configuration Options
ADX Parameters:
ADX Length: Period for directional movement calculation
DI Length: Directional indicator smoothing period
ADX Smoothing: Additional smoothing for noise reduction
Threshold Levels:
Strong Trend Level: Threshold for identifying strong directional movement
Weak Trend Level: Moderate trend identification threshold
Chop Zone Level: Low directional movement threshold
Visual Controls:
Trend Meter: Toggle bottom reference bar
Histogram: Show/hide ADX momentum bars
Signal Arrows: Enable/disable trend change markers
Info Table: Display/hide real-time information panel
Gradient Mode: Switch between smooth gradients and solid colors
Use Cases and Applications
Market Analysis:
Trend Identification: Determine current market directional strength
Regime Classification: Distinguish between trending and ranging markets
Timing Analysis: Identify optimal periods for trend-following strategies
Risk Management:
Environment Assessment: Avoid trading during low-ADX choppy periods
Position Sizing: Adjust trade size based on trend strength
Strategy Selection: Choose appropriate techniques based on market regime
Educational Purposes:
ADX Understanding: Visual representation of directional movement concepts
Pine Script Learning: Example of advanced indicator development techniques
Market Behavior: Observation of trend strength patterns across different timeframes
Limitations and Considerations
Technical Limitations:
ADX is a lagging indicator that confirms existing trends rather than predicting them
Requires sufficient price movement data for meaningful calculations
May generate false signals in very low volatility environments
Threshold levels may need adjustment for different asset classes
Usage Guidelines:
Most effective when combined with other forms of technical analysis
Consider market context and fundamental factors
Use appropriate timeframes for intended trading approach
Regular parameter review for optimal performance
Performance Notes:
Calculations optimized for real-time analysis
Visual elements designed to minimize chart clutter
Alert system prevents excessive notifications through condition filtering
Disclaimer
This indicator is designed for educational and analytical purposes. It demonstrates enhanced visualization of the ADX indicator and various Pine Script programming techniques. Users should understand that past performance does not guarantee future results and should always employ proper risk management practices. The indicator should be used as part of a comprehensive trading approach rather than as a standalone decision-making tool.
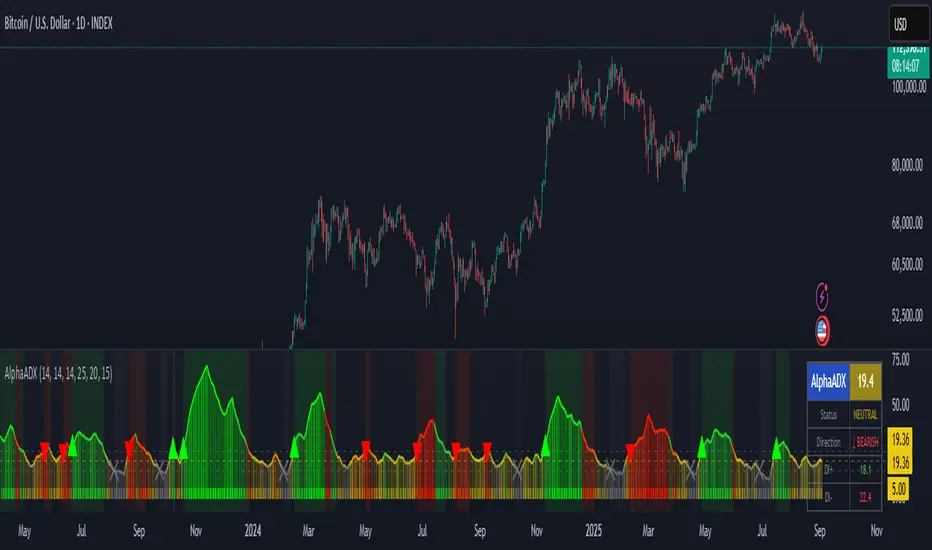
MTF MidpointsOverview :
The MTF Midpoints indicator provides comprehensive multi-timeframe analysis by displaying mid points that act as support / resistance. It also comes with the ability to view trend strength across multiple timeframes.
Key Features :
1) Multi-Timeframe Support -
- 1 Minute, 5 Minute, 15 Minute, 1 Hour, and 4 Hour timeframes.
- Each timeframe displays its calculated midpoint level.
- Toggle individual timeframes on/off as needed.
2) Dynamic Trend Calculation
- Calculates trend direction based on configurable lookback period (default: 30 bars).
- Identifies swing highs and lows to determine trend changes.
- Computes midpoint levels as the average between current swing high and low.
- Tracks price action relative to midpoint to gauge trend strength.
3) Visual Elements -
- Colored Lines : Each timeframe displays as a distinct colored line.
- Fill Areas : Main timeframe shows colored fills above and below midpoint.
- Info Table : Real-time summary of all timeframe data with trend percentages.
4) Customization Options -
- Colors : Individual color settings for each timeframe.
- Display : Adjustable line width, label sizes, and positioning.
- Labels : Toggle price display in labels, customize text color and size.
- Info Table: Configurable info table with trend strength indicators.
How It Works :-
The indicator uses a proprietary algorithm that:
1. Monitors price action over a specified lookback period.
2. Identifies trend direction changes based on new highs/lows.
3. Calculates dynamic support/resistance levels (midpoints).
4. Tracks closes above/below midpoint to determine trend bias.
5. Displays trend strength as a percentage in both table and candle colors.
Trading Applications :-
- Confluence Analysis : Identify where multiple timeframe midpoints align.
- Support/Resistance : Use midpoints as dynamic S/R levels.
- Trend Assessment : Gauge trend strength across different timeframes.
- Entry/Exit Points : Look for price reactions at key midpoint levels.
- Risk Management : Use midpoints to set stop losses and profit targets.
Disclaimer :
This indicator is for educational and analysis purposes. It does not constitute financial advice. Always conduct your own research and consider your risk tolerance before making trading decisions. Past performance does not guarantee future results.

Yelober - Market Internal direction+ Key levelsYelober – Market Internals + Key Levels is a focused intraday trading tool that helps you spot high-probability price direction by anchoring decisions to structure that matters: yesterday’s RTH High/Low, today’s pre-market High/Low, and a fast Value Area/POC from the prior session. Paired with a compact market internals dashboard (NYSE/NASDAQ UVOL vs. DVOL ratios, VOLD slopes, TICK/TICKQ momentum, and optional VIX trend), it gives you a real-time read on breadth so you can choose which direction to trade, when to enter (breaks, retests, or fades at PMH/PML/VAH/VAL/POC), and how to plan exits as internals confirm or deteriorate. On top of these intraday decision benefits, it also allows traders—in a very subtle but powerful way—to keep an eye on the VIX and immediately recognize significant spikes or sharp decreases that should be factored in before entering a trade, or used as a quick signal to modify an existing position. In short: clear levels for the chart, live internals for the context, and a smarter, rules-based path to execution.
# Yelober – Market Internals + Key Levels
*A TradingView indicator for session key levels + real‑time market internals (NYSE/NASDAQ TICK, UVOL/DVOL/VOLD, and VIX).*
**Script name in Pine:** `Yelober - Market Internal direction+ Key levels` (Pine v6)
---
## 1) What this indicator does
**Purpose:** Help intraday traders quickly find high‑probability reaction zones and read market internals momentum without switching charts. It overlays yesterday/today’s **automatic price levels** on your active chart and shows a **market breadth table** that summarizes NYSE/NASDAQ buying pressure and TICK direction, with an optional VIX trend read.
### Key features at a glance
* **Automatic Price Levels (overlay on chart)**
* Yesterday’s High/Low of Day (**yHoD**, **yLoD**)
* Extended Hours High/Low (**yEHH**, **yEHL**) across yesterday AH + today pre‑market
* Today’s Pre‑Market High/Low (**PMH**, **PML**)
* Yesterday’s **Value Area High/Low** (**VAH/VAL**) and **Point of Control (POC)** computed from a volume profile of yesterday’s **regular session**
* Smart de‑duplication:
* Shows **only the higher** of (yEHH vs PMH) and **only the lower** of (yEHL vs PML) to avoid redundant bands
* **Market Breadth Table (on‑chart table)**
* **NYSE ratio** = UVOL/DVOL (signed) with **VOLD slope** from session open
* **NASDAQ ratio** = UVOLQ/DVOLQ (signed) with **VOLDQ slope** from session open
* **TICK** and **TICKQ**: live cumulative ratio and short‑term slope
* **VIX** (optional): current value + slope over a configurable lookback/timeframe
* Color‑coded trends with sensible thresholds and optional normalization
---
## 2) How to use it (trader workflow)
1. **Mark your reaction zones**
* Watch **yHoD/yLoD**, **PMH/PML**, and **VAH/VAL/POC** for first touches, break/retest, and failure tests.
* Expect increased responsiveness when multiple levels cluster (e.g., PMH ≈ VAH ≈ daily pivot).
2. **Read the breadth panel for context**
* **NYSE/NASDAQ ratio** (>1 = more up‑volume than down‑volume; <−1 = down‑dominant). Strong green across both favors long setups; red favors short setups.
* **VOLD slopes** (NYSE & NASDAQ): positive and accelerating → broadening participation; negative → persistent pressure.
* **TICK/TICKQ**: cumulative ratio and **slope arrows** (↗ / ↘ / →). Use the slope to gauge **near‑term thrust or fade**.
* **VIX slope**: rising VIX (red) often coincides with risk‑off; falling VIX (green) with risk‑on.
3. **Confluence = higher confidence**
* Example: Price reclaims **PMH** while **NYSE/NASDAQ ratios** print green and **TICK slopes** point ↗ — consider break‑and‑go; if VIX slope is ↘, that adds risk‑on confidence.
* Example: Price rejects **VAH** while **VOLD slopes** roll negative and VIX ↗ — consider fade/reversal.
4. **Risk management**
* Place stops just beyond key levels tested; if breadth flips, tighten or exit.
> **Timeframes:** Works best on 1–15m charts for intraday. Value Area is computed from **yesterday’s RTH**; choose a smaller calculation timeframe (e.g., 5–15m) for stable profiles.
---
## 3) Inputs & settings (what each option controls)
### Global Style
* **Enable all automatic price levels**: master toggle for yHoD/yLoD, yEHH/yEHL, PMH/PML, VAH/VAL/POC.
* **Line style/width**: applies to all drawn levels.
* **Label size/style** and **label color linking**: use the same color as the line or override with a global label color.
* **Maximum bars lookback**: how far the script scans to build yesterday metrics (performance‑sensitive).
### Value Area / Volume Profile
* **Enable Value Area calculations** *(on by default)*: computes yesterday’s **POC**, **VAH**, **VAL** from a simplified intraday volume profile built from yesterday’s **regular session bars**.
* **Max Volume Profile Points** *(default 50)*: lower values = faster; higher = more precise.
* **Value Area Calculation Timeframe** *(default 15)*: the security timeframe used when collecting yesterday’s highs/lows/volumes.
### Individual Level Toggles & Colors
* **yHoD / yLoD** (yesterday high/low)
* **yEHH / yEHL** (yesterday AH + today pre‑market extremes)
* **PMH / PML** (today pre‑market extremes)
* **VAH / VAL / POC** (yesterday RTH value area + point of control)
### Market Breadth Panel
* **Show NYSE / NASDAQ / VIX**: choose which series to display in the table.
* **Table Position / Size / Background Color**: UI placement and legibility.
* **Slope Averaging Periods** *(default 5)*: number of recent TICK/TICKQ ratio points used in slope calculation.
* **Candles for Rate** *(default 10)* & **Normalize Rate**: VIX slope calculation as % change between `now` and `n` candles ago; normalize divides by `n`.
* **VIX Timeframe**: optionally compute VIX on a higher TF (e.g., 15, 30, 60) for a smoother regime read.
* **Volume Normalization** (NYSE & NASDAQ): display VOLD slopes scaled to `tens/thousands/millions/10th millions` for readable magnitudes; color thresholds adapt to your choice.
---
## 4) Data sources & definitions
* **UVOL/VOLD (NYSE)** and **UVOLQ/DVOLQ/VOLDQ (NASDAQ)** via `request.security()`
* **Ratio** = `UVOL/DVOL` (signed; negative when down‑volume dominates)
* **VOLD slope** ≈ `(VOLD_now − VOLD_open) / bars_since_open`, then normalized per your setting
* **TICK/TICKQ**: cumulative sum of prints this session with **positives vs negatives ratio**, plus a simple linear regression **slope** of the last `N` ratio values
* **VIX**: value and slope across a user‑selected timeframe and lookback
* **Sessions (EST/EDT)**
* **Regular:** 09:30–16:00
* **Pre‑Market:** 04:00–09:30
* **After Hours:** 16:00–20:00
* **Extended‑hours extremes** combine **yesterday AH** + **today PM**
> **Note:** All session checks are done with TradingView’s `time(…,"America/New_York")` context. If your broker’s RTH differs (e.g., futures), adjust expectations accordingly.
---
## 5) How the algorithms work (plain English)
### A) Key Levels
* **Yesterday’s RTH High/Low**: scans yesterday’s bars within 09:30–16:00 and records the extremes + bar indices.
* **Extended Hours**: scans yesterday AH and today PM to get **yEHH/yEHL**. Script shows **either yEHH or PMH** (whichever is **higher**) and **either yEHL or PML** (whichever is **lower**) to avoid duplicate bands stacked together.
* **Value Area & POC (RTH only)**
* Build a coarse volume profile with `Max Volume Profile Points` buckets across the price range formed by yesterday’s RTH bars.
* Distribute each bar’s volume uniformly across the buckets it spans (fast approximation to keep Pine within execution limits).
* **POC** = bucket with max volume. **VA** expands from POC outward until **70%** of cumulative volume is enclosed → yields **VAH/VAL**.
### B) Market Breadth Table
* **NYSE/NASDAQ Ratio**: signed UVOL/DVOL with basic coloring.
* **VOLD Slopes**: from session open to current, normalized to human‑readable units; colors flip green/red based on thresholds that map to your normalization setting (e.g., ±2M for NYSE, ±3.5×10M for NASDAQ).
* **TICK/TICKQ Slope**: linear regression over the last `N` ratio points → **↗ / → / ↘** with the rounded slope value.
* **VIX Slope**: % change between now and `n` candles ago (optionally divided by `n`). Red when rising beyond threshold; green when falling.
---
## 6) Recommended presets
* **Stocks (liquid, intraday)**
* Value Area **ON**, `Max Volume Points` = **40–60**, **Timeframe** = **5–15**
* Breadth: show **NYSE & NASDAQ & VIX**, `Slope periods` = **5–8**, `Candles for rate` = **10–20**, **Normalize VIX** = **ON**
* **Index futures / very high‑volume symbols**
* If you see Pine timeouts, set `Max Volume Points` = **20–40** or temporarily **disable Value Area**.
* Keep breadth panel **ON** (it’s light). Consider **VIX timeframe = 15/30** for regime clarity.
---
## 7) Tips, edge cases & performance
* **Performance:** The volume profile is capped (`maxBarsToProcess ≤ 500` and bucketed) to keep it responsive. If you experience slowdowns, reduce `Max Volume Points`, `Maximum bars lookback`, or disable Value Area.
* **Redundant lines:** The script **intentionally suppresses** PMH/PML when yEHH/yEHL are more extreme, and vice‑versa.
* **Label visibility:** Use `Label style = none` if you only want clean lines and read values from the right‑end labels.
* **Futures/RTH differences:** Value Area is from **yesterday’s RTH** only; for 24h instruments the RTH period may not reflect overnight structure.
* **Session transitions:** PMH/PML tracking stops as soon as RTH starts; values persist as static levels for the session.
---
## 8) Known limitations
* Uses public TradingView symbols: `UVOL`, `VOLD`, `UVOLQ`, `DVOLQ`, `VOLDQ`, `TICK`, `TICKQ`, `VIX`. If your data plan or region limits any symbol, the corresponding table rows may show `na`.
* The VA/POC approximation assumes uniform distribution of each bar’s volume across its high–low. That’s fast but not a tick‑level profile.
* Works best on US equities with standard NY session; alternative sessions may need code changes.
---
## 9) Troubleshooting
* **“Script is too slow / timed out”** → Lower `Max Volume Points`, lower `Maximum bars lookback`, or toggle **OFF** `Enable Value Area calculations` for that instrument.
* **Missing breadth values** → Ensure the symbols above load on your account; try reloading chart or switching timeframes once.
* **Overlapping labels** → Set `Label style = none` or reduce label size.
---
## 10) Version / license / contribution
* **Version:** Initial public release (Pine v6).
* **Author:** © yelober
* **License:** Free for community use and enhancement. Please keep author credit.
* **Contributing:** Open PRs/ideas: presets, alert conditions, multi‑day VA composites, optional mid‑value (`(VAH+VAL)/2`), session filter for futures, and alertable state machine for breadth regime transitions.
---
## 11) Quick start (TL;DR)
1. Add the indicator and **keep default settings**.
2. Trade **reactions** at yHoD/yLoD/PMH/PML/VAH/VAL/POC.
3. Use the **breadth table**: look for **green ratios + ↗ slopes** (risk‑on) or **red ratios + ↘ slopes** (risk‑off). Check **VIX** slope for confirmation.
4. Manage risk around levels; when breadth flips against you, tighten or exit.
---
### Changelog (public)
* **v1.0:** First community release with automatic RTH levels, VA/POC approximation, breadth dashboard (NYSE/NASDAQ/TICK/TICKQ/VIX) with normalization and adaptive color thresholds.
