Super Sniper - Screener - MTF- Multi Asset -Multi IndicatorSuper Sniper Screener with Multi Indicator EMA Crossover, Trend, ADX, MACD, SSL, CCI, STOCHASTIC, RSI, HMA, QQE, WAE. Trade Entry/Exit with multiple Indicator for Multiple Assets and Multiple Timeframe. if you are on a Higher / Lower Time frame and are looking for Entry/Exit based on a lower timeframe then this indicator is the best. The all in one screener for EMA Crossover, Trend, ADX, MACD, SSL, CCI, STOCHASTIC, RSI, HMA, QQE, WAE
What is Sniper Entry?
if you are on a Higher / Lower Time frame and are looking for Entry/Exit based on a lower timeframe then this indicator is the best.
About this indicator.
horizontal Lines are in pink (down) and blue(up) color grey (neutral)
10 horizontal lines are plotted each for a timeframe + Asset / Currency / Stock
Back ground represents UP/DOWN Trend based on EMA 200 with the current time frame.
RED-Dot and GREEN-Dot are buy sell signals of SSL Channel for current Time Frame.
You can choose only one type of indicator (EMA Crossover, Trend, ADX, MACD, SSL, CCI, STOCHASTIC, RSI, HMA, QQE, WAE) for all the 10-lines
Select Asset and Timeframe for Each Line on the Graph.
Based on the color of the line and changes on Multi Timeframe you can ENTER/EXIT a Trade on current Timeframe.
Hence a Sniper Entry with multiple Indicator Screener
Search in scripts for "adx"

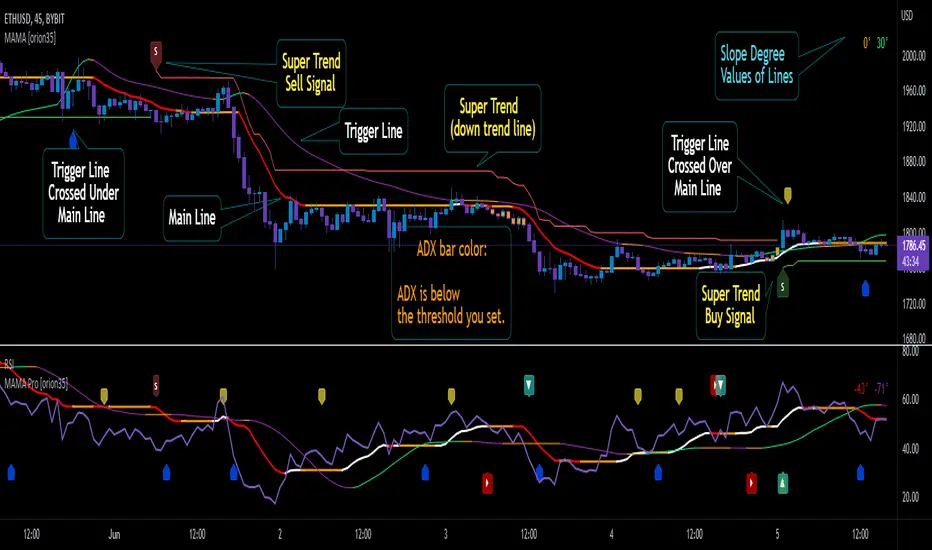
Mother of All Moving Averages, MAMA [orion35]This indicator contains the huge number of 53 MA tools . So, with the Mother of All Moving Averages (MAMA) , you can draw any two of these MA tools (that is, almost all the "Moving Average" tools used in the market) in the length and thickness you want.
These MA tools include traditional averages such as SMA , EMA , DEMA, as well as innovative averaging tools such as LFS (Laguerre Filter Smoother), LSMA (Least Square Moving Average), ZLSMA (Zerolag LSMA ) developed by @veryfid and SSMA (Super Smoothed Moving Average ) by John F. Ehlers .
Another great feature of this indicator is that signals can be filtered according to the instant ADX (Average Directional Movement indeX) value of the market. By using this filter, false signals in horizontal markets can be reduced. Also, with the threshold value setting in the ADX filter, calibration can be made for different assets and time frames when desired. In addition, you can color the price bars according to the ADX threshold value you set.
You can also automatically color these drawings in conditional formats as you wish.
If desired, the intersections of the plotted curves can be showed as signals. You can also set alarms for these intersections.
This indicator contains almost twice as many MA tools as the previous Super Moving Average Tools, SMAT indicator. For this reason, they are gathered in two main groups as " Traditional " and " New Generation " MA tools.
These MA tools are listed as follows:
--------- Mostly Traditional MA Tool s ---------
LFS : Laguerre Filter Smoother
SMA : Simple Moving Average
EMA : Exponential MA
DEMA : Double EMA
TEMA : Triple EMA
QEMA : Quadrupole EMA @everget
ZLEMA : Zerolag EMA
KZLEMA : Kalman ZLEMA
LRSMA : Linear Regression SMA
LREMA : Linear Regression EMA
TMA : Triangular MA (slow)
TMA v2 : Triangular MA (normal)
TMA v3 : Triangular MA (fast) @Daveatt
SMMA : SMoothed MA
SSMA : Super Smoother MA © 2013 John F. Ehlers
SSF : Super Smoother Filter @DonovanWall
SSeMA : Smoothed SEnsitive MA @BakwaasTrading
WMA : Weighted MA
VWMA : Volume Weighted MA
VWAP : Volume Weighted Average Price
AMA : Adaptive MA @everget
KAMA : Kaufman's Adaptive MA
FrAMA : Fractal Adaptive MA @Shizaru
ALMA : Arnaud Legoux MA
--------- New Generation MA Tools ---------
HMA : Hull MA
EHMA : Exponential HMA @DonovanWall
JMA : Jurik MA @everget
RMA : Relative MA aka Rolling MA
LWMA : Linearly Weighted MA @io72signals
LSMA : Least Square MA
ZLSMA : Zerolag LSMA @veryfid
ARSI : Adaptive Relative Strength Index @everget
WWMA : Welles Wilder's MA @KivancOzbilgic
VMA : Variable MA by Tushar S. Chande,
VIDYA : Variable Index Dynamic Average @KivancOzbilgic
VIDYA v2 : @Mohamed3nan
TSF : True Strength Force @KivancOzbilgic
TILL : Tillson T3 MA @KivancOzbilgic
DAF : Dynamically Adjustable Filter @alexgrover
KFS : Kalman Filter Smoother @alexgrover
PKF : Parametric Kalman Filter @alexgrover
VAMA : Volatility Adjusted MA @Duyck
CTI : Correlation Trend Indicator by John Ehlers
BF : Blackman Filter @alexgrover
MAMA : MESA Adaptive MA aka: Mother of AMA @KivancOzbilgic
FAMA : Following Adaptive MA @KivancOzbilgic
ARMA : Autonomous Recursive MA @alexgrover
ZARMA : Zerolag ARMA @alexgrover
A2RMA : Adaptive ARMA @alexgrover
EDMA : Exponentially Deviating MA @MightyZinger
BLP : Butterworth Low Pass Filter @DonovanWall
GLP : Gaussian Low Pass Filter @DonovanWall
SWMA : Sine Weighted MA @blackcat1402
BB-RSI-ADX Entry PointsThis is a combination of indicators used to find oversold and overbought entry points for possible reversion.
A Green arrow will appear when all condition are met for an ENTER LONG position.
A Red arow will appear when all condition are met for an ENTER SHORT position.
You can modify all of these condition parameters from the indicator's settings.
How does the indicator work
The signals are using Bollinger Bands , BB %B , RSI and ADX indicators to try and find points of reversal
Enter LONG Conditions
Current candle low is below BB lower band.
The BB %B is more than 0.
RSI > 30
ADX > 25
Enter SHORT Conditions
Current candle high is above BB upper band.
The BB %B is less than 1.
RSI < 70
ADX > 25
Those are the default settings that seem to work for me but you can customize all of these from the indicator settings.
I find this strategy to best work on a 3 minute timeframe
Note: The bb %B is calculated for stDev - 1. This will help you see a change happening faster.

The Brain Trust Presets Strategies [BTC / ETH] [PrismBot] [Lite]This strategy contains 9 different timeframe strategies (2 strategy types with pre-adjusted filter options for the different timeframes) tailored to BTC ( Bitcoin ) and ETH ( Ethereum ) on Binance. While I've listed these prebuilt strategies for specific timeframes, they are versatile enough to be checked and tested on other timeframes, and exchanges as well. I have been careful to avoid any curvefitting or overfitting. Included is useful default order settings, but we wanted to ensure you, the user, has control over the order settings for your own equity and trading.
These strategies are created, tailored, tested, and actively used by me.
It is up to you to do your own due diligence when testing these strategies on your exchange, and for your use, and PrismBot bears no responsibility for losses from the use of these strategies.
These strategies employ a variety of methods. Notable inclusions are other live strategies of mine including but not limited to:
ADX + MACD
RSI
Consolidations
Bull Bear Power
Volume Calculations
Open Interest Data
All of these setups include trend trading methods intended to maximize profitability in strong trending markets, and filters deployed to prevent failures in consolidation, though nothing is failproof.
You can control your leverage, quantity calculations, and other order settings. However, all other strategy input parameters are controlled by the strategy selectors.
Some strategies use 1.5 to 1 Risk to Reward ratio while others use 1:1.
How we execute trades for each strategy:
For 10m and 45m
we use a variety of settings for a Normalized MACD and ADX indicator. The thesis is we detect Normalized MACD crossovers at specific values and only allow trading of the strategy when the ADX is above a specific value.
For 15m, 1H, and 45m
we utilize the RSI crossovers of overbought and oversold and use the RSI moving average to filter trades. The thesis is we detect overbought for long and oversold for short.
For each strategy we use additional filters such as Bull Bear Power, Volume Flow, and Open Interest calculations to simply validate a trade.
Automatic Mode
In automatic mode, we detect your timeframe and current coin chart to decide one of the strategies from our database. If you want to manually select a different strategy or try the strategies on different cryptocurrencies, you can disable automatic mode entirely.

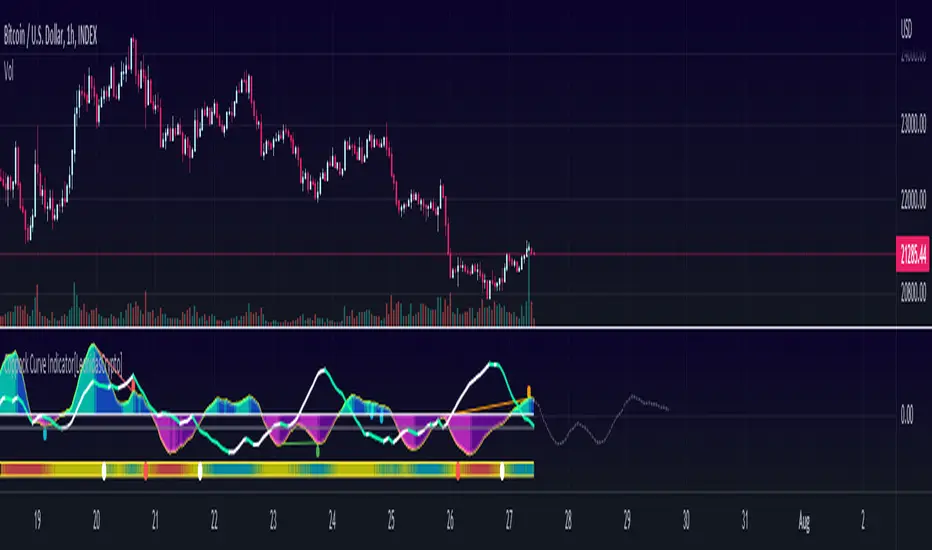
Momentum Indicator [LeonidasCrypto]This indicator is the result of the combination of 3 indicators giving you a very powerful strategy.
Coppock Curve Indicator Summary
The Coppock Curve (CC) was introduced by economist Edwin Coppock in an October 1962 issue of Barron's
While useful, the indicator is not commonly discussed among traders and investors. Traditionally used to spot long-term trend changes in major stock indexes, traders can use the indicator for any time and in any market to isolate potential trend shifts and generate trade signals.
How to use it:
0 line is the key level Above 0 line the momentum is getting strong(bullish) below 0 line the momentum is weak(bearish)
Buy signal:
In combination with ADX, Volatility :
Wait for the curve color turning to Dark Purple(weak bearish momentum) and ADX slope in the opposite side of the trend
Sell Signal.
Wait for the curve color turning to Dark Blue (weak bull momentum) and ADX slope in the opposite side of the trend
Explosive Moves.
This indicator will help you to catch explosive moves :
Wait for the bar in the bottom of the indicator turned blue color low volatility. Enter in the next buy/sell signal following the rules I described above using this strategy you will catch in many cases very good move.
Divergences:
This indicator will help you to identify divergences
Combine the divergences generated by this indicator with the sell/bull signals to increase the probabilities for a good trade setup.
ADeXtIt is an extended ADX and Direction Movement Index indicator with the following changes:
It shows a histogram instead of the DMI lines. If the histogram is green, the DMI+ is above DMI-, otherwise it is red.
You can specify a multiplier for the histogram values to check if values are above threshold. This way you can use the same threshold line as ADX to detect directional strength.
You can remove outliers from ATR calculations
You can use different MAs and sources for DMI and ATR calculations to make ADX more adjustable to different markets
It uses my ADExt library, so you can easily transfer your study to a strategy script.

Contrarian Scalping Counter Trend Bb Envelope Adx and StochasticContrarian Scalping is an trading strategy designed to take advanted of a counter-trend.
The advantage of these strrategies types is that they have a good profitability but with do not great gain (in relation at the time frame).
Indicators used:
Bollinger
Envelope
ADX
Stochastic
Rules for entry
For short: close of the price is above upper band from bb and envelope, adx is below 30 and stochastic is above 50
For long: close of the price is below lower band from bb and envelope, adx is below 30 and stochastic is below 50
Rules for exit
For short: either close of the candle is below lower band of bb or enveloper or stochastic is below 50
For long: either close o the candle is above upper band of bb or envelope or stochastic is above 50
If there are any questions let me know !

10X Market DirectionMy interpretation of John Carter's popular Simpler Trading 10X Bars indicator. Now you can see directional market strength for a variety of key futures , indices and industry groups for quick comparison with individual stocks.
Momentum is displayed to quickly see the quality and strength of a trend based on a calculation of the Directional Movement Index (DMI). The DMI is an indicator developed by J. Welles Wilder in 1978 that identifies in which direction the price of an asset is moving. The DMI is calculated by comparing prior highs and lows and produces 2 measurements illustrating the strength of the current trend:
-> a positive directional movement line ( +DI ); and
-> a negative directional movement line ( -DI ).
The average directional index ( ADX ) measures the strength of the current trend, either +DI or +DI ; a reading above 20 typically indicates a strong trend.
-> Green bars indicate an uptrend i.e. when +DI is above -DI and ADX is greater than 20 - there is more upward pressure than downward pressure in the price;
-> Red bars indicate a downtrend i.e. when -DI is above +DI and ADX is greater than 20 - there is more downward pressure on the price; and
-> Yellow bars indicate no strong directional trend and potential for a reversal.
This indicator should compliment other popular indicators, as confirmation whether to stay in a position or not.

10X Bars - Directional TrendsMy interpretation of John Carter's popular Simpler Trading 10X Bars indicator.
Momentum is displayed to quickly see the quality and strength of a trend based on a calculation of the Directional Movement Index (DMI). The DMI is an indicator developed by J. Welles Wilder in 1978 that identifies in which direction the price of an asset is moving. The DMI is calculated by comparing prior highs and lows and produces 2 measurements illustrating the strength of the current trend:
-> a positive directional movement line (+DI); and
-> a negative directional movement line (-DI).
The average directional index (ADX) measures the strength of the current trend, either +DI or +DI; a reading above 20 typically indicates a strong trend.
-> Green bars indicate an uptrend i.e. when +DI is above -DI and ADX is greater than 20 - there is more upward pressure than downward pressure in the price;
-> Red bars indicate a downtrend i.e. when -DI is above +DI and ADX is greater than 20 - there is more downward pressure on the price; and
-> Yellow bars indicate no strong directional trend and potential for a reversal.
Volume spikes 50% above average volume are then flagged as dots at the bottom of the chart (although you can change this location), confirming the momentum further.
This indicator should compliment other popular indicators, as confirmation whether to stay in a position or not.

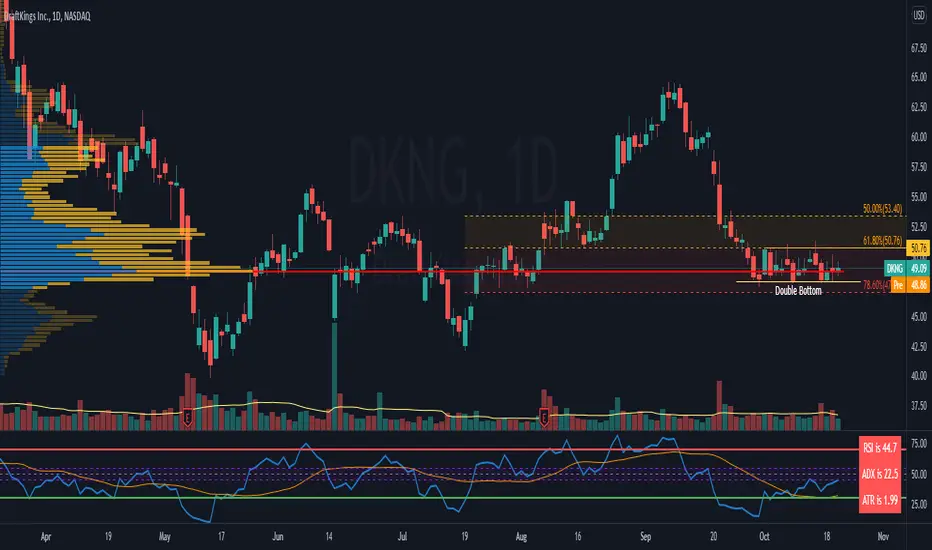
RSI c/w MA, ADX and ATR data I have added 3 items to the RSI indicator which helps me to get more information at the same time.
1) ADX value - when ADX is above 25 we have a strong trend
2) ATR Value - helps me to calculate my daily targets and stop-loss levels at a glance.
3) A simple moving average - This shows me the trend of RSI. If the price breaks a trend line and at the same time RSI crosses above the MA, it shows me a breakout has happened. In longer timeframes, it can show you in advance if you should expect a reversal in the trend.
You can turn on or off the MA as well as the ADX line.
MACD With Crossings and Above Below ZeroMACD with MACD Derivative, Crossings Above and Below Zero, Shading for ADX Smoothing and Overlayed RSI
Primarily a moving average convergence divergence (MACD) momentum indicator. Also includes a MACD Derivative overlay to show when momentum has peaked. Displays triangle symbols when the MACD line crosses the signal line (larger triangle when MACD crosses above/below zero to indicator stronger momentum trend). Includes shading for average directional index (ADX) to futher determine when the price is trending strongly (red when the ADX value is greater than 25, and idicating a strong trend; otherwise blue). Lastly, has a relative strength index (RSI) momentum indicator overlayed to help evaluate periods of overbought or oversold conditions.

Forex Scalping 1min Bollinger Bands, RSI and ADX Trading SystemThis is a Forex Scalping Trading Sytem based on the Bollinger Bands.
Its suited for major pairs, with lowest possible comission (below 1 pip) and with timeframes ranging between 1-15 min.
Indicators:
Bollinger bands
ADX
RSI
Rules for entry:
Long Entry: price to move below the upper Bollinger Bands RSI raise above the 30 line and ADX<32 at the same time.
Short Entry: price to move above the upper Bollinger Bands, RSI raise below the 70 line and ADX<32 at the same time.
Rules for exit
Profit Exit: 3 options: 1, exit position when the price touches the middle band, 2) when the price touches the opposite band, X pips target profit.
Loss Exit: X pips loss

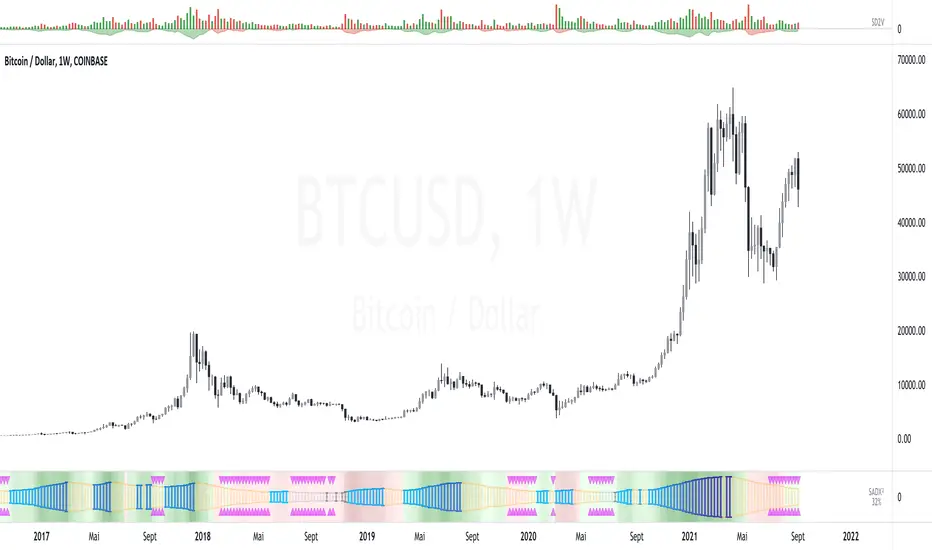
SADX+DI - Smoothed Average Directional Index by CrypTauxThis script is based on ADX/DI and I use it to enter when trend is in early stage, then ride it & exit at the right time (that's the theory)
ADX is shown as histogram :
- light silver bars = price is under thresold but still no trend, be patient.
- strong gray bars = prepare to enter the trade soon
- blue bars = price momentum so ride the trend
- yellow bars = do not trade (price reverts or consolidates)
Background color/bottom area based on DI+/DI- :
- green = uptrend
- red = downtrend
Top pink triangles appears when ADX is relatively low based on "lookback" history (not based on previous static threshold) so a new trend may happens so stay alerts.
- Prepare for enter when bars turn dark gray and/or pink triangles appears.
- Enter position as soon as you see blue bar (Long or Short as indicated by the area color)
- and Exit on first yellow bar.
Quite simple, works on multiple HTF/LTF and might be used with graphical analysis to find best opportunities.
Enjoy :)
--
Version 35.
MA Crossover Strategy with MA Turning Point Exits + ADX filterThis strategy uses @rthomson's "MA Crossover Strategy with MA Turning point Exits" and combines it with ADX.
This strategy filters out any entries where ADX < 20. In fact you can set the value for ADX threshold. (Generally value under 20 for ADX is considered as non trend zone)

MAX SAHAM ADX with DI Max Saham's ADX line with D+ & D-
ADX is used to quantify trend strength.
When the D+ (+DMI) is dominant and rising, price direction is up.
When the D- (-DMI) is dominant and rising, price direction is down. But the strength of price must also be considered.
Uses Wilder's MA to get a more accurate ADX reading as compared to SMA.
Also added the green background to indicate the trend and also dots to indicate bull and bear crossing of the DMI's

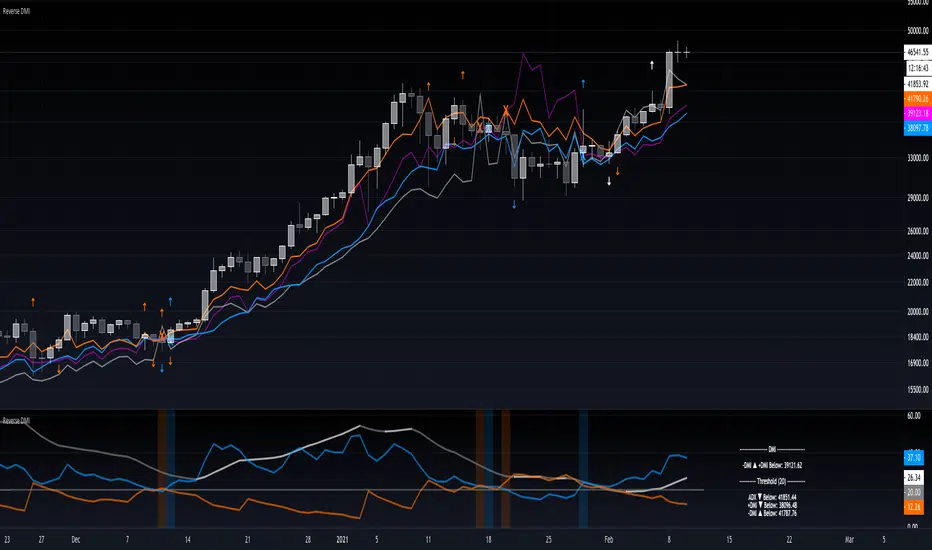
Reverse DMIThe Reverse DMI is in essence the same DMI or (Directional Movement Index) you all know and love with the addition of two reverse level features, and can be used to assist the end-user in their decision making for entry, exit and risk management.
In a nutshell the first feature is a reverse engineered calculation of the +DMI, and -DMI levels, compared to each other, in relation to the current price level as the point of divergence. The second feature is a reverse engineered calculation of the ADX, +DMI, and -DMI levels, compared to the user defined Threshold level, in relation to the current price level as the point of divergence.
At a glance this can then be used to determine the closing price level needed in order to cross the +DMI and -DMI, as well as the closing price level needed in order to cross the ADX, +DMI, and -DMI either under or over the user defined Threshold.
Optional Settings Include:
-------------------------------
1.) Change the Threshold Levels Right Margin
2.) Show/Hide ADX Exhaustion (will highlight the plot, if condition is met or exceeded)
3.) Show/Hide DMI Crosses (will highlight the background once, if condition is met)
4.) Show/Hide Reverse Levels
5.) Change the Reverse Levels Text Size
6.) Change the Reverse Levels Text Color
7.) Change the Reverse Levels Text Left Margin
8.) Change the Reverse Levels Decimal value
9.) Show/Hide the Reverse Levels Currency
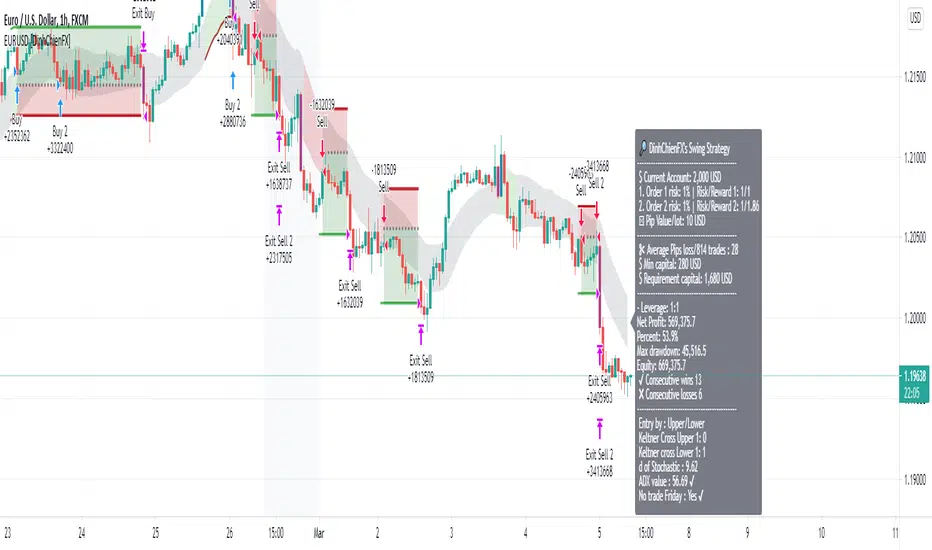
EURUSD DinhChienFX's signal V4.0Risk/reward: 1/1.3 | Entry by: Upper/Lower | Keltner crossing: 2 | Candle not entry: 80% | Stochastic: 70/15 | Adx: 31/9/9 | Notrade friday
Max risk: 3% - Risk / reward: 1 / 1.3.
1. Trend identification:
... Keltner: Price Through Upper / Lower 1 gives 1 point. 2 points are eligible for entry.
... Stochastic:
...... k> 70: Uptrend. k <15: Down trend.
... ADX: 31 provides strong trend following signal.
2. Entry point:
... Price corrects to Upper / Lower when 3 conditions Keltner , Stochastic & ADX indicator meet.
3. Not trade friday.
-------------
"Use the link below to obtain access to this indicator" or "PM us to obtain access"
SALEH MACD Donchian + EMA & MACD + ADXI gathered all the signals coming from the MACD & Donchian channels indicators and filtered them with EMA 200 or ADX > 25 indicators (which both of them show the trend),
and put them on the chart to show me the buy and sell signals;
the signals rules are as following:
BUY:
when we have an uptrend ( the price is above the EMA 200 or ADX > 25 ) & the macd line cross up the signal line while they are both under the 0 level of histogram it generates buy signals.
SELL:
when we have a downtrend ( the price is below the EMA 200 or ADX > 25) & the macd line cross below the signal line while they are both above the 0 level of histogram it generates sell signals.
Donchian channel works as a confirmation for the macd signal.
this signals work best at London session, you can also filter them by chandelier exit indicator.

[astropark] DMI/ADX strategy [alarms]Dear Followers,
today I'm happy to share with you my DMI / ADX Strategy .
It provides directional trend information, so if a bullish or a bearish trend is going to start. Statistically it works better on lower timeframes (from 5 minutes to 1 hour).
It is both a Swing and Scalping Strategy indicator , based on a simple trend following theory , good for trading FOREX, Indexes, Stocks, Commodities and Cryptocurrencies.
To help in Taking Profits, the strategy integrates 2 special other than bull/bear signals:
Overbought and Oversold RSI Signals , which appear both as darker background (the darker the color, the more the price is in overbought/oversold) and green "ob"-"tp" / red "os"-"tp" labels (they optionally pop up only on a configurable stronger overbought/oversold condition) (you can enable/disable it optionally)
Peak Profit Tracker , which resets every time a new trade starts and keeps track of price fluctuation during the trade: the message is don't be too greedy and take profits or lock them with a stoploss in profit (you can enable/disable it optionally)
You can edit many options in order to
have more/less bull/bear signals
enable/disable showing bull/bear signals
enable/disable showing RSI TP signals (you can edit RSI length, overbought (OB) and oversold (OS) levels)
enable/disable showing peak profits on each trade
The user who wants to use this strategy, especially via an automated bot, must always set a stoploss (example 150$ from entry on bitcoin ) or use a proper risk management strategy .
This is not the "Holy Grail", so use it with caution. It's highly suggested to use a proper money management .
This script will let you set all notifications you may need in order to be alerted on each triggered signals.
You can find the strategy version for backtesting here below:
Here there are some examples how this DMI / ADX strategy works on many markets:
LTC/USDT 15m
BTC/USD 15m
BNB/BTC 15m
ETH/USD 15m
GOLD (XAU/USD) 15m
GOLD (XAU/USD) 1h
FB 15m
AAPL 15m
TSLA 1h
BANKNIFTY Index 5m
NIFTY 50 Index 5m
This is a premium indicator , so send me a private message in order to get access to this script .

Trend Cloud
The clouds reflect a possible overextension of the trend. Traders could use it as a signal to scale out the positions in the direction of the present trend or avoid scaling in.
The indicator plots the difference between ADX over the 45 level proportionate to the range between an ATR multiplier around MA. By default, the ADX is calculated with a DI length of 14 and an ADX smoothing of 14, an ATR length of 14, MA length of 20 and a multiplier of 2.
On the chart, I have highlighted with the vertical line the candles when the indicator was activated on all four timeframes simultaneously.
unRekt - KISS AddieKISS Addie is the ADX and DI+- indicator and is part of the 'keeping it simple' series. ADX is your Average Directional Index and DI is you Directional Movement Indicator.
ADX - Will show the strength of the trend regardless of direction.
00 - 10 : No trend
10 - 20 : Transitioning trend
20 - 40 : Trending
40 - 99 : Exhausted (Can also be considered a stronger trend the higher it goes, but look to exit position once it begins to downward slope and pay attention to DI spread)
DI - Will show the direction of movement. This indicator includes two views of the DI. the DI+ and DI- crossover and a histogram of the spread between the two.
Bullish : Green crosses over red.
Bearish : Red crosses over green.

PpSignal ADX/DI HistogramHere we have the ADX with DM histogram signal, and volatile Bollinger Band (period 13, Deviation 0.61).
the best signal is when adx is into volatility and dm histogram is going in the same directions.
For example if you detect a up channel...you will buy when DMI histogram is in buy signal (green) and Adx is abobe the bollinguer band. and in e green color.

PpSignal ADX Moving Average The ADX indicator uses a smoothing moving average in its calculation and we find out that the best ADX indicator settings to use is 14 periods. ... The ADX indicator can only help us to gauge the intensity of the trend so we need to RSI or Ewo indicator for entry signals.
Gray color is hold, lime buy and orange sell.
