The Ultimate Indicator by ATK
The Ultimate Indicator By ATK
This all-in-one trading indicator integrates multiple advanced tools to provide ICT traders with deep insights into market structure, liquidity zones, Fair Value Gaps (FVG), and AI-powered signals. Whether you’re a scalper or a long-term trader, this indicator offers real-time analysis and helps identify potential trading opportunities in dynamic markets.
🔵 Key Features
🔹 2 options for checking SMT (Separation and Divergence) Detection:
First - Compares highs and lows of a primary symbol (e.g., NQ1!) with a user-defined comparison symbol (e.g., ES1!).
Automatically detects and visualizes discrepancies (red for highs, blue for lows) between the symbols.
Offers customizable comparison settings and alerts for divergence detection.
Second -
Real-time SMT comparison between two tickers - red/green lines.
🔹 Market Structure Change (MSS) & Break of Structure (BOS) Detection:
Identifies market structure shifts and breakouts, crucial for spotting potential reversals.
Customizable sensitivity and length settings to adapt to various market conditions and trading strategies. Use 3 different timeframes on the same chart.
🔹 Buy Side & Sell Side Liquidity Zones:
Highlights liquidity zones on both buy and sell sides, offering a clear view of market pressure points.
Configurable settings for detection length, margin, and alert conditions for liquidity sweeps like the 15-minute Buy Side Liquidity (BSL) and Sell Side Liquidity (SSL).
These lines from Swing Highs & Lows:
Automatically plots horizontal lines at the most recent swing highs and lows.
Lines are removed once the closing price breaches these levels, ensuring real-time updates and clean charting.
🔹 Fair Value Gap (FVG) Detection:
Detects FVG formations on 5-minute and 1-minute charts, making it ideal for scalpers capturing liquidity gaps.
Includes directional arrows and customizable alerts based on higher and lower timeframe FVG analysis, helping traders time their entry and exit points.
🔹IFVG (Inverse fair value gap) - yellow
🔹IFVG + SMT - Light blue
🔹IFVG + SMT + HTF FVG - green/red (1 min only)
🔹IFVG + SMT + BSL/SSL Swept - green/red (1 min only)
for example:
🔹 Capture and plot significant price levels at specific times throughout the trading day:
TDO (True Day Open): The price at which a market opens at 12:00 AM US.
TMSO (True Micro Session Open): The open price of the Q2 of the micro session.
RVT (Revolving True Open): The price recorded at 12:00 PM US.
AO (Asia True Open Price): The price captured at 7:30 PM US, specifically representing the opening price of the Asian session.
LO (London True Open Price): 1:30 AM US
AM (New York Session - Afternoon Market True Open Price): 7:30 AM US
PM (Post Market Open Price): 1:30 PM US.
For example TMSO:
🔹 AI-Powered Entry Detection:
The script helps identify entry points based on specific candle patterns, while also considering the exponential moving averages (EMAs) for trend confirmation.
🔶FFMS Strategy: (First Five Minute Strategy)
Check 5-min time frame if the price is between the high and low of the previous day. then, when NYO if there is retest on the High/Low on the 5-min chart after crossover or crossunder the 5 minute first candle high/low lines.
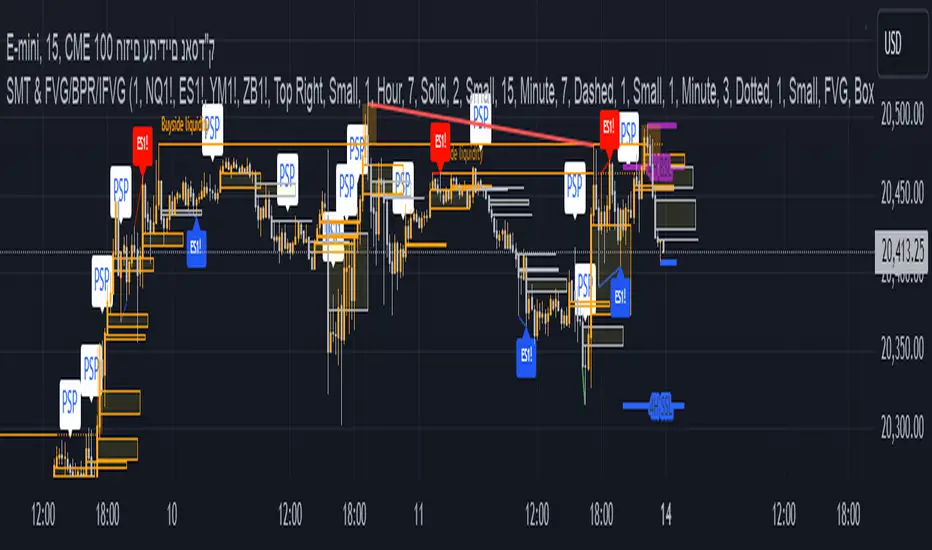
🔶PSP & PSP + FVG
🔹The Precision Swing Point (PSP). It helps you visually identify price decorrelation (type of SMT) among key futures contracts (NQ/ES or NQ/ES/YM/ZB) and set alerts for these significant market movements.
🔹The PSP HTF 15 Min + FVG LTF 1 Min
In this strategy the script is looking for PSP in HTF (15-Min) and capture the FVG in LTF (1-Min) only if its between High and Low of the PSP.
If there is a retracement in parallel micro session time, for example: Q1 with Q3 or Q2 with Q4, Q3 with Q1, etc…
if the retracement was happened and the price close above/below the high/low of the FVG from the LTF that captured according to the direction for long/short, it plots an arrow.
Update the script that checks the purple arrows and shows all of them each time there is a new PSP in a 15-minute timeframe and then FVG in 1 Min timeframe with the reference to the TDO/TMSO/Open session
for example:
Step 1: PSP 15Min LOW/HIGH Lines look for FVG by the conditions above - purple arrow
Step 2:FVG founded - purple arrow
SMT Fill on 15 min timeframe + IFVG 1 min - Detected option:
When Sym1 closed above/below FVG and Sym2 didn't it is SMT FILL (15 Min timeframe)
White arrows when captured SMT FIll + IFVG:
option to turn on alert on this strategy too.
🔹Detect liquidity swept on 15-min timeframe by $$ - green/red
🔹Detect liquidity to sweep zones on by diamonds - green/red
🔹Alerts for all Events and full scenarios.
Real-time notifications ensure traders can act quickly on potential trade setups.
🔵 Conclusion:
This Ultimate Indicator by ATK brings together critical elements of market analysis in one tool for ICT traders, offering real-time insights, alerts, and visual aids to enhance trading strategies. Whether you’re focused on short-term price action or long-term market trends, this indicator provides the tools necessary for informed decision-making and improved trading performance.
Pine Script® indicator