PGT: Pretty Good TraderLittle bit of background :
I am a broke college student on the East coast, and I have developed a hobby for creating trading algorithms. This is one of the better scripts that I have written. Unfortunately, as a broke college student, I don't have the disposable income to actually trade using real money. If you are interested in donating to my broke college student fund, please message me!
On to the script :
This script was written in pine version 3 and does not calculate_on_tick . This means that it does not repaint . The numbers you see are, to the best of my knowledge, accurate.
Because most scripts tend to overfit data to generate the "best looking data", I decided to create an algorithm that would be generalizable as possible to a diverse number of trading pairs. This script works on both crytpo markets(works best on smaller time frame) and stock markets(works best on larger time frames).
I am publishing this script to both gauge and generate interest in a Python trading bot which I have written which automatically buys and sells on different exchanges by using the predictive signals of this indicator.
Search in scripts for "algo"

PnL Bubble [%] | Fractalyst1. What's the indicator purpose?
The PnL Bubble indicator transforms your strategy's trade PnL percentages into an interactive bubble chart with professional-grade statistics and performance analytics. It helps traders quickly assess system profitability, understand win/loss distribution patterns, identify outliers, and make data-driven strategy improvements.
How does it work?
Think of this indicator as a visual report card for your trading performance. Here's what it does:
What You See
Colorful Bubbles: Each bubble represents one of your trades
Blue/Cyan bubbles = Winning trades (you made money)
Red bubbles = Losing trades (you lost money)
Bigger bubbles = Bigger wins or losses
Smaller bubbles = Smaller wins or losses
How It Organizes Your Trades:
Like a Photo Album: Instead of showing all your trades at once (which would be messy), it shows them in "pages" of 500 trades each:
Page 1: Your first 500 trades
Page 2: Trades 501-1000
Page 3: Trades 1001-1500, etc.
What the Numbers Tell You:
Average Win: How much money you typically make on winning trades
Average Loss: How much money you typically lose on losing trades
Expected Value (EV): Whether your trading system makes money over time
Positive EV = Your system is profitable long-term
Negative EV = Your system loses money long-term
Payoff Ratio (R): How your average win compares to your average loss
R > 1 = Your wins are bigger than your losses
R < 1 = Your losses are bigger than your wins
Why This Matters:
At a Glance: You can instantly see if you're a profitable trader or not
Pattern Recognition: Spot if you have more big wins than big losses
Performance Tracking: Watch how your trading improves over time
Realistic Expectations: Understand what "average" performance looks like for your system
The Cool Visual Effects:
Animation: The bubbles glow and shimmer to make the chart more engaging
Highlighting: Your biggest wins and losses get extra attention with special effects
Tooltips: hover any bubble to see details about that specific trade.
What are the underlying calculations?
The indicator processes trade PnL data using a dual-matrix architecture for optimal performance:
Dual-Matrix System:
• Display Matrix (display_matrix): Bounded to 500 trades for rendering performance
• Statistics Matrix (stats_matrix): Unbounded storage for complete statistical accuracy
Trade Classification & Aggregation:
// Separate wins, losses, and break-even trades
if val > 0.0
pos_sum += val // Sum winning trades
pos_count += 1 // Count winning trades
else if val < 0.0
neg_sum += val // Sum losing trades
neg_count += 1 // Count losing trades
else
zero_count += 1 // Count break-even trades
Statistical Averages:
avg_win = pos_count > 0 ? pos_sum / pos_count : na
avg_loss = neg_count > 0 ? math.abs(neg_sum) / neg_count : na
Win/Loss Rates:
total_obs = pos_count + neg_count + zero_count
win_rate = pos_count / total_obs
loss_rate = neg_count / total_obs
Expected Value (EV):
ev_value = (avg_win × win_rate) - (avg_loss × loss_rate)
Payoff Ratio (R):
R = avg_win ÷ |avg_loss|
Contribution Analysis:
ev_pos_contrib = avg_win × win_rate // Positive EV contribution
ev_neg_contrib = avg_loss × loss_rate // Negative EV contribution
How to integrate with any trading strategy?
Equity Change Tracking Method:
//@version=6
strategy("Your Strategy with Equity Change Export", overlay=true)
float prev_trade_equity = na
float equity_change_pct = na
if barstate.isconfirmed and na(prev_trade_equity)
prev_trade_equity := strategy.equity
trade_just_closed = strategy.closedtrades != strategy.closedtrades
if trade_just_closed and not na(prev_trade_equity)
current_equity = strategy.equity
equity_change_pct := ((current_equity - prev_trade_equity) / prev_trade_equity) * 100
prev_trade_equity := current_equity
else
equity_change_pct := na
plot(equity_change_pct, "Equity Change %", display=display.data_window)
Integration Steps:
1. Add equity tracking code to your strategy
2. Load both strategy and PnL Bubble indicator on the same chart
3. In bubble indicator settings, select your strategy's equity tracking output as data source
4. Configure visualization preferences (colors, effects, page navigation)
How does the pagination system work?
The indicator uses an intelligent pagination system to handle large trade datasets efficiently:
Page Organization:
• Page 1: Trades 1-500 (most recent)
• Page 2: Trades 501-1000
• Page 3: Trades 1001-1500
• Page N: Trades to
Example: With 1,500 trades total (3 pages available):
• User selects Page 1: Shows trades 1-500
• User selects Page 4: Automatically falls back to Page 3 (trades 1001-1500)
5. Understanding the Visual Elements
Bubble Visualization:
• Color Coding: Cyan/blue gradients for wins, red gradients for losses
• Size Mapping: Bubble size proportional to trade magnitude (larger = bigger P&L)
• Priority Rendering: Largest trades displayed first to ensure visibility
• Gradient Effects: Color intensity increases with trade magnitude within each category
Interactive Tooltips:
Each bubble displays quantitative trade information:
tooltip_text = outcome + " | PnL: " + pnl_str +
"\nDate: " + date_str + " " + time_str +
"\nTrade #" + str.tostring(trade_number) + " (Page " + str.tostring(active_page) + ")" +
"\nRank: " + str.tostring(rank) + " of " + str.tostring(n_display_rows) +
"\nPercentile: " + str.tostring(percentile, "#.#") + "%" +
"\nMagnitude: " + str.tostring(magnitude_pct, "#.#") + "%"
Example Tooltip:
Win | PnL: +2.45%
Date: 2024.03.15 14:30
Trade #1,247 (Page 3)
Rank: 5 of 347
Percentile: 98.6%
Magnitude: 85.2%
Reference Lines & Statistics:
• Average Win Line: Horizontal reference showing typical winning trade size
• Average Loss Line: Horizontal reference showing typical losing trade size
• Zero Line: Threshold separating wins from losses
• Statistical Labels: EV, R-Ratio, and contribution analysis displayed on chart
What do the statistical metrics mean?
Expected Value (EV):
Represents the mathematical expectation per trade in percentage terms
EV = (Average Win × Win Rate) - (Average Loss × Loss Rate)
Interpretation:
• EV > 0: Profitable system with positive mathematical expectation
• EV = 0: Break-even system, profitability depends on execution
• EV < 0: Unprofitable system with negative mathematical expectation
Example: EV = +0.34% means you expect +0.34% profit per trade on average
Payoff Ratio (R):
Quantifies the risk-reward relationship of your trading system
R = Average Win ÷ |Average Loss|
Interpretation:
• R > 1.0: Wins are larger than losses on average (favorable risk-reward)
• R = 1.0: Wins and losses are equal in magnitude
• R < 1.0: Losses are larger than wins on average (unfavorable risk-reward)
Example: R = 1.5 means your average win is 50% larger than your average loss
Contribution Analysis (Σ):
Breaks down the components of expected value
Positive Contribution (Σ+) = Average Win × Win Rate
Negative Contribution (Σ-) = Average Loss × Loss Rate
Purpose:
• Shows how much wins contribute to overall expectancy
• Shows how much losses detract from overall expectancy
• Net EV = Σ+ - Σ- (Expected Value per trade)
Example: Σ+: 1.23% means wins contribute +1.23% to expectancy
Example: Σ-: -0.89% means losses drag expectancy by -0.89%
Win/Loss Rates:
Win Rate = Count(Wins) ÷ Total Trades
Loss Rate = Count(Losses) ÷ Total Trades
Shows the probability of winning vs losing trades
Higher win rates don't guarantee profitability if average losses exceed average wins
7. Demo Mode & Synthetic Data Generation
When using built-in sources (close, open, etc.), the indicator generates realistic demo trades for testing:
if isBuiltInSource(source_data)
// Generate random trade outcomes with realistic distribution
u_sign = prand(float(time), float(bar_index))
if u_sign < 0.5
v_push := -1.0 // Loss trade
else
// Skewed distribution favoring smaller wins (realistic)
u_mag = prand(float(time) + 9876.543, float(bar_index) + 321.0)
k = 8.0 // Skewness factor
t = math.pow(u_mag, k)
v_push := 2.5 + t * 8.0 // Win trade
Demo Characteristics:
• Realistic win/loss distribution mimicking actual trading patterns
• Skewed distribution favoring smaller wins over large wins
• Deterministic randomness for consistent demo results
• Includes jitter effects to prevent visual overlap
8. Performance Limitations & Optimizations
Display Constraints:
points_count = 500 // Maximum 500 dots per page for optimal performance
Pine Script v6 Limits:
• Label Count: Maximum 500 labels per indicator
• Line Count: Maximum 100 lines per indicator
• Box Count: Maximum 50 boxes per indicator
• Matrix Size: Efficient memory management with dual-matrix system
Optimization Strategies:
• Pagination System: Handle unlimited trades through 500-trade pages
• Priority Rendering: Largest trades displayed first for maximum visibility
• Dual-Matrix Architecture: Separate display (bounded) from statistics (unbounded)
• Smart Fallback: Automatic page clamping prevents empty displays
Impact & Workarounds:
• Visual Limitation: Only 500 trades visible per page
• Statistical Accuracy: Complete dataset used for all calculations
• Navigation: Use page input to browse through entire trade history
• Performance: Smooth operation even with thousands of trades
9. Statistical Accuracy Guarantees
Data Integrity:
• Complete Dataset: Statistics matrix stores ALL trades without limit
• Proper Aggregation: Separate tracking of wins, losses, and break-even trades
• Mathematical Precision: Pine Script v6's enhanced floating-point calculations
• Dual-Matrix System: Display limitations don't affect statistical accuracy
Calculation Validation:
// Verified formulas match standard trading mathematics
avg_win = pos_sum / pos_count // Standard average calculation
win_rate = pos_count / total_obs // Standard probability calculation
ev_value = (avg_win * win_rate) - (avg_loss * loss_rate) // Standard EV formula
Accuracy Features:
• Mathematical Correctness: Formulas follow established trading statistics
• Data Preservation: Complete dataset maintained for all calculations
• Precision Handling: Proper rounding and boundary condition management
• Real-Time Updates: Statistics recalculated on every new trade
10. Advanced Technical Features
Real-Time Animation Engine:
// Shimmer effects with sine wave modulation
offset = math.sin(shimmer_t + phase) * amp
// Dynamic transparency with organic flicker
new_transp = math.min(flicker_limit, math.max(-flicker_limit, cur_transp + dir * flicker_step))
• Sine Wave Shimmer: Dynamic glowing effects on bubbles
• Organic Flicker: Random transparency variations for natural feel
• Extreme Value Highlighting: Special visual treatment for outliers
• Smooth Animations: Tick-based updates for fluid motion
Magnitude-Based Priority Rendering:
// Sort trades by magnitude for optimal visual hierarchy
sort_indices_by_magnitude(values_mat)
• Largest First: Most important trades always visible
• Intelligent Sorting: Custom bubble sort algorithm for trade prioritization
• Performance Optimized: Efficient sorting for real-time updates
• Visual Hierarchy: Ensures critical trades never get hidden
Professional Tooltip System:
• Quantitative Data: Pure numerical information without interpretative language
• Contextual Ranking: Shows trade position within page dataset
• Percentile Analysis: Performance ranking as percentage
• Magnitude Scaling: Relative size compared to page maximum
• Professional Format: Clean, data-focused presentation
11. Quick Start Guide
Step 1: Add Indicator
• Search for "PnL Bubble | Fractalyst" in TradingView indicators
• Add to your chart (works on any timeframe)
Step 2: Configure Data Source
• Demo Mode: Leave source as "close" to see synthetic trading data
• Strategy Mode: Select your strategy's PnL% output as data source
Step 3: Customize Visualization
• Colors: Set positive (cyan), negative (red), and neutral colors
• Page Navigation: Use "Trade Page" input to browse trade history
• Visual Effects: Built-in shimmer and animation effects are enabled by default
Step 4: Analyze Performance
• Study bubble patterns for win/loss distribution
• Review statistical metrics: EV, R-Ratio, Win Rate
• Use tooltips for detailed trade analysis
• Navigate pages to explore full trade history
Step 5: Optimize Strategy
• Identify outlier trades (largest bubbles)
• Analyze risk-reward profile through R-Ratio
• Monitor Expected Value for system profitability
• Use contribution analysis to understand win/loss impact
12. Why Choose PnL Bubble Indicator?
Unique Advantages:
• Advanced Pagination: Handle unlimited trades with smart fallback system
• Dual-Matrix Architecture: Perfect balance of performance and accuracy
• Professional Statistics: Institution-grade metrics with complete data integrity
• Real-Time Animation: Dynamic visual effects for engaging analysis
• Quantitative Tooltips: Pure numerical data without subjective interpretations
• Priority Rendering: Intelligent magnitude-based display ensures critical trades are always visible
Technical Excellence:
• Built with Pine Script v6 for maximum performance and modern features
• Optimized algorithms for smooth operation with large datasets
• Complete statistical accuracy despite display optimizations
• Professional-grade calculations matching institutional trading analytics
Practical Benefits:
• Instantly identify system profitability through visual patterns
• Spot outlier trades and risk management issues
• Understand true risk-reward profile of your strategies
• Make data-driven decisions for strategy optimization
• Professional presentation suitable for performance reporting
Disclaimer & Risk Considerations:
Important: Historical performance metrics, including positive Expected Value (EV), do not guarantee future trading success. Statistical measures are derived from finite sample data and subject to inherent limitations:
• Sample Bias: Historical data may not represent future market conditions or regime changes
• Ergodicity Assumption: Markets are non-stationary; past statistical relationships may break down
• Survivorship Bias: Strategies showing positive historical EV may fail during different market cycles
• Parameter Instability: Optimal parameters identified in backtesting often degrade in forward testing
• Transaction Cost Evolution: Slippage, spreads, and commission structures change over time
• Behavioral Factors: Live trading introduces psychological elements absent in backtesting
• Black Swan Events: Extreme market events can invalidate statistical assumptions instantaneously

Mutanabby_AI | Fresh Algo V24Mutanabby_AI | Fresh Algo V24: Advanced Multi-Mode Trading System
Overview
The Mutanabby_AI Fresh Algo V24 represents a sophisticated evolution of multi-component trading systems that adapts to various market conditions through advanced operational configurations and enhanced analytical capabilities. This comprehensive indicator provides traders with multiple signal generation approaches, specialized assistant functions, and dynamic risk management tools designed for professional market analysis across diverse trading environments.
Primary Signal Generation Framework
The Fresh Algo V24 operates through two fundamental signal generation approaches that accommodate different market perspectives and trading philosophies. The Trending Signals Mode serves as the primary trend-following mechanism, combining Wave Trend Oscillator analysis with Supertrend directional signals and Squeeze Momentum breakout detection. This mode incorporates ADX filtering that requires values exceeding 20 to ensure sufficient trend strength exists before signal activation, making it particularly effective during sustained directional market movements where momentum persistence creates profitable trading opportunities.
The Contrarian Signals Mode provides an alternative approach targeting reversal opportunities through extreme market condition identification. This mode activates when the Wave Trend Oscillator reaches critical threshold levels, specifically when readings surpass 65 indicating potential bearish reversal conditions or drop below 35 suggesting bullish reversal opportunities. This methodology proves valuable during overextended market phases where mean reversion becomes statistically probable.
Advanced Filtering Mechanisms
The system incorporates multiple sophisticated filtering mechanisms designed to enhance signal quality and reduce false positive occurrences. The High Volume Filter requires volume expansion confirmation before signal activation, utilizing exponential moving average calculations to ensure institutional participation accompanies price movements. This filter substantially improves signal reliability by eliminating low-conviction breakouts that lack adequate volume support from professional market participants.
The Strong Filter provides additional trend confirmation through 200-period exponential moving average analysis. Long position signals require price action above this benchmark level, while short position signals necessitate price action below it. This ensures strategic alignment with longer-term trend direction and reduces the probability of trading against major market movements that could invalidate shorter-term signals.
Cloud Filter Configuration System
The Fresh Algo V24 offers four distinct cloud filter configurations, each optimized for specific trading timeframes and market approaches. The Smooth Cloud Filter utilizes the mathematical relationship between 150-period and 250-period exponential moving averages, providing stable trend identification suitable for position trading strategies. This configuration generates signals exclusively when price action aligns with cloud direction, creating a more deliberate but highly reliable signal generation process.
The Swing Cloud Filter employs modified Supertrend calculations with parameters specifically optimized for swing trading timeframes. This filter achieves optimal balance between responsiveness and stability, adapting effectively to medium-term price movements while filtering excessive market noise that typically affects shorter-term analytical systems.
For active intraday traders, the Scalping Cloud Filter utilizes accelerated Supertrend calculations designed to capture rapid trend changes effectively. This configuration provides enhanced signal generation frequency suitable for compressed timeframe strategies. The advanced Scalping+ Cloud Filter incorporates Hull Moving Average confirmation, delivering maximum responsiveness for ultra-short-term trading while maintaining signal quality through additional momentum validation processes.
Specialized Assistant Functionality
The system includes two distinct assistant modes that provide supplementary market analysis capabilities. The Trend Assistant Mode activates advanced cloud analysis overlays that display dynamic support and resistance zones calculated through adaptive volatility algorithms. These levels automatically adjust to current market conditions, providing visual guidance for identifying trend continuation patterns and potential reversal areas with mathematical precision.
The Trend Tracker Mode concentrates on long-term trend identification by displaying major exponential moving averages with color-coded fill areas that clarify directional bias. This mode maintains visual simplicity while providing comprehensive trend context evaluation, enabling traders to quickly assess broader market direction and align shorter-term strategies accordingly.
Dynamic Risk Management System
The integrated risk management system automatically adapts across all operational modes, calculating stop loss and take profit targets using Average True Range multiples that adjust to current market volatility. This approach ensures consistent risk parameters regardless of selected operational mode while maintaining relevance to prevailing market conditions.
Stop loss placement occurs at dynamically calculated distances from entry points, while three progressive take profit targets establish at customizable ATR multiples respectively. The system automatically updates these levels upon trend direction changes, ensuring current market volatility influences all risk calculations and maintains appropriate risk-reward ratios throughout trade management.
Comprehensive Market Analysis Dashboard
The sophisticated dashboard provides real-time market analysis including volatility measurements, institutional activity assessment, and multi-timeframe trend evaluation across five-minute through four-hour periods. This comprehensive market context assists traders in selecting appropriate operational modes based on current market characteristics rather than relying exclusively on historical performance data.
The multi-timeframe analysis ensures mode selection considers broader market context beyond the primary trading timeframe, improving overall strategic alignment and reducing conflicts between different temporal market perspectives. The dashboard displays market state classification, volatility percentages, institutional activity levels, current trading session information, and trend pressure indicators with professional formatting and clear visual hierarchy.
Enhanced Trading Assistants
The Fresh Algo V24 includes specialized trading assistant features that complement the primary signal generation system. The Reversal Dot functionality identifies potential reversal points through Wave Trend Oscillator analysis, displaying visual indicators when crossover conditions occur at extreme levels. These reversal indicators provide early warning signals for potential trend changes before they appear in the primary signal system.
The Dynamic Take Profit Labels feature automatically identifies optimal profit-taking opportunities through RSI threshold analysis, marking potential exit points at multiple levels for long positions and corresponding levels for short positions. This automated profit management system helps traders optimize exit timing without requiring constant manual monitoring of technical indicators.
Advanced Alert System
The comprehensive alert system accommodates all operational modes while providing granular notification control for various signal types and risk management events. Traders can configure separate alerts for normal buy signals, strong buy signals, normal sell signals, strong sell signals, stop loss triggers, and individual take profit target achievements.
Cloud crossover alerts notify traders when trend direction changes occur, providing early indication of potential strategy adjustments. The alert system includes detailed trade setup information, timeframe data, and relevant entry and exit levels, ensuring traders receive complete context for informed decision-making without requiring constant chart monitoring.
Technical Foundation Architecture
The Fresh Algo V24 combines multiple proven technical analysis components including Wave Trend Oscillator for momentum assessment, Supertrend for directional bias determination, Squeeze Momentum for volatility analysis, and various exponential moving averages for trend confirmation. Each component contributes specific market insights while the unified system provides comprehensive market evaluation through their mathematical integration.
The multi-component approach reduces dependency on individual indicator limitations while leveraging the analytical strengths of each technical tool. This creates a robust analytical framework capable of adapting to diverse market conditions through appropriate mode selection and parameter optimization, ensuring consistent performance across varying market environments.
Market State Classification
The indicator incorporates advanced market state classification through ADX analysis, distinguishing between trending, ranging, and transitional market conditions. This classification system automatically adjusts signal sensitivity and filtering parameters based on current market characteristics, optimizing performance for prevailing conditions rather than applying static analytical approaches.
The volatility measurement system calculates current market activity levels as percentages, providing quantitative assessment of market energy and helping traders select appropriate operational modes. Institutional activity detection through volume analysis ensures signal generation aligns with professional market participation patterns.
Implementation Strategy Considerations
Successful implementation requires careful matching of operational modes to prevailing market conditions and individual trading objectives. Trending modes demonstrate optimal performance during directional markets with sustained momentum characteristics, while contrarian modes excel during range-bound or overextended market conditions where reversal probability increases.
The cloud filter configurations provide varying degrees of confirmation strength, with smoother settings reducing false signal occurrence at the expense of some responsiveness to price changes. Traders must balance signal quality against signal frequency based on their risk tolerance and available trading time, utilizing the comprehensive customization options to optimize performance for their specific requirements.
Multi-Timeframe Integration
The system provides seamless multi-timeframe analysis through the integrated dashboard, displaying trend alignment across multiple time horizons from five-minute through four-hour periods. This analysis helps traders understand broader market context and avoid conflicts between different temporal perspectives that could compromise trade outcomes.
Session analysis identifies current trading session characteristics, providing context for expected market behavior patterns and helping traders adjust their approach based on typical session volatility and participation levels. This geographic market awareness enhances strategic decision-making and improves timing for trade execution.
Advanced Visualization Features
The indicator includes sophisticated visualization capabilities through gradient candle coloring based on MACD analysis, providing immediate visual feedback on momentum strength and direction. This enhancement allows rapid market assessment without requiring detailed indicator analysis, improving efficiency for traders managing multiple instruments simultaneously.
The cloud visualization system uses color-coded fill areas to clearly indicate trend direction and strength, with automatic adaptation to selected operational modes. This visual clarity reduces analytical complexity while maintaining comprehensive market information display through professional chart presentation.
Performance Optimization Framework
The Fresh Algo V24 incorporates performance optimization features including signal strength classification, automatic parameter adjustment based on market conditions, and dynamic filtering that adapts to current volatility levels. These optimizations ensure consistent performance across varying market environments while maintaining signal quality standards.
The system automatically adjusts sensitivity levels based on selected operational modes, ensuring appropriate responsiveness for different trading approaches. This adaptive framework reduces the need for manual parameter adjustments while maintaining optimal performance characteristics for each operational configuration.
Conclusion
The Mutanabby_AI Fresh Algo V24 represents a comprehensive solution for professional trading analysis, combining multiple analytical approaches with advanced visualization and risk management capabilities. The system's strength lies in its adaptive multi-mode design and sophisticated filtering mechanisms, providing traders with versatile tools for various market conditions and trading styles.
Success with this system requires understanding the relationship between different operational modes and their optimal application scenarios. The comprehensive dashboard and alert system provide essential market context and trade management support, enabling systematic approach to market analysis while maintaining flexibility for individual trading preferences.
The indicator's sophisticated architecture and extensive customization options make it suitable for traders at all experience levels, from those seeking systematic signal generation to advanced practitioners requiring comprehensive market analysis tools. The multi-timeframe integration and adaptive filtering ensure consistent performance across diverse market conditions while providing clear guidelines for strategic implementation.

Smart Money Gap [Algo Seeker]Introduction – Originality and usefulness
It is important for traders to diversify their strategies, and having a few approaches for different situations is key to increasing their odds of success.
These days, substantial information and important events happen so fast and so often that all the noise created afterward makes people forget the events that were actually worth remembering.
The same can be said about trading and investing. Every day, there seems to be something new happening and new price action unfolding, which can make it difficult for traders to filter out the noise and stay focused on relevant events. But for every problem, a solution can be born.
🟠 Unique Features & Trading Benefits
The SMG aims to be a system that helps traders filter out what it deems to be irrelevant noise and stay focused on what matters most. In addition, SMG provides multiple plans and ways to act on that information.
The reason it’s called “Smart Money Gap” is because this algorithm is designed to identify the most relevant price action—whether it's earnings, an economic calendar event, a stock-specific development, major news, or institutional activity. It determines which of these situations is the most current and relevant, and it keeps the focus on that. This means that day in and day out, traders and investors can rely on a consistent plan and framework that is automatically drawn up for them, helping them trade with confidence that they’re acting on meaningful price levels. When the algorithm identifies a new event as more important, it will switch focus and build a new system around that.
SMG also goes a step further—it understands that different types of traders, such as scalpers, swing traders, or investors, have different time horizons and risk tolerance regarding how long they plan to hold a position and how much space and time they are willing to give a move. With that in mind, SMG provides different trading modes for these personas, selecting events that match the criteria needed for that specific trader.
For instance, a scalper may benefit from a smaller, more recent event that provides quick entry and exit opportunities—whereas an investor might focus on something more significant and long-term. SMG takes this into consideration and builds its entire framework accordingly.
🟠 Description of the Unique SMG (Continued) – How It Works Together as One System
The true power of SMG begins once a relevant event is identified, and the entire system is automatically displayed on the user’s chart. From that single event, SMG generates a structured framework that produces three distinct strategies. Each of these strategies takes inspiration from fundamentals within trading but gives it our own unique twist inside the SMG system. These strategies can be used individually or in combination, depending on the trader’s style and market context.
🟢 1. Filling the Smart Money Gap
One of the key opportunities is to trade the SMG itself—the “gap” created by the specific event. Gap fills are a strategy that traders and investors like to use. SMG continuously tracks how much of this unique gap has been filled, so users are never confused about how much remains. They can reference the shaded region or the percentage-left box for clarity.
🟢 2. Targeting SMG-Based Extensions and Retracements
When the SMG zone is created, the algorithm simultaneously generates extension and retracement levels tied to that event. These levels remain anchored to the original structure, providing consistent, event-driven targets. Unlike the constantly redrawn lines many traders adjust throughout the day, these levels stay fixed and reflect meaningful price action—not noise.
🟢 3. Executing Trades Based on SMG Volume
Because SMGs are tied to meaningful events, they often remain valid for an extended time. This is where Anchored VWAP becomes critical. From the moment the event occurs, SMG begins calculating volume-based data. The longer the event goes unchanged, the more powerful and influential the Anchored VWAP and its deviation bands become—due to the increasing accumulation of volume over time. These volume layers not only help refine entries and exits—they also serve as additional points of confluence where traders can place stops, take profits, or re-enter trades with greater context and confidence.
In conclusion:
SMG is designed to help traders diversify their portfolio of strategies even further. It creates an entire system that filters out noise and builds a strategy around a key event—and it will stay focused on that event until another becomes more relevant. SMG gives traders the ability to react calmly, with a plan that is automatically laid out for them. This is a special algorithm that we’ve incorporated into our approach for over three years, and we hope users will find it to be a valuable aid in their trading journey.
🟠 How to Use
Initial Setup
🟢 1. Select Trading Mode:
Choose from six built-in personas—Scalp 1, Scalp 2, Swing 1, Swing 2, Invest 1, and Invest 2—based on your trading style. Each persona adjusts the SMG logic to fit the risk profile and time horizon of that specific persona.
1. Scalp: For intraday movements (minutes to hours)
• Best used on faster charts (1-minute to 30-minute)
2. Swing: For medium-term positions (days to weeks)
• Best used on 1-hour to daily charts
3. Investor: For longer-term positions (weeks to months)
• Best used on 1-hour to daily charts
🟢 2. Choose SMG Update Behavior: Bar Close vs Live Update:
By default, SMG waits until all conditions are met and the bar closes before updating. This ensures confirmed structure and helps avoid noise or repainting.
If “Update Before Bar Closes?” is selected, the algorithm updates as soon as all conditions are met — even if the bar hasn’t closed yet. This allows earlier updates but may result in elements that repaint if the conditions don’t hold through the close.
Keep this setting unchecked if you prefer confirmed, non-repainting elements.
🟢 3. Visual Customization:
Customize the appearance of SMG zones, extension labels, and volume-derived levels via the “SMG Zone” and “Anchored VWAP” settings groups. This includes:
1. Zone colors and opacity
2. Label positions
3. Retracement display toggle
4. Anchored VWAP and ±1, ±2, ±3 deviation bands
Extra Notes on User Customization:
• Bull Box Color – the color used when SMG retracement is active
• Final Bull Box Color – the color used when SMG retracement is finished
• Same logic applies to Bear Box Color and Final Bear Box Color
• Retracement % Label – If the label is hard to see, it may be overlapping with the Fib labels depending on your chart zoom. To adjust, bring the Retracement % Label Indent closer to 1 to shift it left. Then increase the Fib Label Indent value to move those labels further right.
🟠 Strategic Execution
Strategy Usage Example
🟢 1. Entry & Exit Tactics Within the SMG
Use the shaded Smart Money Gap as a decision-making framework. Traders may choose to:
1. Fade a retracement (shorting or exiting as price retraces into the SMG)
2. Enter on signs of continuation (rejoining the move after a partial retrace)
3. Wait for the gap to fill completely and reverse
Volume-weighted Anchored VWAP levels add an additional layer—helping assess whether price is entering or rejecting volume consensus zones.
🟢 2. Extension Targeting:
When price resumes in the original direction, SMG plots potential extension levels. These can be used to:
1 Set take-profit or stop-loss targets
2. Spot exhaustion areas
3 Evaluate whether to scale in, take partial profits, or re-enter a position
🟢 3. Volume-Based Execution via Anchored VWAP:
For traders looking to incorporate volume into execution—especially when an SMG has remained active for an extended period—Anchored VWAP and its deviation bands can be used to:
1. Confirm direction or momentum via VWAP slope and interaction
2. Enter or fade positions at volume-backed levels
3. Set dynamic entries or exits as volume builds or thins across deviations
⚠️Optional Update Behavior: Bar Close vs Live Update
By default, SMG waits until all conditions are met and the bar closes before updating. This ensures confirmed structure and helps avoid noise or repainting.
If “Update Before Bar Closes?” is selected, the algorithm updates as soon as all conditions are met — even if the bar hasn’t closed yet. This allows earlier updates but may result in elements that repaint if the conditions don’t hold through the close.
Keep this setting unchecked if you prefer confirmed, non-repainting elements.
⚠️ Interpreting Anchored VWAP Behavior
Anchored VWAP and its deviation bands become more relevant with time as they widen and separate. While tight and accumulating near price, it may be worth holding off on using VWAP for entries or exits until expansion begins.
🟠 Additional Description – SMG Table Overview
The SMG table presents four key pieces of information to help traders quickly understand the current setup at a glance:
1) If the Algo is set for dynamic or bar close
2) Which trading mode they currently have selected
3) What type of SMG gap is displayed
4) how much of the Retracement is done
🟠 Additional Benefits:
🟢 1. Risk Profile Options
Trading personas allow users to instantly switch between different risk profiles—Scalp, Swing, or Investor—at the click of a button. This helps traders quickly align the system to their preferred holding period and risk tolerance without reconfiguring inputs.
🟢 2. Time Efficiency
SMG saves traders time by creating a complete system around each Smart Money Gap. From gap logic to retracement tracking, extension targets, and volume levels—everything needed to trade the SMG is generated at once, eliminating the need for manual setup or separate tools.
The Smart Money Gap represents years of development and refinement aimed at creating a unified, event-driven trading system. It was designed to help traders manage through the constant noise of the market, and we hope that traders benefit from having an additional tool to support and diversify their trading strategy.

DTFX Algo Zones [SamuraiJack Mod]CME_MINI:NQ1!
Credits
This indicator is a modified version of an open-source tool originally developed by Lux Algo. I literally modded their indicator to create the DTFX Algo Zones version, incorporating additional features and refinements. Special thanks to Lux Algo for their original work and for providing the open-source code that made this development possible.
Introduction
DTFX Algo Zones is a technical analysis indicator designed to automatically identify key supply and demand zones on your chart using market structure and Fibonacci retracements. It helps traders spot high-probability reversal areas and important support/resistance levels at a glance. By detecting shifts in market structure (such as Break of Structure and Change of Character) and highlighting bullish or bearish zones dynamically, this tool provides an intuitive framework for planning trades. The goal is to save traders time and improve decision-making by focusing attention on the most critical price zones where market bias may confirm or reverse.
Logic & Features
• Market Structure Shift Detection (BOS & CHoCH): The indicator continuously monitors price swings and marks significant structure shifts. A Break of Structure (BOS) occurs when price breaks above a previous swing high or below a swing low, indicating a continuation of the current trend. A Change of Character (ChoCH) is detected when price breaks in the opposite direction of the prior trend, often signaling an early trend reversal. These moments are visually marked on the chart, serving as anchor points for new zones. By identifying BOS and ChoCH in real-time, the DTFX Algo Zones indicator ensures you’re aware of key trend changes as they happen.
• Auto-Drawn Fibonacci Supply/Demand Zones: Upon a valid structure shift, the indicator plots a Fibonacci-based zone between the breakout point and the preceding swing high/low (the source of the move). This creates a shaded area or band of Fibonacci retracement levels (for example 38.2%, 50%, 61.8%, etc.) representing a potential support zone in an uptrend or resistance zone in a downtrend. These supply/demand zones are derived from the natural retracement of the breakout move, highlighting where price is likely to pull back. Each zone is essentially an auto-generated Fibonacci retracement region tied to a market structure event, which traders can use to anticipate where the next pullback or bounce might occur.
• Dynamic Bullish and Bearish Zones: The DTFX Algo Zones indicator distinguishes bullish vs. bearish zones and updates them dynamically as new price action unfolds. Bullish zones (formed after bullish BOS/ChoCH) are typically highlighted in one color (e.g. green or blue) to indicate areas of demand/support where price may bounce upward. Bearish zones (formed after bearish BOS/ChoCH) are shown in another color (e.g. red/orange) to mark supply/resistance where price may stall or reverse downward. This color-coding and real-time updating allow traders to instantly recognize the market bias: for instance, a series of bullish zones implies an uptrend with multiple support levels on pullbacks, while consecutive bearish zones indicate a downtrend with resistance overhead. As old zones get invalidated or new ones appear, the chart remains current with the latest key levels, eliminating clutter from outdated levels.
• Flexible Customization: The indicator comes with several options to tailor the zones to your trading style. You can filter which zones to display – for example, show only the most recent N zones or limit to only bullish or only bearish zones – helping declutter the chart and focus on recent, relevant levels. There are settings to control zone extension (how far into the future the zones are drawn) and to automatically invalidate zones once they’re no longer relevant (for instance, if price fully breaks through a zone or a new structure shift occurs that supersedes it). Additionally, the Fibonacci retracement levels within each zone are customizable: you can choose which retracement percentages to plot, adjust their colors or line styles, and decide whether to fill the zone area for visibility. This flexibility ensures the DTFX Algo Zones can be tuned for different markets and strategies, whether you want a clean minimalist look or detailed zones with multiple internal levels.
Best Use Cases
DTFX Algo Zones is a versatile indicator that can enhance various trading strategies. Some of its best use cases include:
• Identifying High-Probability Reversal Zones: Each zone marks an area where price has a higher likelihood of stalling or reversing because it reflects a significant prior swing and Fibonacci retracement. Traders can watch these zones for entry opportunities when the market approaches them, as they often coincide with order block or strong supply/demand areas. This is especially useful for catching trend reversals or pullbacks at points where risk is lower and potential reward is higher.
• Spotting Key Support and Resistance: The automatically drawn zones act as dynamic support (below price) and resistance (above price) levels. Instead of manually drawing Fibonacci retracements or support/resistance lines, you get an instant map of the key levels derived from recent price action. This helps in quickly identifying where the next bounce (support) or rejection (resistance) might occur. Swing traders and intraday traders alike can use these zones to set alerts or anticipate reaction areas as the market moves.
• Trend-Following Entries: In a trending market, the indicator’s zones provide ideal areas to join the trend on pullbacks. For example, in an uptrend, when a new bullish zone is drawn after a BOS, it indicates a fresh demand zone – buying near the lower end of that zone on a pullback can offer a low-risk entry to ride the next leg up. Similarly, in a downtrend, selling rallies into the highlighted supply zones can position you in the direction of the prevailing trend. The zones effectively serve as a roadmap of the trend’s structure, allowing trend traders to buy dips and sell rallies with greater confidence.
• Mean-Reversion and Range Trading: Even in choppy or range-bound markets, DTFX Algo Zones can help find mean-reversion trades. If price is oscillating sideways, the zones at extremes of the range might mark where momentum is shifting (ChoCH) and price could swing back toward the mean. A trader might fade an extended move when it reaches a strong zone, anticipating a reversion. Additionally, if multiple zones cluster in an area across time (creating a zone overlap), it often signifies a particularly robust support/resistance level ideal for range trading strategies.
In all these use cases, the indicator’s ability to filter out noise and highlight structurally important levels means traders can focus on higher-probability setups and make more informed trading decisions.
Strategy – Pullback Trading with DTFX Algo Zones
One of the most effective ways to use the DTFX Algo Zones indicator is trading pullbacks in the direction of the trend. Below is a step-by-step strategy to capitalize on pullbacks using the zones, combining the indicator’s signals with sound price action analysis and risk management:
1. Identify a Market Structure Shift and Trend Bias: First, observe the chart for a recent BOS or ChoCH signal from the indicator. This will tell you the current trend bias. For instance, a bullish BOS/ChoCH means the market momentum has shifted upward (bullish bias), and a new demand zone will be drawn. A bearish structure break indicates downward momentum and creates a supply zone. Make sure the broader context supports the bias (e.g., if multiple higher timeframe zones are bullish, focus on long trades).
2. Wait for the Pullback into the Zone: Once a new zone appears, don’t chase the price immediately. Instead, wait for price to retrace back into that highlighted zone. Patience is key – let the market come to you. For a bullish setup, allow price to dip into the Fibonacci retracement zone (demand area); for a bearish setup, watch for a rally into the supply zone. Often, the middle of the zone (around the 50% retracement level) can be an optimal area where price might slow down and pivot, but it’s wise to observe price behavior across the entire zone.
3. Confirm the Entry with Price Action & Confluence: As price tests the zone, look for confirmation signals before entering the trade. This can include bullish reversal candlestick patterns (for longs) or bearish patterns (for shorts) such as engulfing candles, hammers/shooting stars, or doji indicating indecision turning to reversal. Additionally, incorporate confluence factors to strengthen the setup: for example, check if the zone overlaps with a key moving average, a round number price level, or an old support/resistance line from a higher timeframe. You might also use an oscillator (like RSI or Stochastic) to see if the pullback has reached oversold conditions in a bullish zone (or overbought in a bearish zone), suggesting a bounce is likely. The more factors aligning at the zone, the more confidence you can have in the trade. Only proceed with an entry once you see clear evidence of buyers defending a demand zone or sellers defending a supply zone.
4. Enter the Trade and Manage Risk: When you’re satisfied with the confirmation (e.g., price starts to react positively off a demand zone or shows rejection wicks in a supply zone), execute your entry in the direction of the original trend. Immediately set a stop-loss order to control risk: for a long trade, a common placement is just below the demand zone (a few ticks/pips under the swing low that formed the zone); for a short trade, place the stop just above the supply zone’s high. This way, if the zone fails and price continues beyond it, your loss is limited. Position size the trade so that this stop-loss distance corresponds to a risk you are comfortable with (for example, 1-2% of your trading capital).
5. Take Profit Strategically: Plan your take-profit targets in advance. A conservative approach is to target the origin of the move – for instance, in a long trade, you might take profit as price moves back up to the swing high (the 0% Fibonacci level of the zone) or the next significant zone or resistance level above. This often yields at least a 1:1 reward-to-risk ratio if you entered around mid-zone. More aggressive trend-following traders may leave a portion of the position running beyond the initial target, aiming for a larger move in line with the trend (for example, new higher highs in an uptrend). You can also trail your stop-loss upward behind new higher lows (for longs) or lower highs (for shorts) as the trend progresses, locking in profit while allowing for further gains.
6. Monitor Zone Invalidation: Even after entering, keep an eye on the behavior around the zone and any new zones that may form. If price fails to bounce and instead breaks decisively through the entire zone, respect that as an invalidation – the market may be signaling a deeper reversal or that the signal was false. In such a case, it’s better to exit early or stick to your stop-loss than to hold onto a losing position. The indicator will often mark or no longer highlight zones that have been invalidated by price, guiding you to shift focus to the next opportunity.
Risk Management Tips:
• Always use a stop-loss and don’t move it farther out in hope. Placing the stop just beyond the zone’s far end (the swing point) helps protect you if the pullback turns into a larger reversal.
• Aim for a favorable risk-to-reward ratio. With pullback entries near the middle or far end of a zone, you can often achieve a reward that equals or exceeds your risk. For example, risking 20 pips to make 20+ pips (1:1 or better) is a prudent starting point. Adjust targets based on market structure – if the next resistance is 50 pips away, consider that upside against your risk.
• Use confluence and context: Don’t take every zone signal in isolation. The highest probability trades come when the DTFX Algo Zone aligns with other analysis (trend direction, chart patterns, higher timeframe support/resistance, etc.). This filtered approach will reduce trades taken in weak zones or counter-trend traps.
• Embrace patience and selectivity: Not all zones are equal. It can be wise to skip very narrow or insignificant zones and wait for those that form after a strong BOS/ChoCH (indicating a powerful move). Larger zones or zones formed during high-volume times tend to produce more reliable pullback opportunities.
• Review and adapt: After each trade, note how price behaved around the zone. If you notice certain Fib levels (like 50% or 61.8%) within the zone consistently provide the best entries, you can refine your approach to focus on those. Similarly, adjust the indicator’s settings if needed – for example, if too many minor zones are cluttering your screen, limit to the last few or increase the structure length parameter to capture only more significant swings.
⸻
By combining the DTFX Algo Zones indicator with disciplined confirmation and risk management, traders can improve their timing on pullback entries and avoid chasing moves. This indicator shines in helping you trade what you see, not what you feel – the clearly marked zones and structure shifts keep you grounded in price action reality. Whether you’re a trend trader looking to buy the dip/sell the rally, or a reversal trader hunting for exhaustion points, DTFX Algo Zones provides a robust visual aid to elevate your trading decisions. Use it as a complementary tool in your analysis to stay on the right side of the market’s structure and enhance your trading performance.

Swing [SMRT Algo]The SMRT Algo Swing indicator is a tool tailored for swing trading, designed to provide traders with insights and entry points on higher timeframes, such as the 1-hour (1H) chart and above. This indicator incorporates a range of features to enhance both trend identification and risk management.
Features:
Bar Colors: The indicator employs a straightforward color-coding system to denote market trends: red bars indicate a bearish trend, and green bars indicate a bullish trend. This immediate visual representation aids traders in quickly discerning the prevailing market direction, facilitating swift decision-making.
Buy & Sell Signals: SMRT Algo Swing generates distinct buy and sell signals categorized into two levels, weak and strong.
- Weak Signals: These signals are generated when the basic entry criteria are met. They serve as early alerts to potential trading opportunities, suitable for traders willing to take on more risk or those employing a more aggressive trading strategy.
- Strong Signals: Generated when additional, more stringent conditions are satisfied, these signals indicate higher-probability trade setups.
EMA Filter: The Exponential Moving Average (EMA) filter is a feature that facilitates trend trading. When turned on, the filter ensures that only signals that align with the prevailing trend are displayed. This helps in avoiding counter-trend trades, which can be riskier and less reliable. The EMA length is customizable, allowing traders to adjust the sensitivity of trend detection based on their trading style and market conditions.
Take Profit & Stop Loss Levels: TP & SL levels are pre-calculated based on a risk-reward ratio:
- TP1: Indicates a conservative 1:1 risk-reward ratio, suitable for quick profit-taking. Goes up to TP3. This approach to TP and SL can help traders define their risk exposure clearly and set realistic profit targets.
Strong signals are designed to provide highly accurate entry points, often referred to as "sniper entries," due to their precision in aligning with market trends. The option to display weak, strong, or both types of signals allows traders to tailor the indicator to their specific trading preferences and risk profiles.
Input Settings:
Bar Color: Bar colors can be turned on/off. Green candles show a bullish market/trend, while red candles show bearish.
Signal: Choose to show either only Strong/Weak/Both buy & sell signals.
Lookback Period: The higher the lookback period, the less frequent the signals. Adjusting this value affects the frequency of the buy sell signals.
EMA Filter: Trend filter can be turned on/off. If on, it will only show buy signals that are above the EMA, and sell signals that are below the EMA.
Timeframe: EMA timeframe can be adjusted, i.e. to view higher timeframe trends.
Length: Used to adjust EMA length. A smaller value means that EMA is more susceptible to market movements.
TP/SL: The take profit & stop loss zones can be turned on/off. The size of TP/SL can also be adjusted by increasing or decreasing the multiplier and length values.
EMA Filter Off:
EMA Filter On:
We recommend traders use this indicator on timeframes 1H and above, with the goal of holding trades over a longer period of time (days, weeks, months) to maximize the market moves.
The integration of these features ensures that the SMRT Algo Swing indicator functions as a cohesive and robust tool for swing traders. The color-coded bars provide an at-a-glance trend overview, which is crucial for context. The buy/sell signals, especially the strong signals, offer entry points that are carefully vetted by the indicator's algorithms. The EMA filter adds a layer of trend confirmation, ensuring that trades are not only timely but also in line with the broader market trend, thereby enhancing the likelihood of success. The TP and SL levels serve as a built-in risk management system, guiding traders on optimal exit points and helping to protect against significant losses.
The SMRT Algo Suite, which the Swing indicator is a part of, offers a comprehensive set of tools and features that extend beyond the capabilities of standard or open-source indicators, providing significant additional value to users.
What you also get with the SMRT Algo Suite:
Advanced Customization: Users can customize various aspects of the indicator, such as toggling the confirmation signals on or off and adjusting the parameters of the MA Filter. This customization enhances the adaptability of the tool to different trading styles and market conditions.
Enhanced Market Understanding: The combination of pullback logic, dynamic S/R zones, and MA filtering offers traders a nuanced understanding of market dynamics, helping them make more informed trading decisions.
Unique Features: The specific combination of pullback logic, dynamic S/R, and multi-level TP/SL management is unique to SMRT Algo, offering features that are not readily available in standard or open-source indicators.
Educational and Support Resources: As with other tools in the SMRT Algo suite, this indicator comes with comprehensive educational resources and access to a supportive trading community, as well as 24/7 Discord support.
The educational resources and community support included with SMRT Algo ensure that users can maximize the indicators’ potential, offering guidance on best practices and advanced usage.
SMRT Algo believe that there is no magic indicator that is able to print money. Indicator toolkits provide value via their convenience, adaptability and uniqueness. Combining these items can help a trader make more educated; less messy, more planned trades and in turn hopefully help them succeed.
RISK DISCLAIMER
Trading involves significant risk, and most day traders lose money. All content, tools, scripts, articles, and educational materials provided by SMRT Algo are intended solely for informational and educational purposes. Past performance is not indicative of future results. Always conduct your own research and consult with a licensed financial advisor before making any trading decisions.

Universal Algorithm [BackQuant]Universal Algorithm
It is a trading strategy designed CLEAR TREND DETECTION . This script is the culmination of extensive research and development efforts aimed at providing traders with a robust tool capable of adapting to a wide array of market conditions. This description delves into the core components, methodologies, and operational parameters of Universal Algo to offer potential users a clear understanding of its functionalities and the principles underpinning its design.
Core Methodologies and Features:
Integrated Systems: Universal Algo is built around six core systems, each contributing unique analytical perspectives to enhance trade signal reliability. These systems are designed to identify clear trend opportunities for significant gains, while also employing logic to navigate through ranging markets effectively.
Adaptive Market Logic: By incorporating volatility metrics, the algorithm dynamically adjusts to changing market conditions. This ensures that the strategy remains effective across different market regimes, aiming to reduce market noise and improve signal quality.
Selective Shorting Mechanism: While the primary focus is on capturing long positions, it includes an optional shorting feature. This can be activated by users to adapt the strategy during macro downtrends, thus providing a flexible approach to market participation.
Backtesting and Forward-Testing Rigor : The strategy has undergone rigorous testing to validate its performance and reliability. It demonstrates prudent risk management by optimizing conditions under which short positions are considered, aiming to mitigate drawdowns and preserve capital.
Operational Parameters:
Customization Options: The script offers a range of user inputs, allowing for customization of the backtesting starting date, the decision to display the strategy equity curve, among other settings. These inputs cater to diverse trading needs and preferences, offering users control over their strategy implementation.
Transparency and Logic Insight: While specific calculation details and proprietary indicators are integral to maintaining the uniqueness of Universal Algo , the strategy is grounded on well-established financial analysis techniques. These include momentum analysis, volatility assessments, and adaptive thresholding, among others, to formulate its trade signals.
Realistic Trading Conditions : Backtesting, considered realistic trading conditions, including appropriate account size, commission, slippage, and sustainable risk levels per trade. The strategy is designed and tested with a focus on achieving a balance between risk and reward, striving for robustness and reliability rather than unrealistic profitability promises.
Concluding Thoughts:
Universal Algo is offered to the TradingView community as a tool for traders seeking to enhance their market analysis and trading strategies. Its development is driven by a commitment to quality, innovation, and adaptability, aiming to provide valuable insights and decision-support in various market conditions. Potential users are encouraged to evaluate Universal Algo within the context of their overall trading approach and objectives.

Hulk Grid Algorithm V2 - The Quant ScienceIt's the latest proprietary grid algorithm developed by our team. This software represents a clearer and more comprehensive modernization of the deprecated Hulk Grid Algorithm. In this new release, we have optimized the source code architecture and investment logic, which we will describe in detail below.
Overview
Hulk Grid Algorithm V2 is designed to optimize returns in sideways market conditions. In this scenario, the algorithm divides purchases with long orders at each level of the grid. Unlike a typical grid algorithm, this version applies an anti-martingale model to mitigate volatility and optimize the average entry price. Starting from the lower level, the purchase quantity is increased at each new subsequent level until reaching the upper level. The initial quantity of the first order is fixed at 0.50% of the initial capital. With each new order, the initial quantity is multiplied by a value equal to the current grid level (where 1 is the lower level and 10 is the upper level).
Example: Let's say we have an initial capital of $10,000. The initial capital for the first order would be $50 * 1 = $50, for the second order $50 * 2 = $100, for the third order $50 * 3 = $150, and so on until reaching the upper level.
All previously opened orders are closed using a percentage-based stop-loss and take-profit, calculated based on the extremes of the grid.
Set Up
As mentioned earlier, the user's goal is to analyze this strategy in markets with a lack of trend, also known as sideways markets. After identifying a price range within which the asset tends to move, the user can choose to create the grid by placing the starting price at the center of the range. This way, they can consider trading the asset, if the backtesting generates a return greater than the Buy & Hold return.
Grid Configuration
To create the grid, it's sufficient to choose the starting price during the launch phase. This level will be the center of the grid from which the upper and lower levels will be calculated. The grid levels are computed using an arithmetic method, adding and subtracting a configurable fixed amount from the user interface (Grid Step $).
Example: Let's imagine choosing 1000 as the starting price and 50 as the Grid Step ($). The upper levels will be 1000, 1050, 1100, 1150, 1200. The lower levels will be 950, 900, 850, 800, and 750.
Markets
This software can be used in all markets: stocks, indices, commodities, cryptocurrencies, ETFs, Forex, etc.
Application
With this backtesting software, is possible to analyze the strategy and search for markets where it can generate better performance than Buy & Hold returns. There are no alerts or automatic investment mechanisms, and currently, the strategy can only be executed manually.
Design
Is possible to modify the grid style and customize colors by accessing the Properties section of the user interface.

Volatility Compression Breakout - LeafAlgo Pro StrategyThe Volatility Compression Breakout strategy is designed to identify periods of low volatility followed by potential breakout opportunities in the market. It aims to capture moments when the price consolidates within a narrow range, indicating a decrease in volatility, and anticipates a subsequent expansion in price movement. This strategy is based on our indicator of the same name (), but differs by offering many more options for the band/channel type and trend filters in addition to implementing the ability to use this strategy with algorithmic plug-ins (see details at the bottom).
This strategy features six types of bands/channels and five types of trend filters, for a total of 30 combinations. The six band/channel types are the Adaptive Gaussian MA channel (based on the Adaptive Gaussian MA that we previously published ()), standard Bollinger Bands, smoothed Bollinger Bands (basis is an EMA of the typical Bollinger Basis), Keltner Channels, a Quadratic Regression Channel (based on the channel that we previously published in the LeafAlgo Pro indicator ()), and Volatility-Based Mean Reversion Bands (). The five trend filters include an EMA, SMA, Weighted MA, McGinley Dynamic, and the Adaptive Gaussian MA itself.
Examples of the different band/channel types (all with EMA as the trend filter):
Adaptive Gaussian MA Channel:
Bollinger Bands:
Smoothed Bollinger Bands:
Keltner Channels:
Quadratic Regression Channel:
Volatility-Based Mean Reversion Bands:
Examples of the different trend filters (all with Keltner Channels):
EMA:
SMA:
WMA:
McGinley Dynamic:
Adaptive Gaussian MA:
How the Long/Short Entry Signals are Calculated:
A breakout signal upwards, accompanied by a long entry, is created when the high is greater than the secondary upper band (the upper band plus a standard deviation or with a multiplier, depending on which band/channel type is selected), the latest close is above the trend filter line, and the previous close was below the trend filter line. A break downwards, accompanied by a short entry, is created when the low is below the secondary lower band, the close is below the trend filter line, and the previous close was above the trend filter line. These conditions, along with a confirmed barstate, make up the strategy entry signals.
Coloration:
When the close price is above both the middle/basis and the trend filter, the bars are colored lime green, indicating a potential bullish market sentiment. When the close price is positioned above the basis but below the trend filter, or below the basis but above the trend filter, the bars are colored yellow, signifying a neutral or indecisive market condition. Conversely, when the close price falls below both the basis and the trend filter, the bars are colored fuchsia, suggesting a potential bearish market sentiment. Additionally, the coloration of the middle/basis line and the trend filter provides further visual cues for assessing the trend. When the close price is above the basis, the line is colored lime green, indicating a bullish trend. Conversely, when the close price is below the basis, the line is colored fuchsia, highlighting a bearish trend. Similarly, the trend line is colored lime green when the close price is above it, representing a bullish trend, and fuchsia when the close price is below it, indicating a bearish trend. The fill between the primary and secondary upper bands is colored lime and the fill between the primary and secondary lower bands is colored fuchsia. These colorations can be toggled on/off in the strategy settings menu.
How Changing Parameters Can Be Beneficial:
Modifying the parameters allows you to adapt the indicator to different market conditions and trading styles. For example, with Keltner Channels, increasing the compression period can help identify broader volatility patterns and major market shifts. On the other hand, decreasing the compression period provides more precise and timely signals for short-term traders. Adjusting the compression multiplier affects the width of the Keltner Channels. Higher multipliers increase the breakout threshold, filtering out smaller price movements and providing more reliable signals during significant market shifts. Lower multipliers make the indicator more sensitive to smaller price ranges, generating more frequent but potentially less reliable signals.
Changing the type of trend filter can drastically change your results. Test out each trend filter type and determine which one will work best for your purposes. Further, the MA periods in the trend filter settings can help you align your trades with the prevailing market direction. Increasing the period smoothes out the trend, filtering out shorter-term fluctuations and focusing on more sustained moves. Decreasing the period allows for quicker responses to changes in trend, capturing shorter-term price swings.
By adjusting the parameters and incorporating additional analysis techniques, you can customize the strategy to suit your trading style and preferences. However, it is crucial to exercise caution, conduct thorough analysis, and practice proper risk management to increase the likelihood of successful trades. Remember that no strategy can guarantee profits, and continuous learning and adaptation are key to long-term trading success.
Take Profit/Stop Loss Settings:
Take profit, stop loss, and trailing percentages are also included, found at the bottom of the Input tab under “TT and TTP” as well as “Stop Loss”. The take profit and stop loss levels will be reflected as green and red lines respectively on the chart as they occur. Make sure to understand the TP/SL ratio that you desire before use, as the desired hit rate/profitability percentage will be affected accordingly. The option for adding in a trailing stop has also been included, with options to choose between an ATR-based trail or a percentage-based trail. This strategy does NOT guarantee future returns. Apply caution in trading regardless of discretionary or algorithmic. Understand the concepts of risk/reward and the intricacies of each strategy choice before utilizing them in your personal trading.
Profitview/Pineconnector Settings:
If you wish to utilize Profitview’s automation system, find the included “Profitview Settings” under the Input tab of the strategy settings menu. If not, skip this section entirely as it can be left blank. Options will be “OPEN LONG TITLE”, “OPEN SHORT TITLE”, “CLOSE LONG TITLE”, and “CLOSE SHORT TITLE”. If you wished to trade SOL, for example, you would put “SOL LONG”, “SOL SHORT”, “SOL CLOSE LONG”, and “SOL CLOSE SHORT” in these areas. Within your Profitview extension, ensure that your Alerts all match these titles. To set an alert for use with Profitview, go to the “Alerts” tab in TradingView, then create an alert. Make sure that your desired asset and timeframe are currently displayed on your screen when creating the alert. Under the “Condition” option of the alert, select the strategy, then select the expiration time. If using TradingView Premium, this can be open-ended. Otherwise, select your desired expiration time and date. This can be updated whenever desired to ensure the strategy does not expire. Under “Alert actions”, nothing necessarily needs to be selected unless so desired. Leave the “Alert name” option empty. For the “Message”, delete the generated message and replace it with {{strategy.order.alert_message}} and nothing else. If using Pineconnector, follow the same directions for setting up an alert, but use the ",buy,,risk=" syntax as noted in the tooltips.
Additional Sample Settings (for ETHUSDT-Binance 45M):
Band/Channel Type - Keltner Channels (Compression Period of 20, Multiplier of 1.8x)
Trend Filter - WMA (50 length, no offset, close as the source)
TP/SL - 3.0% TP / 2.0% SL, 0.005 trailed TP, no trailed SL

Grid Spot Trading Algorithm V2 - The Quant ScienceGrid Spot Trading Algorithm V2 is the last grid trading algorithm made by our developer team.
Grid Spot Trading Algorithm V2 is a fixed 10-level grid trading algorithm. The grid is divided into an accumulation area (red) and a selling area (green).
In the accumulation area, the algorithm will place new buy orders, selling the long positions on the top of the grid.
BUYING AND SELLING LOGIC
The algorithm places up to 5 limit orders on the accumulation section of the grid, each time the price cross through the middle grid. Each single order uses 20% of the equity.
Positions are closed at the top of the grid by default, with the algorithm closing all orders at the first sell level. The exit level can be adjusted using the user interface, from the first level up to the fifth level above.
CONFIGURING THE ALGORITHM
1) Add it to the chart: Add the script to the current chart that you want to analyze.
2) Select the top of the grid: Confirm a price level with the mouse on which to fix the top of the grid.
3) Select the bottom of the grid: Confirm a price level with the mouse on which to fix the bottom of the grid.
4) Wait for the automatic creation of the grid.
USING THE ALGORITHM
Once the grid configuration process is completed, the algorithm will generate automatic backtesting.
You can add a stop loss that destroys the grid by setting the destruction price and activating the feature from the user interface. When the stop loss is activated, you can view it on the chart.

MZ Momentum Non Repainting HTF HFT Scalper BotThis is an original script meant to be a high frequency trader that works on higher time frame calculations. I came up with the idea that using calculus I can figure out the actual rate of change and momentum with different calculations than the momentum indicator that is provided by trading view. Once momentum is shifted on a small time frame, it will provide an entry signal. The script is meant to be used on an algorithmic trading system for scalping purposes. It should be run on a one minute time frame.
Set it up on a one minute chart - setup your bot on a one minute interval.
Find the source of your data. You can use any time frame, open, close. high, low, olc4. Open is pretty much guaranteed to not have any repainting issues - although all the other calcs use a custom isbarconfirmed security repaint calculation.
Set your rate of change period - typically I use a one minute time frame for this as well - but set my length fairly long (30-40).
Then set your period for momentum calculation. This will sample the rate of change data to figure out your momentum. I typically try a setting of 6-8. If that doesn't work, try setting it about the same as the rate of change period and add or subtract a few from there.
Unfortunately due to various plotting constraints in Pinescript, you cannot plot the rate of change and momentum and price in the same.
Set your trigger point. I try values -30, -20, -10, 0, 1. Then finesse to get an earlier entry signal. You should account for a slight delay from the signal to the actual entry. Your backtest should test well, but please note that does not gaurantee results. In my findings, I have seen that there is a slight minimal delay between signal to entry and that can make the difference whether your trade is profitable or not.
Use the show data to show you additional data when you are backtesting. This can allow you to try to filter out results or market conditions that do not work. I typically work with the RSI and use the 30 minute and 15 minute RSIs. I make sure that it is trading within a certain band - about 40-75. You can try the inverse and only buy during really low RSI's as well.
Use the enter and close messages to setup your webhook messages. But I recommend to allow the algo trading platform to close the trade for you based on their calcs since that platform knows the actual price level and when it has become profitable.
Filters have been setup for
Moving Average Variants - any time frame, any length.
RSI - Any time frame, any length,
Future Plans: ATR Filter so you can filter out low volatility periods.
Send me a message with any suggestions.
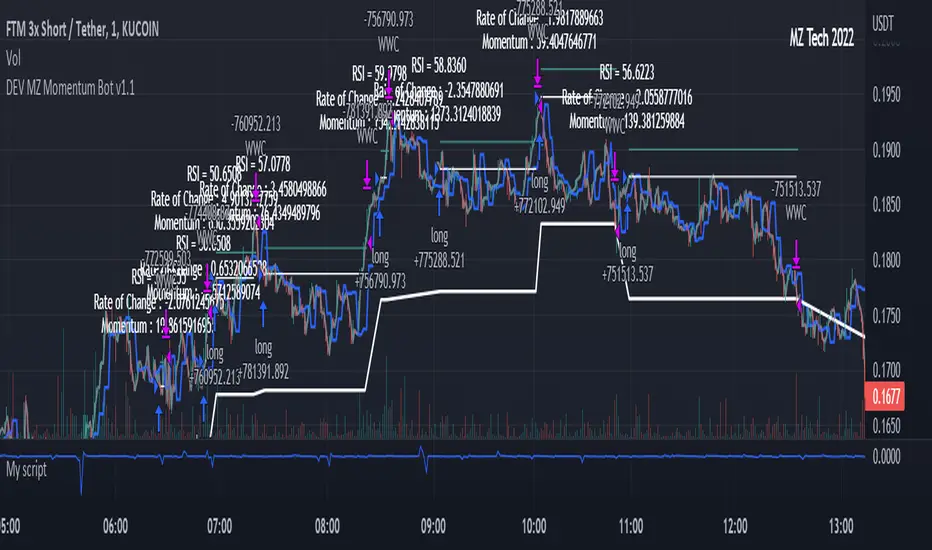
New York Happy HourNew York Happy Hour
Script inspired by Stacey Burke’s 'Trading New York Open 1 Hour a Day'. You know where to search. The algos run on New York time. You’ll be looking to trade from 9.30 AM NY EST using a full day of trading data behind you.
Instruments:
- Gold, major currency pairs, indexes, metals and crypto
Timing: 15 Min
Best Trade Setups:
- 3 Levels (HOD/LOD)
- Trend Trades
- Reversal Trades
- Trading Range
- Or what you see best fit
Script Breakdown:
Sessions:
Asia: 8-11 PM
London: 2-5 AM
New York: 8-11 AM
Other lines:
New York Midnight Open
New York Open
London and NY vertical lines
Previous daily and weekly high and low

Honest Algo PremiumThis toolkit is a collection of innovative indicators, carefully designed to be as user friendly as possible. Get access to a collection of all the best we can offer in one indicator.
Providing Multiple Trading Styles
Our toolkit works in any market but has been specifically designed for Bitcoin and Forex.
Detect the direction of the trend using an algorithm based on our bounce manager ATR consolidation filtering
Find bounces from a handful of different pre-determined lines, the include a 20 period EMA, a supertrend, a T3 moving average and kijun-sen
Detect Rob Smith #thestrat entries
Filter out noise with our environment filters
and much more. (Check the changelog below for future additions)
If you want more information on how the price action entries of Rob Smith #thestrat work, there are many tutorials on the internet.
When using Rob Smith #thestrat entries the indicator uses bounce manager with a 200 period EMA for trend based bar coloring.
A quick explanation how it finds bounces from these lines:
Filter signals based on timeframe continuity
Timeframe continuity is a method of market analysis where you look if multiple different timeframe charts are in the same direction.
For example:
default settings we are in bull territory when the yearly, the quarterly, the monthly and the weekly candle all are green.
default settings we are in bear territory when the yearly, the quarterly, the monthly and the weekly candle all are red.
We provided multiple presets but it is recommended to use the standard preset, timeframe continuity is the strongest when using higher timeframes.
Filter signals based on market environment
We realised that trading long or short in an environment with no resistances increased our algorithms success rate.
How the algorithm does this:
1: See which timeframes the user has selected as a filter, on default these are:
Needs to be outside timeframe 1 (yearly), false
Needs to be outside timeframe 2 (quarterly), false
Needs to be outside timeframe 3 (monthly), true
2: Check if our closing price is above those timeframes previous candle high or below previous candle low.
This in combination with timeframe continuity gives a great tool to find the sentiment of the market and trade in the direction of the market.
Turn on autopilot using our signals
This tool is not made to do all decisions for you and requires a manager (you). The basic strategy using the #thestrat preset is to scale into positions on the 4H or higher timeframe, whenever a signal is fired you add to your position and as trend keeps developing the tool will keep adding to your positions.
A good manager knows risk management and does not use a very large position size per entry and builds a position over time.
We recommend you use a timeframe of 4H or higher and diversify over multiple assets. The indicator works best on assets that overtime have created long lasting trends.
Examples of perfect coins to use this on.
We know traders love clean looking charts
This is wy we added some popular indicators to our toolkit, these you can find on tradingview for free but we added them into our toolkit using our color theme, you can find these in the settings under (extra tools).
We also added an option to display bounce source, this is the source line some of our signal presets use to find bounces from using preset bounce manager parameter.

FunctionArrayMaxSubKadanesAlgorithmLibrary "FunctionArrayMaxSubKadanesAlgorithm"
Implements Kadane's maximum sum sub array algorithm.
size(samples) Kadanes algorithm.
Parameters:
samples : float array, sample data values.
Returns: float.
indices(samples) Kadane's algorithm with indices.
Parameters:
samples : float array, sample data values.
Returns: tuple with format .

vStrat Algo 1.0 (BETA)vStrat Algo 1.0
The Very First Scalping/Intraday Trading Algo for Options
Note: If you have any favorite indicators that you use regularly and are helpful, feel free to use them in conjunction to this strategy.
Legend:
long = buy call
short = buy put
close entry = sell call/put
BULL = bullish engulfing
BEAR = bearish engulfing
OS = oversold
OB = overbought
Instructions:
1. You can choose to watch the 3 minute or 5 minute chart but be aware of the Pro’s and Con’s. It’s not recommended to use this strategy on the 1 minute chart, but this works on higher timeframes. Keep in mind that the signals will vary on each timeframe.
3 minute 5 minute
i.ibb.co i.ibb.co
2. It’s best to use this strategy right at market open. If a “long” (buy CALLS) or “short” (buy PUTS) signal was given at pre-market, I do not recommend taking it. Only take signals once the market opens. If you really wish to take the signal that was given 1-5 minutes before the market opened, you most definitely can, but its’s just riskier. What I would do is, wait 3-10 minutes after market open and if one Moving Average is respecting the other and holding above or below it, you can enter especially if the blow is bullish, the vStrat Algo 1.0 will also tell you if the candles are bearish or bullish. Use your best judgement.
i.ibb.co [
3. You do not have to wait for the exit signal, everyone's risk management is different so take profits whenever you're green or hold as long as the short-term MA is still trending above or below the long-term MA and is not touching or bouncing off it.
i.ibb.co
4. Avoid taking any signals from 11:30 AM ET - 2:30 PM ET, when stocks are trading sideways since the algo’s stop losses get triggered here due to the low volume.
i.ibb.co
5. Lastly, there is no magic indicator or strategy, this algorithm is designed based on multiple conditions. Each signal gets triggered when ALL the conditions are met. This strategy is based off advanced moving averages, one that reduces lag and responds quicker than the simple and exponential ones, RSI value, S/R, pivot points, and a few others. I’m always looking for ways to improve this scalping algorithm so rest assured any complaints or suggestions will be taken and fixed as timely as possible. For best results, avoid trading with your emotions. If you’re a new user, open a small position, set a stop loss, and let the algorithm decide how you will trade it for that day. Keep doing this until you get more familiar with the script then slowly increase your position sizing, but do not invest money you can’t afford to lose. Play with the settings, change the lengths if you wish, but the script was created to provide the most accurate signals as it is. If you do decide to change these inputs, the signals will also be different. Take profits whenever you see fit, the goal is to have a green day and grow your account slowly but surely. If you make a profit, do not risk giving your money back to the market by overtrading. Always do your own due diligence and use your best judgement. Good luck, Traders!
DISCLAIMER : All information found here, including any ideas, opinions, views, predictions, forecasts, commentaries, suggestions, or stock picks, expressed, or implied herein, are for informational, entertainment or educational purposes only and should not be construed as personal investment advice. While the information provided is believed to be accurate, it may include errors or inaccuracies. Conduct your own due diligence or consult a licensed financial advisor or broker before making any and all investment decisions. Any investments, trades, speculations, or decisions made on the basis of any information found on this site, expressed, or implied herein, are committed at your own risk, financial or otherwise.
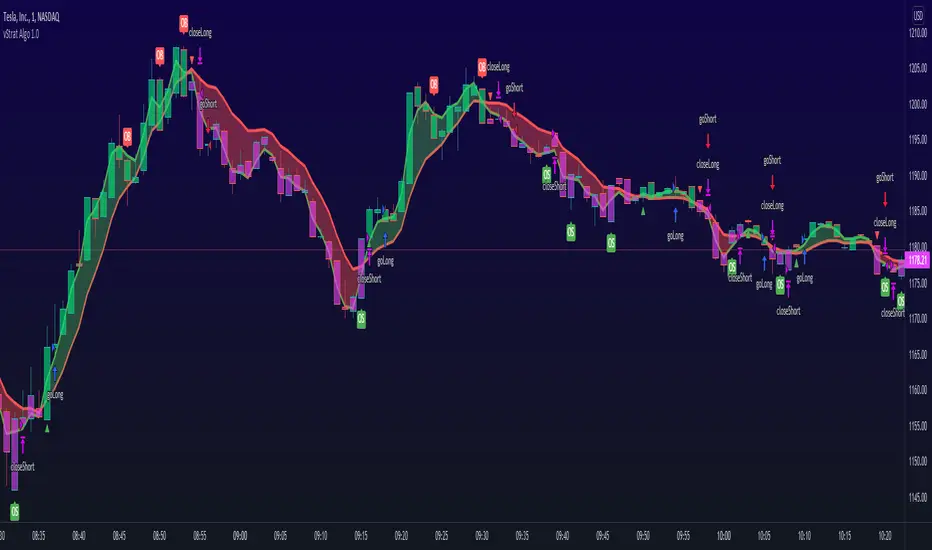
Ichimoku Cloud Strategy Long Only [Bitduke]Slightly modificated and optimized for Pine Script 4.0, Ichimoku Cloud Strategy which, suddenly, good suitable for the several crypto assets.
Details:
Enter position when conversion line crosses base line up, and close it when the opposite happens.
Additional condition for open / close the trade is lagging span, it should be higher than cloud to open position and below - to close it.
Backtesting:
Backtested on SOLUSDT ( FTX, Binance )
+150% for 2021 year, 8% dd
+191% for all time, 32% dd
Disadvantages:
- Small number of trades
- Need to vary parameters for different coins (not very robust)
Should be tested carefully for other coins / stock market. Different parameters could be needed or even algo modifications.
Strategy doesn't repaint.

ApexBull Algorithmic IndicatorOfficial ApexBull ALL IN ONE Algorithm - Swing and Short Term Indicator!
Description:
A new indicator that provides algorithmic entries for longer term swing trading to intraday traders and scalpers. You choose what time frame to trade!
Built-in features allow to separate signals for both longer and shorter term time frames with algorithm using different settings for each to take advantage of short term moves in more aggressive markets, as well as, give you more conservative, more reliable swing trades for longer term investment horizons. Works on anything from monthly to 1 minute charts. We found that most traders should start with 4 and 1 hour time frames with more conservative settings enabled and then venture out into more aggressive territory.
Algorithm is set to target trending movements and ensure you stay out from whipsaw conditions.
The indicator also features a built-in STOP LOSS levels so you dont have to wonder anymore how close or far to set your stop loss and not to be whipsawed out of your winning trades.
If you would like to try out our indicator please send me a direct message here.

[GM ELITE] Dynamic_Introduction
This is the first of the GM ELITE indicator range. Designed for Algorithmic Traders looking to speed up their process of testing and optimizing their algorithm. This script contains an entire suite of indicators, that work together in unison to find optimal trade entries, based on NNFX rules. There are two versions of this script. One is a strategy and built in back-tester, and the other will update in real time designed for live trading and forward testing.
This script is for live trading/forward testing.
Entries/Exits
The System has 5 indicator slots, and the user can choose one indicator per slot
- Trend Confirmation Indicators to pick when the market has taken off
- Volume and volatility Indicators to determine the strength of the trend or whether the market is ranging.
- Moving Averages for trend bias
- Exit Indicators to signal when to get out!
Money Management
Dynamic allows you to choose your Stop Loss and Take Profit distance based on a multiplier x ATR.
Options to exit the whole trade at TP or at a signal from the exit indicator of your choosing.
Start and End times (Window) to backtest.
Forex - $EVZ
Euro Volatility FX Vix ( aka $EVZ) is built in. You can toggle a filter for low $EVZ or whether or not EVZ is above average. No signals will be given if EVZ is below threshold. EVZ is one of the best indicators of overall forex market volume and volatility .
Customization
Several visual and color customization options. Thousands of possible parameter combinations.
The "bias" or mode of the Confirmation Indicators appears at the top and bottom of the screen as horizontal rows of triangles.
For any two-line Indicator (eg MACD ) if the fast line is above the slow line, the triangles are green, other-wise, they are red.
For any "Level Cross" indicator, when the line is above the level, the triangles are green, otherwise, they are red.
The Arrows at the bottom of the screen determine whether or not there is sufficient volume

[GM ELITE] Dynamic Introduction
This is the first of the GM ELITE indicator range. Designed for Algorithmic Traders looking to speed up their process of testing and optimizing their algorithm. This script contains an entire suite of indicators, that work together in unison to find optimal trade entries, based on NNFX rules. There are two versions of this script. One is a strategy and built in back-tester, and the other will update in real time designed for live trading and forward testing.
Entries/Exits
The System has 5 indicator slots, and the user can choose one indicator per slot
- Trend Confirmation Indicators to pick when the market has taken off
- Volume and volatility Indicators to determine the strength of the trend or whether tha market is ranging.
- Moving Averages for trend bias
- Exit Indicators to signal when to get out!
Money Management
Dynamic allows you to choose your Stop Loss and Take Profit distance based on a multiplier x ATR.
Options to exit the whole trade at TP or at a signal from the exit indicator of your choosing.
Start and End times (Window) to backtest.
Forex - $EVZ
Euro Volatility FX Vix (aka $EVZ) is built in. You can toggle a filter for low $EVZ or whether or not EVZ is above average. No signals will be given if EVZ is below threshold. EVZ is one of the best indicators of overall forex market volume and volatility.
Customization
Several visual and color customization options. Thousands of possible parameter combinations.
The "bias" or mode of the Confirmation Indicators appears at the top and bottom of the screen as horizontal rows of triangles.
For any two-line Indicator (eg MACD ) if the fast line is above the slow line, the triangles are green, other-wise, they are red.
For any "Level Cross" indicator, when the line is above the level, the triangles are green, otherwise, they are red.
The Arrows at the bottom of the screen determine whether or not there is sufficient volume
Out of the Box
The Indicators and parameters out of the box are chosen based on defaults. Please optimize for the market that you trade.My recommendation is to paper trade once you have found a combination of settings with good back-testing results, and have different settings for different markets, as not all markets behave in the same manner.
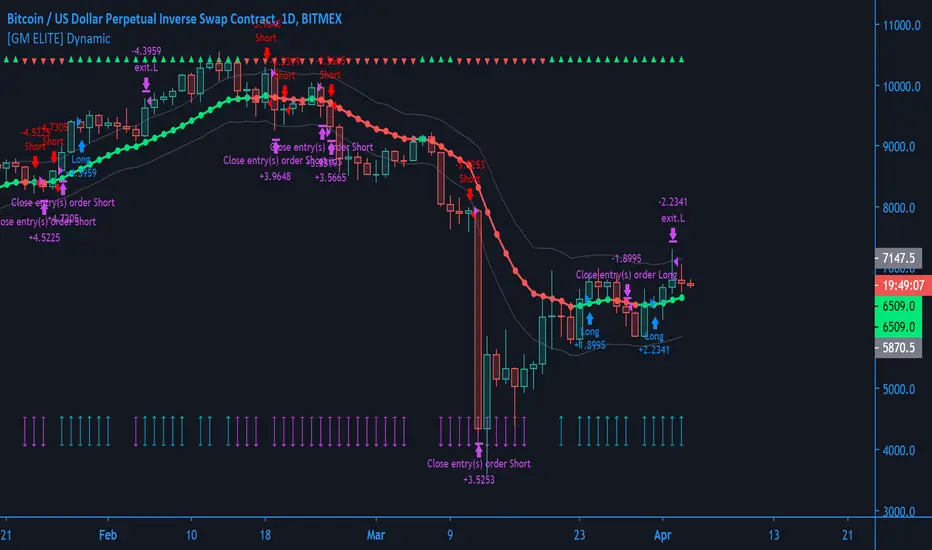
Autonomous LSTM [Noldo] Structure
Feature Layer 1 : Formulation :
The Autonomous LSTM adaptive period equation is a multivariate equation created by averaging a table based on market weights and optimizing it for each time period, by specially Artificial Neural Networks (ANN) training and taking note of the instruments chosen from Foreign exchange instruments, Stock markets , Futures and Commodities , Interest Rates and Yields all over the Global Markets.
Market weights and liquidities were taken into consideration and included in the calculations.
Feature Layer 2: Forecast Algorithm :
When we apply only the first item, we only get the buy and sell signals in reverse.
In other words, since we measure the expectation, the positive signal informs the bear market and the negative scenario informs the bull market.
If we only act according to the expectations market, our system will be very sensitive.
When we associate this with real prices, both our accuracy increases and the reverse market returns to the normal market.
In other words, as in the indicators with standard average, the upward crosses are buy and the downward crosses are sell signal.
Examples:
a -) The normal deep learning script (ANN), which is only created according to expectations:
Unlike standard market, it gives reverse signals.
Original script :
b-) Script with Forecast Algorithm but it only uses valid and standard periods for certain instruments :
Original script :
Feature Layer 3 : Composite of Two Layers : Adaptive Period (Length) Algorithm
This layer is the most important layer.
Outputs the period.
It adjusts itself to market conditions and provides a more agile trading environment under all circumstances.
Display of smart period function and standard period :
Where the market is stagnant, the period increases automatically and reduces unnecessary trade, while in trendy markets the period decreases automatically and allows to see positions first.
The degree of stagnation of the instrument concerned is not calculated solely by volatility.
We may perceive this in relation to several factors, but yes volatility is one of these factors.
When we put the script system under the MACD (Moving Average Convergence Divergence) roof, I did the tests.
Where both averages were positive, they could report accurate harsh trend news, or vice versa.
But I decided to give it up and put it on the Stochastic Money Flow Index .
First of all , Stochastic Money Flow Index function takes the volume into account.
The reason for this is a very important factor, which is naturally contained in the structure of High - Low conditions related codes.
And by using this factor, it could be superfast adaptive in both stagnant and trendy markets.
Feature Layer 4 : High - Low Selection Algorithm
The High-Low Selection Algorithm does not depend on a specific period but scans all periods backwards.(Lookback Function - Lkb )
Outputs the lowest or highest values in the specified new period.
This algorithm was written by me with the concern that if everyone trades according to the same threshold values, it will cause problems and choosing between values of the whole period length will slow down the signals.
This algorithm consists of two functions.
a - Lkb (Lookback Function) :
The lookback function scans back all periods from 0 to Smart Period bars at the same time.
In order to show the effect of the function, it was done between 0 and 84 bars.
However, the scan period of the function is normally at the same time: 0 to adaptive period time.
If the adaptive period includes a fractional day, it can also scan it.
There is no need to be an integer.
All functions are written to make mutable variables appropriate.
And what this function will scan depends on the second feature.
The special selection algorithm is in this function.And the output is given in this function.
b-) High - Low Selection Algorithm
Outputs the lowest or highest values in the specified new period.
This function allows you to select the most advantageous low or high values, even though the adaptive period remains the same.
And the signals are even more accurate.
This is a comparison of the High-Low selection algorithm and the Function: Stochastic Money Flow Index in the standard period.
For the codes of the Stochastic Money Flow Index function:
Speed may not be clear here.
So let's take a look at on chart.
So I would like to show a comparison values of the standard and special selection algorithms on Standard Highest - Lowest Function (All effort goes to RicardoSantos)
Note: This function is the standard function and freed from integer loads.
Blue = Function Highest - Lowest (length = 10 )
Yellow = Smart High-Low Selection Algorithm (length = 10 )
You can better observe the different results in the same period on the chart.
***
4 layers are interdependent.
And when the inter-layer operations are completed, output is given.
*** - Usage of Autonomous LSTM
Plot Rules
Blue Zones = Crossover condition where the average of long and short lines is less than 50.
Orange Zones = Crossunder condition where long and short lines averages more than 50.
Green Zones = Crossover condition where the average of long and short lines is greater than 50.
Red Zones = Crossunder condition where long and short lines averages less than 50.
*** Autonomous LSTM Settings :
It is just the barcolor to be colored according to the crossover and crossunder conditions or not (I / 0) option.
*** Autonomous LSTM Alerts :
As an alert, it only reports crossover and crossunder status as "Long Signal" and "Short Signal" as a warning after the first bar closure.
*** CONCLUSION :
Autonomous LSTM Designed to be used in any time frame.
Does not repaint in any time frame.
Script is independent of constant coefficients.No period adjustment is necessary.
Each layer transfers the information in its own layer to the next layer and the results are reflected in the Stochastic Money Flow Index function built on the resultant.
Regards.
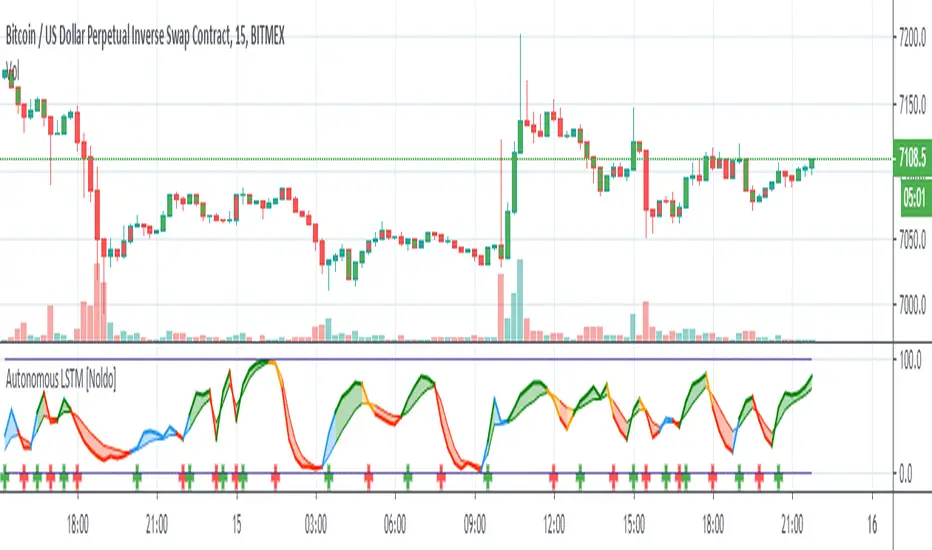
Profitable MAMA & FAMA CrossoverIntroduction
The MESA Adaptive Moving Average (MAMA) was originally presented by John F. Ehlers. By design, it is a special kind of Exponential Moving Average with self-adjusting alpha. Its adaptation is based on the rate change of phase as measured by the Homodyne Discriminator and the alpha parameter is allowed to range between a maximum and minimum value (Fast Limit and Slow Limit).
Key Point: Ehlers suggested the maximum value to be 0.5 and the minimum to be 0.05 .
The variable alpha is computed as the Fast Limit divided by the phase rate of change. If the phase rate of change is large, the variable alpha is bounded at the SlowLimit. Then, this alpha is used to compute MAMA and FAMA (Following Adaptive Moving Average).
Should we rely on Ehlers' suggestions if we want to achieve the best result with MAMA & FAMA crossover system?
Well, he is a good specialist and widely recognized author, I respect him, but the answer is no and you can see results on the chart.
What is our goal?
We want to find the best configuration for MAMA & FAMA Crossover. To achieve that we need to analyze the MAMA's alpha parameter or, more specific, the bounds for this parameter, Fast and Slow Limits.
What is this tool?
This tool is a performance optimizer that uses decision tree-based algorithm under the hood to find the most profitable settings for the MAMA & FAMA Crossover. It analyzes a bunch of different Fast Limits (between 0.01 to 0.8 with step of 0.1 ) and Slow Limits (between 0.01 to 0.6 with step of 0.1 ) and backtests each combination across the entire history of an instrument. If the more profitable parameters were found, the indicator will switch its values to the found ones immediately.
So, instead of manually selecting and testing parameters just apply this indicator to your chart and
relax - the algorithm will find the best parameters for you
Alerts
It has a special alert that notifies when the more profitable settings were detected.
NOTE: It does not change what has already been plotted.
NOTE 2: This is not a strategy, but an algorithmic optimizer.
Reference: www.mesasoftware.com
MAMA & FAMA Crossover can be found here:

Profitable Jurik RSXIntroduction
As you know the Jurik RSX is a "noise free" smoothed version of RSI (Relative Strength Index), with no added lag.
It was originally developed by Mark Jurik and is used the same way as RSI. To learn more about this indicator see www.jurikres.com
The most basic and common strategy is to use the crossovers between Jurik RSX and its overbought/oversold levels as trade signals:
when RSX crosses above 30, go Long
when RSX crosses below 70, go Short
exit when a crossover occurs in the opposite direction
What is this tool?
This tool is a performance scanner that uses a decision tree-based algorithm under the hood to find the most profitable settings for Jurik RSX. It analyzes the range of periods between 2 to 100 and backtests the Jurik RSX for each period (using the strategy mentioned above) across the entire history of an instrument. If the more profitable parameter was found, the indicator will switch its value to the found one immediately.
So, instead of manually selecting parameters just apply it to your chart and relax - the algorithm will do it for you, everywhere you want.
The algorithm can work in two modes: Basic and Early Switch. The Early Switch algorithm makes some assumptions and activates a set of optimizations to find a better setting DURING the trades, not after they were actually closed.
The difference is illustrated on the screenshot below
But two modes can show identical values depending on timeframe
Additionally you can set up a backtest window through indicator's settings (the optimizers which were published before will get this feature soon).
Alerts
It has a special alert that notifies when a more profitable period was detected.
NOTE: It does not change what has already been plotted.
NOTE 2: This is not a strategy, but an algorithmic optimizer.
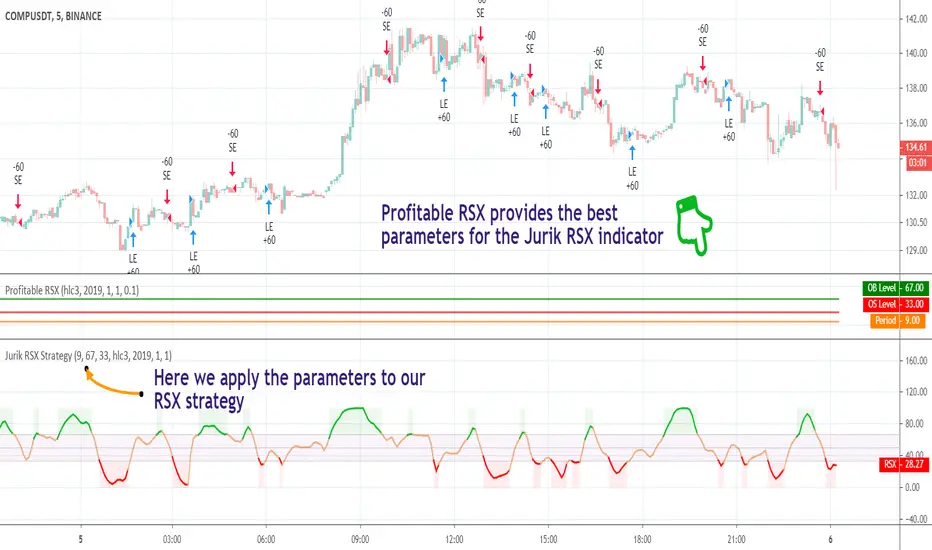
Profitable RSI (Relative Strength Index)Introduction
As you know the Relative Strength Index (RSI) was originally developed by J. Welles Wilder and was described in his book "New Concepts in Technical Trading Systems" (1978). It is intended to measure the strength or weakness of an instrument for the specified period.
The most basic strategy is to use the crossovers as trade signals:
when RSI crosses above 30, go Long
when RSI crosses below 70, go Short
Exit when a crossover occurs in the opposite direction
What is this tool?
This tool is a performance scanner that uses a decision tree-based algorithm under the hood to find the most profitable settings for RSI. It analyzes the range of periods between 2 to 100 and backtests the RSI for each period using the strategy mentioned above across the entire history of an instrument. If the more profitable parameter was found, the indicator will switch its value to the found one immediately.
So, instead of manually selecting parameters just apply it to your chart and relax - the algorithm will do it for you.
The algorithm can work in two modes: Basic and Advanced "Early Switch" . The Early Switch algorithm makes some assumptions and activates a set of optimizations to find the better setting DURING the trades, not after they were closed.
The difference is illustrated on the screenshot below:
Additionally you can set up a backtest window through indicator's settings (the optimizers which were published before will get this feature soon).
Alerts
It has a special alert that notifies when a more profitable period was detected.
NOTE: It does not change what has already been plotted.
NOTE 2: This is not a strategy, but an algorithmic optimizer.
Day after day. Night after night.
I've been waiting to program again.
Day after day. Night by to night.
Trading is waiting inside your heart.
