Hybrid Moving Average - Market TrendHybrid Moving Average Market Trend System - , designed to visualize market trends using a combination of three moving averages: FRAMA (Fractal Adaptive Moving Average), VIDYA (Variable Index Dynamic Average), and a Hamming windowed Volume-Weighted Moving Average (VWMA).
Key Features:
FRAMA Calculation:
FRAMA adapts to market volatility by dynamically adjusting its smoothing factor based on the fractal dimension of price movement. This allows it to be more responsive during trending periods while filtering out noise in sideways markets. The FRAMA is calculated for both short and long periods
VIDYA with CMO:
The VIDYA (Variable Index Dynamic Average) is based on a Chande Momentum Oscillator (CMO), which adjusts the smoothing factor dynamically depending on the momentum of the market. Higher momentum periods result in more responsive averages, while low momentum periods lead to smoother averages. Like FRAMA, VIDYA is calculated for both short and long periods.
Hamming Windowed VWMA:
This VWMA variation applies a Hamming window to smooth the weighting of volume across the calculation period. This method emphasizes central data points and reduces noise, making the VWMA more adaptive to volume fluctuations. The Hamming VWMA is calculated for short and long periods, offering another layer of adaptability to the hybrid moving average.
Hybrid Moving Averages:
Dynamic Coloring and Filling:
The script uses dynamic color transitions to visually distinguish between bullish and bearish conditions:
Search in scripts for "averages"

Green/Red Candle Probability (EMA 7, SMA 20, SMA 200)### Strategy Explanation for Candle Probability Indicator
This script is designed to calculate the **probability of bullish (green) and bearish (red) candles** over a given analysis period. It leverages three key moving averages to identify market trends and display these probabilities directly on the chart, making it easier for traders to make informed decisions.
#### **How the Script Works:**
1. **Trend Detection Using Moving Averages:**
- The script calculates three moving averages:
- **EMA (Exponential Moving Average) over 7 periods**
- **SMA (Simple Moving Average) over 20 periods**
- **SMA over 200 periods**
The trend is classified as:
- **Bullish:** When EMA 7 > SMA 20 > SMA 200
- **Bearish:** When EMA 7 < SMA 20 < SMA 200
2. **Candle Analysis:**
The script analyzes the last "n" candles (based on the user-defined lookback period) to count the number of bullish and bearish candles:
- **Bullish (green) candle:** The closing price is higher than the opening price.
- **Bearish (red) candle:** The closing price is lower than the opening price.
3. **Probability Calculation:**
The probabilities are calculated as a percentage of bullish and bearish candles in the lookback period:
- **Green Probability (%) = (Number of Green Candles / Lookback Period) × 100**
- **Red Probability (%) = (Number of Red Candles / Lookback Period) × 100**
4. **Displaying Results in a Table:**
The results are displayed in a table on the chart, including:
- **Green Probability (%)**
- **Red Probability (%)**
- **Current Trend (Bullish, Bearish, or Neutral)**
#### **Strategy Overview:**
This indicator provides traders with a quick overview of the candle probabilities and the current market trend based on moving averages. It helps traders:
- Gauge the likelihood of bullish or bearish candles appearing in the near future.
- Identify the prevailing trend (bullish, bearish, or neutral).
- Adjust their trading strategies based on statistical probabilities rather than assumptions.
### **Important Notes:**
- The lookback period can be customized between **10 and 200 periods**.
- The indicator does not provide buy/sell signals but gives insights into market behavior.
By understanding the candle probabilities and the trend, traders can better assess market conditions and improve their decision-making process.

DeNoised Momentum [OmegaTools]The DeNoised Momentum by OmegaTools is a versatile tool designed to help traders evaluate momentum, acceleration, and noise-reduction levels in price movements. Using advanced mathematical smoothing techniques, this script provides a "de-noised" view of momentum by applying filters to reduce market noise. This helps traders gain insights into the strength and direction of price trends without the distractions of market volatility. Key components include a DeNoised Moving Average (MA), a Momentum line, and Acceleration bars to identify trend shifts more clearly.
Features:
- Momentum Line: Measures the percentage change of the de-noised source price over a specified look-back period, providing insights into trend direction.
- Acceleration (Ret) Bars: Visualizes the rate of change of the source price, helping traders identify momentum shifts.
- Normal and DeNoised Moving Averages: Two moving averages, one based on close price (Normal MA) and the other on de-noised data (DeNoised MA), enable a comparison of smoothed trends versus typical price movements.
- DeNoised Price Data Plot: Displays the current de-noised price, color-coded to indicate the relationship between the Normal and DeNoised MAs, which highlights bullish or bearish conditions.
Script Inputs:
- Length (lnt): Sets the period for calculations (default: 21). It influences the sensitivity of the momentum and moving averages. Higher values will smooth the indicator further, while lower values increase sensitivity to price changes.
The Length does not change the formula of the DeNoised Price Data, it only affects the indicators calculated on it.
Indicator Components:
1. Momentum (Blue/Red Line):
- Calculated using the log of the percentage change over the specified period.
- Blue color indicates positive momentum; red indicates negative momentum.
2. Acceleration (Gray Columns):
- Measures the short-term rate of change in momentum, shown as semi-transparent gray columns.
3. Moving Averages:
- Normal MA (Purple): A standard simple moving average (SMA) based on the close price over the selected period.
- DeNoised MA (Gray): An SMA of the de-noised source, reducing the effect of market noise.
4. DeNoised Price Data:
- Represented as colored circles, with blue indicating that the Normal MA is above the DeNoised MA (bullish) and red indicating the opposite (bearish).
Usage Guide:
1. Trend Identification:
- Use the Momentum line to assess overall trend direction. Positive values indicate upward momentum, while negative values signal downward momentum.
- Compare the Normal and DeNoised MAs: when the Normal MA is above the DeNoised MA, it indicates a bullish trend, and vice versa for bearish trends.
2. Entry and Exit Signals:
- A change in the Momentum line's color from blue to red (or vice versa) may indicate potential entry or exit points.
- Observe the DeNoised Price Data circles for early signs of a trend reversal based on the interaction between the Normal and DeNoised MAs.
3. Volatility and Noise Reduction:
- By utilizing the DeNoised MA and de-noised price data, this indicator helps filter out minor fluctuations and focus on larger price movements, improving decision-making in volatile markets.

Comprehensive Technical AnalysisComprehensive Technical Analysis Script
Overview
This Script for TradingView is designed to perform and display a detailed technical analysis using a range of moving averages and oscillators. The script provides a summary of market conditions based on various indicators to help traders make informed decisions.
Key Features - Technical Indicators:
Moving Averages:
Simple Moving Average (SMA): Calculates the average price over a specified period.
Exponential Moving Average (EMA): Reacts faster to recent price changes by giving more weight to recent prices.
Weighted Moving Average (WMA): Weighs prices based on their position, giving more importance to recent prices.
Hull Moving Average (HMA): Reduces lag and provides a smoother trend line.
Triple Exponential Moving Average (TEMA): Combines three EMAs to minimize lag and offer a responsive trend indicator.
Exponential Moving Average of an Exponential Moving Average (EMAX): Applies an EMA twice to smooth out trends further.
Triangular Moving Average (TMA): Provides a smoother moving average by averaging over a triangular window.
Oscillators:
Relative Strength Index (RSI): Measures the speed and change of price movements to identify overbought or oversold conditions.
Stochastic Oscillator (%K): Compares a security’s closing price to its price range over a specific period to spot potential reversal points.
Commodity Channel Index (CCI): Identifies cyclical trends and measures the deviation of the price from its average.
Moving Average Convergence Divergence (MACD): Shows the relationship between two EMAs to identify changes in trend strength, direction, momentum, and duration.
Awesome Oscillator (AO): Measures market momentum by comparing two different moving averages.
Average Directional Index (ADX): Determines the strength of a trend and whether the market is trending or ranging.
Williams %R (WPR): Identifies overbought and oversold levels with a different calculation approach compared to the RSI.
Point System - Indicator Points:
Bullish Signal: Each indicator contributing to a positive market sentiment adds points.
Bearish Signal: Each indicator contributing to a negative market sentiment subtracts points.
Point Calculation:
Moving Averages: Points are assigned based on whether the current price is above or below each moving average.
Oscillators: Points are assigned based on whether the oscillator values are in bullish or bearish zones.
Summary Text:
Categorization: Based on the total points calculated from all indicators, the market condition is categorized into:
Strong Bullish: More than 8 points
Bullish: Between 3 and 8 points
Neutral: Between -2 and 2 points
Bearish: Between -3 and -8 points
Strong Bearish: Less than -8 points
Text Display: The summary text reflects the overall market sentiment and is color-coded for easy interpretation.
Table Display - The Position of the table can be customized by the user:
Vertical: Options include Top, Center, Bottom
Horizontal: Options include Left, Center, Right
Table Content:
Summary Text and Points: Displays the summary of technical indicators along with the calculated points.

WRAMA Channel (Weighted RSI ATR MA)OVERVIEW
The WRAMA Channel (Weighted RSI ATR MA) is an advanced technical analysis tool designed to react more quickly to price movements compared to indicators using conventional moving averages. It combines the Relative Strength Index (RSI), Average True Range (ATR), and a weighted moving average, resulting in the WRAMA. This indicator forms a dynamic price channel based on a weighted average that incorporates both trend strength (via RSI) and market volatility (via ATR). It helps traders identify trends, potential reversals, and breakout signals, while offering broad customization options.
Key Features
WRAMA Price Channel:
Generates a dynamic channel around the weighted moving average (WRAMA), adapting to market volatility and momentum, similar to Bollinger Bands. Users are encouraged to adjust channel width and length according to their strategy.
The upper and lower channel bands are calculated based on a percentage deviation from the baseline line.
The channel fill color changes depending on the price's position relative to the baseline (green above, red below), with an optional gradient for better visualization.
Weighted Moving Average (WRAMA):
WRAMA is a custom weighted moving average (MA1), where closing prices are weighted based on RSI and ATR, allowing it to dynamically adapt to market conditions.
Baseline: The WRAMA line calculated over a user-defined period.
WRAMA Calculation:
RSI Weight: Based on RSI value. When RSI is in extreme zones (below the lower threshold or above the upper threshold), an extreme weight is applied. Otherwise, the weight is based on the squared RSI value divided by 100, raised to a power defined by the rsi_weight_factor.
ATR Weight: Based on the ATR-to-average-ATR ratio. If ATR exceeds a threshold (atr_threshold × avg_atr), an extreme weight is applied. Otherwise, the weight is based on the squared ratio of ATR to average ATR, raised to the power of the atr_weight_factor.
Combined Weight: RSI and ATR weights are combined using a rsi_atr_balance parameter. Final weight = RSI weight × balance + ATR weight × (1 - balance).
WRAMA Calculation: The closing price is multiplied by the combined weight. The result is averaged over the ma_length period and divided by the average of the weights, forming the WRAMA line. For current WRAMA (ma_length = 1), the calculation simplifies to a single weighted price.
Additional Moving Averages:
For additional confirmations, the indicator supports up to five moving averages (MA1–MA5) with various types (SMA, EMA, WMA, HMA, ALMA) and customizable periods.
All additional MAs are calculated based on WRAMA or its baseline, ensuring consistency and enabling deeper analysis within a unified methodology. MA trend directions can be tracked in a built-in signal table.
Trading Signals:
Breakout Signals: Breakouts above/below the channel are optionally marked with triangle shapes (green for bullish, red for bearish).
MA Signals: Price position relative to MAs or their slope generates bullish/bearish signals. These are optionally visualized with default triangles (green up, red down).
A signal table in the top-right corner summarizes the status of each moving average – bullish, bearish, or neutral.
Customization Options
Channel Settings:
MA Period: Length of the WRAMA baseline (default: 100).
Channel Deviation : Percentage offset from the baseline for upper/lower bands (default: 1.5%).
RSI Settings:
RSI Period: Length of the RSI calculation (default: 14).
RSI Upper/Lower Threshold: Overbought/oversold levels (default: 70/30).
RSI Weight Factor: Influence of RSI on weighting (default: 2.0).
ATR Settings:
ATR Period: ATR calculation length (default: 14).
ATR Threshold: Volatility threshold as a multiple of average ATR (default: 1.5).
ATR Weight Factor: Influence of ATR on weighting (default: 2.0).
RSI & ATR Combined:
Extreme Weight: Weight applied in extreme RSI/ATR conditions (default: 3.0).
RSI/ATR Balance: Balance between RSI and ATR influence (default: 0.5).
Signal Settings:
Show Breakout Signals: Enable/disable breakout triangles.
Show MA Signals: Enable/disable MA-based signals.
MA Signal Source: Choose between current WRAMA or baseline.
MA Signal Analysis: Based on price position or slope.
Neutral Threshold : Minimum distance from MA for signal neutrality (default: 0.5%).
Minimum MA Slope : Minimum slope for trend direction signals (default: 0.01%).
Moving Averages (MA1–MA5):
Options to enable/disable, select type (SMA, EMA, WMA, HMA, ALMA), set period length, and choose color.
Style Settings:
Gradient Fill: Enable/disable gradient coloring within the channel.
Show Baseline: Enable/disable WRAMA baseline visibility.
Colors: Customize line, fill, and signal colors.
Use Cases
Trend Identification: The WRAMA channel highlights trend direction and potential reversal zones when price contacts the channel edges.
Breakout Signals: Channel breakouts may indicate trend shifts or momentum surges.
MA Analysis: The signal table provides a clear summary of market direction (bullish, bearish, or neutral) based on selected moving averages.
Trading Strategies: Suitable for trend-following, mean-reversion, and scalping strategies, depending on user preferences and settings.
Notes
The indicator offers a high degree of flexibility, making it adaptable to various trading styles, instruments, and timeframes.
It is recommended to adjust channel length and width to fit your trading strategy.
Backtesting settings on historical data is advised to optimize parameters for a specific strategy and market.

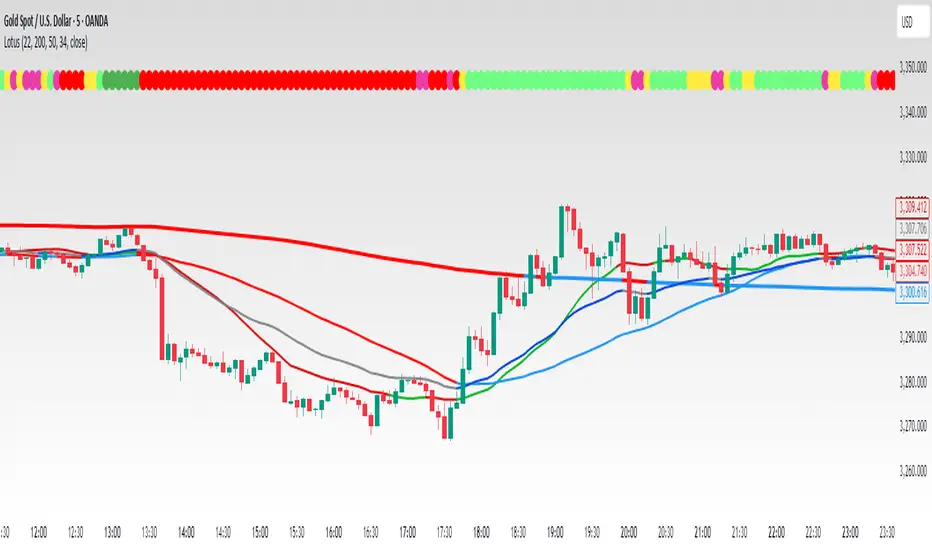
LotusThis Pine Script is designed to plot multiple moving averages (SMA and EMA) on the chart, with dynamic color changes based on whether the price is above or below each moving average. The script includes customizable inputs for different SMA and EMA lengths, and each moving average has its own color scheme, which changes depending on the market price's position relative to the moving average.
Features:
Multiple Moving Averages:
SMA (Simple Moving Average) SELL: Configured with a default length of 22. This moving average is used for determining the "SELL" zone, and its color changes based on price action.
SMA (Simple Moving Average) CONTROL: Configured with a default length of 200. This moving average is a longer-term trend indicator used as a "control" reference. It’s color changes as well depending on price action.
SMA (Simple Moving Average) BUY: Configured with a default length of 50. This moving average acts as the "BUY" zone, where color changes help signal when price is above or below this moving average.
EMA (Exponential Moving Average): Configured with a default length of 13, which reacts more quickly to price changes compared to SMA. It’s plotted but hidden by default.
Dynamic Color Changes: Each moving average has two color states:
When the price is above the moving average, the color shifts to a positive tone, signaling potential buy signals.
When the price is below the moving average, the color turns negative, signaling potential sell or warning zones.
Colors used are:
SMA SELL: Green when above, Red when below.
SMA CONTROL: Blue when above, Red when below.
SMA BUY: Blue when above, Red when below.
EMA: Dark tone when above, Blue tone when below.
Customizable Inputs:
SMA 22 (SELL), SMA 200 (CONTROL), SMA 50 (BUY), and EMA 13 can be adjusted via the input panel to suit different trading strategies.
Source for calculations: The default source for all calculations is the close price.
Plotting and Visibility:
The SMA 22 and EMA 13 are hidden by default but can be revealed as per user preferences.
The SMA 200 and SMA 50 are visible by default for comparison.
How the Script Works:
Color Logic:
The moving averages are colored based on the position of the price relative to the moving average:
Green (Up trend): Price is above the moving average.
Red (Down trend): Price is below the moving average.
Blue (Neutral): For the SMA 50 and EMA, price is either neutral or ranging.
Dynamic Indicators:
The SMA SELL (22) helps traders spot short-term selling opportunities when the price is below this line.
The SMA CONTROL (200) helps gauge the long-term trend and acts as a control line.
The SMA BUY (50) is considered a neutral or buy zone, where the price is seen as more favorable for buying when above the line.
The EMA 13 reacts quickly to price changes, providing faster signals for traders looking for a more dynamic approach.
How to Use:
Trend Confirmation: Use the SMA 200 (Control line) for long-term trend confirmation.
Entry and Exit:
Buy: Look for price above the SMA 50 (BUY) and the SMA 22 (SELL) showing an uptrend.
Sell: Watch for price below the SMA 50 (BUY) or SMA 22 (SELL) indicating a possible downtrend or a selling opportunity.
EMA 13: Acts as a faster, more responsive trend indicator that can be used for shorter time-frame trades.
Example:
SMA SELL (22): The green line suggests potential buying opportunities when the price is above it. The red line suggests possible selling when the price is below.
SMA CONTROL (200): This acts as the primary trend indicator. If the price is above this, the long-term trend is bullish. If the price is below, the long-term trend is bearish.
SMA BUY (50): When the price is above this line, it indicates a favorable buying zone. When the price is below it, it suggests a potential bearish move.
EMA 13: Often used for short-term trades, especially when the price is moving quickly either above or below it.
Customization:
You can adjust the lengths of the SMA SELL, SMA CONTROL, SMA BUY, and EMA based on your personal strategy or trading style.
Modify the colors of each moving average line to better suit your chart preferences.
This script is suitable for traders looking to combine trend-following and short-term trading strategies using moving averages. It allows for an adaptable approach with visual cues based on the price's relationship with key moving averages.
RSI SiaThis script is a custom indicator for TradingView written in Pine Script version 5. It calculates the Relative Strength Index (RSI) and uses it to generate trading signals. Here's a breakdown of what the script does:
Key Features:
RSI Calculation:
The script calculates the RSI using a 14-period window.
It also calculates the momentum of the RSI over a 9-period window (rsi delta) and a simple moving average (SMA) of the RSI over a 3-period window (rsi sma).
Composite Index (CI):
The composite index is calculated as the sum of rsi delta and rsi sma.
Horizontal Lines and Zones:
Several horizontal lines are plotted at different levels (e.g., 20, 40, 60, 80, 120, 150, 180) to indicate overbought and oversold conditions.
Filled zones are created between certain levels to highlight areas of interest.
Moving Averages:
The script plots SMA and EMA of the RSI when Enable RSI ma is set to true.
It also plots moving averages of the composite index.
Crossover Signals:
The script detects bullish and bearish crossovers between the SMA and EMA of the RSI.
It plots shapes (labels) on the chart to indicate buy (BUY) and sell (SELL) signals based on these crossovers.
Usage:
Enable RSIma: This input allows you to enable or disable the plotting of RSI moving averages.
i1: This variable is used to adjust the vertical position of the composite index and its moving averages.
Visualization:
The RSI is plotted in black.
The RSI fast trigger line (SMA of RSI) is plotted in green when enabled.
The RSI slow trigger line (EMA of RSI) is plotted in orange when enabled.
The composite index and its moving averages are plotted in red, green, and orange.
Buy and sell signals are indicated with green and red labels, respectively.
This script can be used to identify potential trading opportunities based on RSI crossovers and the composite index.

Indiq 2.0The functionality of the indicator includes the following features:
Moving Averages (MA):
The ability to adjust periods for short (short_ma_length) and long (long_ma_length) moving averages.
Display of moving averages on the chart:
Short MA (blue line).
Long MA (red line).
Generation of buy and sell signals:
Buy (BUY): When the short MA crosses the long MA from below.
Sell (SELL): When the short MA crosses the long MA from above.
Visualization of signals on the chart:
Buy is displayed as a green BUY marker below the candle.
Sell is displayed as a red SELL marker above the candle.
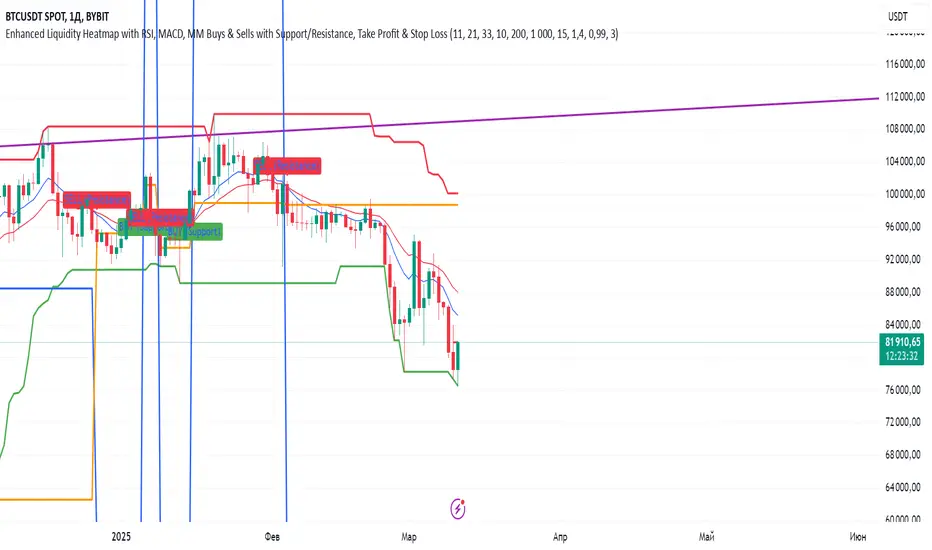
Liquidity Heatmap:
Liquidity levels:
Levels are calculated based on the closing price and a step (liquidity_step).
Levels are grouped by the nearest price values.
Volumes at levels:
Volume (volume) is accumulated for each liquidity level.
Levels with a volume less than min_volume_filter are not displayed.
Time filtering:
Levels that have not been updated within the last time_filter bars are not displayed.
Volatility filtering:
Levels are filtered by volatility (ATR) to exclude those outside the volatility range.
Color gradient:
The color of levels depends on volume (gradient from gradient_start_color to gradient_end_color).
Visualization:
Liquidity levels are displayed as horizontal lines.
Volumes at levels are shown as text labels.
RSI Filtering:
The ability to enable/disable RSI filtering (rsi_filter).
Liquidity levels are filtered based on overbought (rsi_overbought) and oversold (rsi_oversold) conditions.
Levels that do not meet RSI conditions are not displayed.
MACD Filtering:
The ability to enable/disable MACD filtering (macd_filter).
Liquidity levels are filtered based on the MACD histogram condition (e.g., only if the histogram is above zero).
Levels that do not meet MACD conditions are not displayed.
Display of Market Maker Buys:
Condition for market maker buys:
Volume exceeds the average volume over the last 20 bars by 2 times.
Closing price is above the opening price.
Market maker buys are displayed on the chart as orange MM Buy markers below the candle.
Indicator Settings:
Moving average parameters:
short_ma_length: Period for the short MA.
long_ma_length: Period for the long MA.
Liquidity heatmap parameters:
liquidity_step: Step between liquidity levels.
max_levels: Maximum number of levels to display.
time_filter: Time filter (last N bars).
min_volume_filter: Minimum volume for displaying a level.
volatility_filter: Volatility filter (ATR multiplier).
RSI parameters:
rsi_filter: Enable/disable RSI filtering.
rsi_overbought: Overbought RSI level.
rsi_oversold: Oversold RSI level.
MACD parameters:
macd_filter: Enable/disable MACD filtering.
Color settings:
gradient_start_color: Starting color of the gradient.
gradient_end_color: Ending color of the gradient.
Visualization:
Moving averages:
Short MA: Blue line.
Long MA: Red line.
Signals:
Buy: Green BUY marker.
Sell: Red SELL marker.
Liquidity heatmap:
Liquidity levels: Horizontal lines with a color gradient.
Volumes: Text labels at levels.
Market maker buys:
Orange MM Buy markers.
Alerts:
The ability to set alerts for signals:
Buy (BUY).
Sell (SELL).
Additional Features:
Flexible filter settings:
Filtering by time, volume, volatility, RSI, and MACD.
Extensibility:
The ability to add new filters (e.g., Stochastic, Volume Profile, etc.).
Visual customization:
Adjustment of colors, sizes, and display styles.
Summary:
The indicator provides a comprehensive tool for analyzing liquidity, generating trading signals, and tracking market maker activity. It combines:
A liquidity heatmap.
Signals based on moving averages.
Filtering by RSI and MACD.
Display of market maker buys.
Flexible settings and visualization.
This indicator is suitable for traders who want to analyze liquidity levels, identify entry and exit points, and monitor the actions of large market players.
SMA- Ashish SinghSMA
This script implements a Simple Moving Average (SMA) crossover strategy using three SMAs: 200-day, 50-day, and 20-day, with buy and sell signals triggered based on specific conditions involving these moving averages. The indicator is overlaid on the price chart, providing visual cues for potential buy and sell opportunities based on moving average crossovers.
Key Features:
Moving Averages:
The 200-day, 50-day, and 20-day SMAs are calculated and plotted on the price chart. These are key levels that traders use to assess trends.
The 200-day SMA represents the long-term trend, the 50-day SMA is used for medium-term trends, and the 20-day SMA is for short-term analysis.
Buy Signal:
A buy signal is triggered when the price is below all three moving averages (200 SMA, 50 SMA, 20 SMA) and the SMAs are in a specific downward trend (200 SMA > 50 SMA > 20 SMA). This is an indication of a potential upward reversal.
The buy signal is marked with a green triangle below the price bar.
Sell Signal:
A sell signal is triggered when the price is above all three moving averages and the SMAs are in a specific upward trend (200 SMA < 50 SMA < 20 SMA). This signals a potential downward reversal.
The sell signal is marked with a red triangle above the price bar.
Trade Information:
After a buy signal, the buy price, bar index, and timestamp are recorded. When a sell signal occurs, the percentage gain or loss is calculated along with the number of days between the buy and sell signals.
The script automatically displays a label on the chart showing the gain or loss percentage along with the number of days the trade lasted. Green labels represent gains, and red labels represent losses.
User-friendly Visuals:
The buy and sell signals are plotted as small triangles directly on the chart for easy identification.
Detailed trade information is provided with well-formatted labels to highlight the profit or loss after each trade.
How It Works:
This strategy helps traders to identify trend reversals by leveraging long-term and short-term moving averages.
A single buy or sell signal is triggered based on price movement relative to the SMAs and their order.
The tool is designed to help traders quickly spot buying and selling opportunities with clear visual indicators and gain/loss metrics.
This indicator is ideal for traders looking to implement a systematic SMA-based strategy with well-defined buy/sell points and automatic performance tracking for each trade.
Disclaimer: The information provided here is for educational and informational purposes only. It is not intended as financial advice or as a recommendation to buy or sell any stocks. Please conduct your own research or consult a financial advisor before making any investment decisions. ProfitLens does not guarantee the accuracy, completeness, or reliability of any information presented.

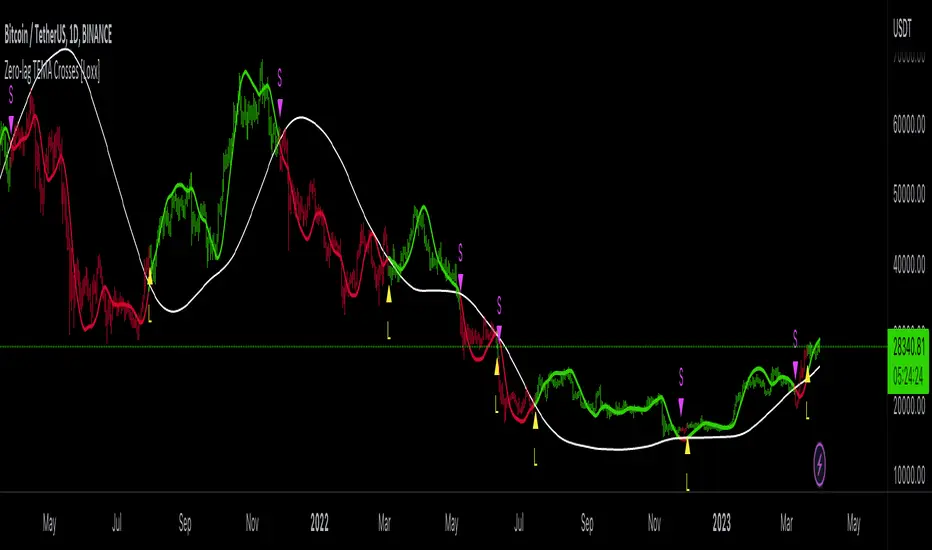
GKD-C Zero-lag TEMA Crosses [Loxx]The Giga Kaleidoscope GKD-C Zero-lag TEMA Crosses is a confirmation module included in Loxx's "Giga Kaleidoscope Modularized Trading System."
█ GKD-C Zero-lag TEMA Crosses
Zero-lag TEMA Crosses is a spinoff of a the Zero-lag MA as described by David Stendahl in the April 2000 issue of the journal "Technical Analysis of Stocks and Commodities". This indicator uses TEMA calculation mode in order to make the lag lesser compared to the original Zero-lag MA, and that makes this version even faster than the Zero-lag DEMA too. This indicator is the difference between a Fast and Slow Zero-lag TEMA. This indicator is very useful for lower timeframe scalping.
What is the Zero-lag MA?
The Zero-lag MA (Zero-Lag Moving Average) is a technical indicator that was introduced in the April 2000 issue of the journal "Technical Analysis of Stocks and Commodities" by David Stendahl.
The Zero-lag MA is a type of moving average (MA) that is designed to reduce or eliminate the lag that is typically associated with traditional moving averages. Moving averages are a widely used technical analysis tool that helps traders to identify trends and potential trading opportunities. They work by calculating the average price of a security over a given period of time, and then plotting that average on a chart. The most commonly used moving averages are simple moving averages (SMAs) and exponential moving averages (EMAs).
The problem with traditional moving averages is that they can be slow to respond to changes in market conditions. This lag can cause traders to miss out on potential trading opportunities, or to enter or exit trades at the wrong time. The Zero-lag MA was developed as a solution to this problem.
The Zero-lag MA is calculated using a combination of two EMAs and a subtraction formula. The first step in calculating the Zero-lag MA is to calculate two exponential moving averages: a fast EMA and a slow EMA. The fast EMA is calculated over a shorter period of time than the slow EMA. The exact period lengths will depend on the trader's preferences and the security being analyzed.
Once the two EMAs have been calculated, the next step is to take the difference between them. This difference represents the current market trend, with a positive value indicating an uptrend and a negative value indicating a downtrend. However, this difference alone is not enough to create a useful indicator, as it can still suffer from lag.
To further reduce lag, the difference between the two EMAs is multiplied by a factor derived from a third, slower EMA. This slower EMA acts as a smoothing factor, helping to reduce noise and make the indicator more accurate. The exact period length of the slower EMA will depend on the trader's preferences and the security being analyzed.
The final step in calculating the Zero-lag MA is to add the result of the multiplication to the fast EMA. This produces a final value that represents the current market trend with reduced lag. The Zero-lag MA can be plotted on a chart like any other moving average, and can be used to identify trends, potential trading opportunities, and support and resistance levels.
Overall, the Zero-lag MA is designed to provide traders with a more accurate representation of current market conditions by reducing the lag time between price changes and the moving average. By doing so, it can help traders to make more informed trading decisions and improve their overall profitability.
What is the TEMA?
The triple exponential moving average (TEMA) is a technical analysis indicator that was developed to reduce the lag of traditional moving averages, such as the simple moving average (SMA) or the exponential moving average (EMA). The TEMA was first introduced by Patrick Mulloy in the January 1994 issue of the "Technical Analysis of Stocks and Commodities" magazine.
The TEMA is a type of moving average that is calculated by applying multiple exponential smoothing techniques to price data. Unlike traditional moving averages, which apply a single smoothing factor to price data, the TEMA applies three smoothing factors to produce a more responsive and accurate indicator.
To calculate the TEMA, the following steps are taken:
Calculate the single exponential moving average (SMA) of the price data over a given period.
Calculate the double exponential moving average (DEMA) of the SMA over the same period.
Calculate the triple exponential moving average (TEMA) of the DEMA over the same period.
The formula for calculating the TEMA is:
TEMA = 3 * EMA(SMA) - 3 * EMA(EMA(SMA)) + EMA(EMA(EMA(SMA)))
where EMA is the exponential moving average and SMA is the simple moving average.
The TEMA is designed to reduce the lag associated with traditional moving averages by applying multiple smoothing factors to the price data. This helps to filter out short-term price fluctuations and provide a smoother indicator of the underlying trend. The TEMA is also less susceptible to whipsaws, which occur when a security's price moves in one direction and then quickly reverses, causing false trading signals.
The TEMA can be used in a variety of ways in technical analysis. It can be used to identify trends, determine support and resistance levels, and generate trading signals. When the TEMA is rising, it is generally interpreted as a bullish signal, indicating that the price is trending higher. When the TEMA is falling, it is generally interpreted as a bearish signal, indicating that the price is trending lower.
In summary, the TEMA is a more responsive and accurate indicator than traditional moving averages, designed to reduce lag and provide a smoother representation of the underlying trend. It is a useful tool for technical analysts and traders looking to identify trends, support and resistance levels, and potential trading opportunities.
█ Giga Kaleidoscope Modularized Trading System
Core components of an NNFX algorithmic trading strategy
The NNFX algorithm is built on the principles of trend, momentum, and volatility. There are six core components in the NNFX trading algorithm:
1. Volatility - price volatility; e.g., Average True Range, True Range Double, Close-to-Close, etc.
2. Baseline - a moving average to identify price trend
3. Confirmation 1 - a technical indicator used to identify trends
4. Confirmation 2 - a technical indicator used to identify trends
5. Continuation - a technical indicator used to identify trends
6. Volatility/Volume - a technical indicator used to identify volatility/volume breakouts/breakdown
7. Exit - a technical indicator used to determine when a trend is exhausted
8. Metamorphosis - a technical indicator that produces a compound signal from the combination of other GKD indicators*
*(not part of the NNFX algorithm)
What is Volatility in the NNFX trading system?
In the NNFX (No Nonsense Forex) trading system, ATR (Average True Range) is typically used to measure the volatility of an asset. It is used as a part of the system to help determine the appropriate stop loss and take profit levels for a trade. ATR is calculated by taking the average of the true range values over a specified period.
True range is calculated as the maximum of the following values:
-Current high minus the current low
-Absolute value of the current high minus the previous close
-Absolute value of the current low minus the previous close
ATR is a dynamic indicator that changes with changes in volatility. As volatility increases, the value of ATR increases, and as volatility decreases, the value of ATR decreases. By using ATR in NNFX system, traders can adjust their stop loss and take profit levels according to the volatility of the asset being traded. This helps to ensure that the trade is given enough room to move, while also minimizing potential losses.
Other types of volatility include True Range Double (TRD), Close-to-Close, and Garman-Klass
What is a Baseline indicator?
The baseline is essentially a moving average, and is used to determine the overall direction of the market.
The baseline in the NNFX system is used to filter out trades that are not in line with the long-term trend of the market. The baseline is plotted on the chart along with other indicators, such as the Moving Average (MA), the Relative Strength Index (RSI), and the Average True Range (ATR).
Trades are only taken when the price is in the same direction as the baseline. For example, if the baseline is sloping upwards, only long trades are taken, and if the baseline is sloping downwards, only short trades are taken. This approach helps to ensure that trades are in line with the overall trend of the market, and reduces the risk of entering trades that are likely to fail.
By using a baseline in the NNFX system, traders can have a clear reference point for determining the overall trend of the market, and can make more informed trading decisions. The baseline helps to filter out noise and false signals, and ensures that trades are taken in the direction of the long-term trend.
What is a Confirmation indicator?
Confirmation indicators are technical indicators that are used to confirm the signals generated by primary indicators. Primary indicators are the core indicators used in the NNFX system, such as the Average True Range (ATR), the Moving Average (MA), and the Relative Strength Index (RSI).
The purpose of the confirmation indicators is to reduce false signals and improve the accuracy of the trading system. They are designed to confirm the signals generated by the primary indicators by providing additional information about the strength and direction of the trend.
Some examples of confirmation indicators that may be used in the NNFX system include the Bollinger Bands, the MACD (Moving Average Convergence Divergence), and the MACD Oscillator. These indicators can provide information about the volatility, momentum, and trend strength of the market, and can be used to confirm the signals generated by the primary indicators.
In the NNFX system, confirmation indicators are used in combination with primary indicators and other filters to create a trading system that is robust and reliable. By using multiple indicators to confirm trading signals, the system aims to reduce the risk of false signals and improve the overall profitability of the trades.
What is a Continuation indicator?
In the NNFX (No Nonsense Forex) trading system, a continuation indicator is a technical indicator that is used to confirm a current trend and predict that the trend is likely to continue in the same direction. A continuation indicator is typically used in conjunction with other indicators in the system, such as a baseline indicator, to provide a comprehensive trading strategy.
What is a Volatility/Volume indicator?
Volume indicators, such as the On Balance Volume (OBV), the Chaikin Money Flow (CMF), or the Volume Price Trend (VPT), are used to measure the amount of buying and selling activity in a market. They are based on the trading volume of the market, and can provide information about the strength of the trend. In the NNFX system, volume indicators are used to confirm trading signals generated by the Moving Average and the Relative Strength Index. Volatility indicators include Average Direction Index, Waddah Attar, and Volatility Ratio. In the NNFX trading system, volatility is a proxy for volume and vice versa.
By using volume indicators as confirmation tools, the NNFX trading system aims to reduce the risk of false signals and improve the overall profitability of trades. These indicators can provide additional information about the market that is not captured by the primary indicators, and can help traders to make more informed trading decisions. In addition, volume indicators can be used to identify potential changes in market trends and to confirm the strength of price movements.
What is an Exit indicator?
The exit indicator is used in conjunction with other indicators in the system, such as the Moving Average (MA), the Relative Strength Index (RSI), and the Average True Range (ATR), to provide a comprehensive trading strategy.
The exit indicator in the NNFX system can be any technical indicator that is deemed effective at identifying optimal exit points. Examples of exit indicators that are commonly used include the Parabolic SAR, the Average Directional Index (ADX), and the Chandelier Exit.
The purpose of the exit indicator is to identify when a trend is likely to reverse or when the market conditions have changed, signaling the need to exit a trade. By using an exit indicator, traders can manage their risk and prevent significant losses.
In the NNFX system, the exit indicator is used in conjunction with a stop loss and a take profit order to maximize profits and minimize losses. The stop loss order is used to limit the amount of loss that can be incurred if the trade goes against the trader, while the take profit order is used to lock in profits when the trade is moving in the trader's favor.
Overall, the use of an exit indicator in the NNFX trading system is an important component of a comprehensive trading strategy. It allows traders to manage their risk effectively and improve the profitability of their trades by exiting at the right time.
What is an Metamorphosis indicator?
The concept of a metamorphosis indicator involves the integration of two or more GKD indicators to generate a compound signal. This is achieved by evaluating the accuracy of each indicator and selecting the signal from the indicator with the highest accuracy. As an illustration, let's consider a scenario where we calculate the accuracy of 10 indicators and choose the signal from the indicator that demonstrates the highest accuracy.
The resulting output from the metamorphosis indicator can then be utilized in a GKD-BT backtest by occupying a slot that aligns with the purpose of the metamorphosis indicator. The slot can be a GKD-B, GKD-C, or GKD-E slot, depending on the specific requirements and objectives of the indicator. This allows for seamless integration and utilization of the compound signal within the GKD-BT framework.
How does Loxx's GKD (Giga Kaleidoscope Modularized Trading System) implement the NNFX algorithm outlined above?
Loxx's GKD v2.0 system has five types of modules (indicators/strategies). These modules are:
1. GKD-BT - Backtesting module (Volatility, Number 1 in the NNFX algorithm)
2. GKD-B - Baseline module (Baseline and Volatility/Volume, Numbers 1 and 2 in the NNFX algorithm)
3. GKD-C - Confirmation 1/2 and Continuation module (Confirmation 1/2 and Continuation, Numbers 3, 4, and 5 in the NNFX algorithm)
4. GKD-V - Volatility/Volume module (Confirmation 1/2, Number 6 in the NNFX algorithm)
5. GKD-E - Exit module (Exit, Number 7 in the NNFX algorithm)
6. GKD-M - Metamorphosis module (Metamorphosis, Number 8 in the NNFX algorithm, but not part of the NNFX algorithm)
(additional module types will added in future releases)
Each module interacts with every module by passing data to A backtest module wherein the various components of the GKD system are combined to create a trading signal.
That is, the Baseline indicator passes its data to Volatility/Volume. The Volatility/Volume indicator passes its values to the Confirmation 1 indicator. The Confirmation 1 indicator passes its values to the Confirmation 2 indicator. The Confirmation 2 indicator passes its values to the Continuation indicator. The Continuation indicator passes its values to the Exit indicator, and finally, the Exit indicator passes its values to the Backtest strategy.
This chaining of indicators requires that each module conform to Loxx's GKD protocol, therefore allowing for the testing of every possible combination of technical indicators that make up the six components of the NNFX algorithm.
What does the application of the GKD trading system look like?
Example trading system:
Backtest: Multi-Ticker CC Backtest
Baseline: Hull Moving Average
Volatility/Volume: Hurst Exponent
Confirmation 1: Zero-lag TEMA Crosses as shown on the chart above
Confirmation 2: uf2018
Continuation: Coppock Curve
Exit: Rex Oscillator
Metamorphosis: Baseline Optimizer
Each GKD indicator is denoted with a module identifier of either: GKD-BT, GKD-B, GKD-C, GKD-V, GKD-M, or GKD-E. This allows traders to understand to which module each indicator belongs and where each indicator fits into the GKD system.
█ Giga Kaleidoscope Modularized Trading System Signals
Standard Entry
1. GKD-C Confirmation gives signal
2. Baseline agrees
3. Price inside Goldie Locks Zone Minimum
4. Price inside Goldie Locks Zone Maximum
5. Confirmation 2 agrees
6. Volatility/Volume agrees
1-Candle Standard Entry
1a. GKD-C Confirmation gives signal
2a. Baseline agrees
3a. Price inside Goldie Locks Zone Minimum
4a. Price inside Goldie Locks Zone Maximum
Next Candle
1b. Price retraced
2b. Baseline agrees
3b. Confirmation 1 agrees
4b. Confirmation 2 agrees
5b. Volatility/Volume agrees
Baseline Entry
1. GKD-B Baseline gives signal
2. Confirmation 1 agrees
3. Price inside Goldie Locks Zone Minimum
4. Price inside Goldie Locks Zone Maximum
5. Confirmation 2 agrees
6. Volatility/Volume agrees
7. Confirmation 1 signal was less than 'Maximum Allowable PSBC Bars Back' prior
1-Candle Baseline Entry
1a. GKD-B Baseline gives signal
2a. Confirmation 1 agrees
3a. Price inside Goldie Locks Zone Minimum
4a. Price inside Goldie Locks Zone Maximum
5a. Confirmation 1 signal was less than 'Maximum Allowable PSBC Bars Back' prior
Next Candle
1b. Price retraced
2b. Baseline agrees
3b. Confirmation 1 agrees
4b. Confirmation 2 agrees
5b. Volatility/Volume agrees
Volatility/Volume Entry
1. GKD-V Volatility/Volume gives signal
2. Confirmation 1 agrees
3. Price inside Goldie Locks Zone Minimum
4. Price inside Goldie Locks Zone Maximum
5. Confirmation 2 agrees
6. Baseline agrees
7. Confirmation 1 signal was less than 7 candles prior
1-Candle Volatility/Volume Entry
1a. GKD-V Volatility/Volume gives signal
2a. Confirmation 1 agrees
3a. Price inside Goldie Locks Zone Minimum
4a. Price inside Goldie Locks Zone Maximum
5a. Confirmation 1 signal was less than 'Maximum Allowable PSVVC Bars Back' prior
Next Candle
1b. Price retraced
2b. Volatility/Volume agrees
3b. Confirmation 1 agrees
4b. Confirmation 2 agrees
5b. Baseline agrees
Confirmation 2 Entry
1. GKD-C Confirmation 2 gives signal
2. Confirmation 1 agrees
3. Price inside Goldie Locks Zone Minimum
4. Price inside Goldie Locks Zone Maximum
5. Volatility/Volume agrees
6. Baseline agrees
7. Confirmation 1 signal was less than 7 candles prior
1-Candle Confirmation 2 Entry
1a. GKD-C Confirmation 2 gives signal
2a. Confirmation 1 agrees
3a. Price inside Goldie Locks Zone Minimum
4a. Price inside Goldie Locks Zone Maximum
5a. Confirmation 1 signal was less than 'Maximum Allowable PSC2C Bars Back' prior
Next Candle
1b. Price retraced
2b. Confirmation 2 agrees
3b. Confirmation 1 agrees
4b. Volatility/Volume agrees
5b. Baseline agrees
PullBack Entry
1a. GKD-B Baseline gives signal
2a. Confirmation 1 agrees
3a. Price is beyond 1.0x Volatility of Baseline
Next Candle
1b. Price inside Goldie Locks Zone Minimum
2b. Price inside Goldie Locks Zone Maximum
3b. Confirmation 1 agrees
4b. Confirmation 2 agrees
5b. Volatility/Volume agrees
Continuation Entry
1. Standard Entry, 1-Candle Standard Entry, Baseline Entry, 1-Candle Baseline Entry, Volatility/Volume Entry, 1-Candle Volatility/Volume Entry, Confirmation 2 Entry, 1-Candle Confirmation 2 Entry, or Pullback entry triggered previously
2. Baseline hasn't crossed since entry signal trigger
4. Confirmation 1 agrees
5. Baseline agrees
6. Confirmation 2 agrees

Zero-lag TEMA Crosses [Loxx]Zero-lag TEMA Crosses is a spinoff of a the Zero-lag MA as described by David Stendahl in the April 2000 issue of the journal "Technical Analysis of Stocks and Commodities". This indicator uses TEMA calculation mode in order to make the lag lesser compared to the original Zero-lag MA, and that makes this version even faster than the Zero-lag DEMA too. This indicator is the difference between a Fast and Slow Zero-lag TEMA. This indicator is very useful for lower timeframe scalping.
What is the Zero-lag MA?
The Zero-lag MA (Zero-Lag Moving Average) is a technical indicator that was introduced in the April 2000 issue of the journal "Technical Analysis of Stocks and Commodities" by David Stendahl.
The Zero-lag MA is a type of moving average (MA) that is designed to reduce or eliminate the lag that is typically associated with traditional moving averages. Moving averages are a widely used technical analysis tool that helps traders to identify trends and potential trading opportunities. They work by calculating the average price of a security over a given period of time, and then plotting that average on a chart. The most commonly used moving averages are simple moving averages (SMAs) and exponential moving averages (EMAs).
The problem with traditional moving averages is that they can be slow to respond to changes in market conditions. This lag can cause traders to miss out on potential trading opportunities, or to enter or exit trades at the wrong time. The Zero-lag MA was developed as a solution to this problem.
The Zero-lag MA is calculated using a combination of two EMAs and a subtraction formula. The first step in calculating the Zero-lag MA is to calculate two exponential moving averages: a fast EMA and a slow EMA. The fast EMA is calculated over a shorter period of time than the slow EMA. The exact period lengths will depend on the trader's preferences and the security being analyzed.
Once the two EMAs have been calculated, the next step is to take the difference between them. This difference represents the current market trend, with a positive value indicating an uptrend and a negative value indicating a downtrend. However, this difference alone is not enough to create a useful indicator, as it can still suffer from lag.
To further reduce lag, the difference between the two EMAs is multiplied by a factor derived from a third, slower EMA. This slower EMA acts as a smoothing factor, helping to reduce noise and make the indicator more accurate. The exact period length of the slower EMA will depend on the trader's preferences and the security being analyzed.
The final step in calculating the Zero-lag MA is to add the result of the multiplication to the fast EMA. This produces a final value that represents the current market trend with reduced lag. The Zero-lag MA can be plotted on a chart like any other moving average, and can be used to identify trends, potential trading opportunities, and support and resistance levels.
Overall, the Zero-lag MA is designed to provide traders with a more accurate representation of current market conditions by reducing the lag time between price changes and the moving average. By doing so, it can help traders to make more informed trading decisions and improve their overall profitability.
What is the TEMA?
The triple exponential moving average (TEMA) is a technical analysis indicator that was developed to reduce the lag of traditional moving averages, such as the simple moving average (SMA) or the exponential moving average (EMA). The TEMA was first introduced by Patrick Mulloy in the January 1994 issue of the "Technical Analysis of Stocks and Commodities" magazine.
The TEMA is a type of moving average that is calculated by applying multiple exponential smoothing techniques to price data. Unlike traditional moving averages, which apply a single smoothing factor to price data, the TEMA applies three smoothing factors to produce a more responsive and accurate indicator.
To calculate the TEMA, the following steps are taken:
Calculate the single exponential moving average (SMA) of the price data over a given period.
Calculate the double exponential moving average (DEMA) of the SMA over the same period.
Calculate the triple exponential moving average (TEMA) of the DEMA over the same period.
The formula for calculating the TEMA is:
TEMA = 3 * EMA(SMA) - 3 * EMA(EMA(SMA)) + EMA(EMA(EMA(SMA)))
where EMA is the exponential moving average and SMA is the simple moving average.
The TEMA is designed to reduce the lag associated with traditional moving averages by applying multiple smoothing factors to the price data. This helps to filter out short-term price fluctuations and provide a smoother indicator of the underlying trend. The TEMA is also less susceptible to whipsaws, which occur when a security's price moves in one direction and then quickly reverses, causing false trading signals.
The TEMA can be used in a variety of ways in technical analysis. It can be used to identify trends, determine support and resistance levels, and generate trading signals. When the TEMA is rising, it is generally interpreted as a bullish signal, indicating that the price is trending higher. When the TEMA is falling, it is generally interpreted as a bearish signal, indicating that the price is trending lower.
In summary, the TEMA is a more responsive and accurate indicator than traditional moving averages, designed to reduce lag and provide a smoother representation of the underlying trend. It is a useful tool for technical analysts and traders looking to identify trends, support and resistance levels, and potential trading opportunities.
Extras
Alerts
Bar coloring
Signals
Loxx's Expanded Source Types, see here:
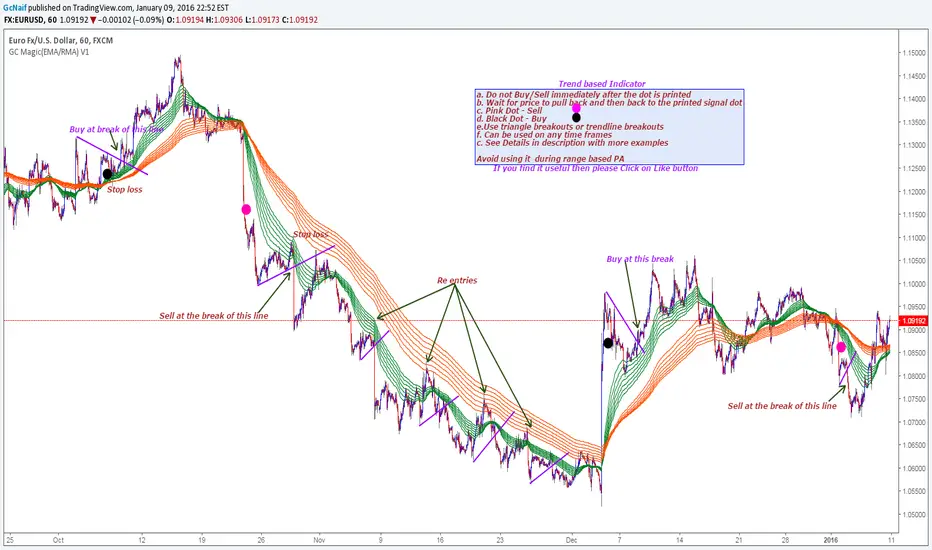
GC Magic(EMA/RMA) V1This is the second script I am posting on TV . This is a Trend based indicator with the option of using it as Exponential Moving Averages or Rsi Moving Averages.The RMA's are giving better signal than the Exponential Moving Averages. The script has the option to select either of them. Works on all time frames. The default options are working good on all time frames.
With the help of Indicator Properties following Options can be changed
a. Type of moving averages for using Guppy method
b. Option to use higher time frame Signal moving average of your choice along with higher time frame
c. Enable or disable to show signal EMA/RMA on chart .
d. Enable or disable to show Guppy EMA/RMA on chart
Indicator Properties:
1. Select to use EMA , Uncheck to use RMA: --> Check to Select EMA based Guppy or Uncheck to use RMA based Guppy
2. Fast EMA/RMA For Cross --> Fast EMA/RMA cross Length
3. Slow EMA/RMA For Cross --> Slow EMA/RMA Length
4. Signal EMA/RMA --> Moving average to use for Signal filters. This moving average will be based on the timeframe u will be selecting below
5. Time interval for Signal EMA/RMA (W, D, ) --> Which time frame moving average you want for the above Signal EMA
6. Do you want to use Signal EMA/RMA for Signals? --> Do you want to use Signal EMA as filter or just the cross of Guppy . Check to use and uncheck for just cross
7. Show Signal EMA on Chart? --> Do you want to display higher timeframe Signal EMA on chart
8. Show Guppy-Slow-Red On Chart? --> Shows/Hides Slow EMA/RMAs
9. Show Guppy-Fast-Green On Chart? --> Shows/Hides Fast EMA/RMAs
Examples:
GbpAud 15m
GbpNzd 1hr
Oil 4hr
AudUSD 1hr
Qullamaggie [Modified] | FractalystWhat's the purpose of this strategy?
The strategy aims to identify high-probability breakout setups in trending markets, inspired by Kristjan "Qullamaggie" Kullamägi’s approach.
It focuses on capturing explosive price moves after periods of consolidation, using technical criteria like moving averages, breakouts, trailing stop-loss and momentum confirmation.
Ideal for swing traders seeking to ride strong trends while managing risk.
----
How does the strategy work?
The strategy follows a systematic process to capture high-momentum breakouts:
Pre-Breakout Criteria:
Prior Price Surge: Identifies stocks that have rallied 30-100%+ in recent month(s), signaling strong underlying momentum (per Qullamaggie’s volatility expansion principles).
Consolidation Phase: Looks for a tightening price range (e.g., flag, pennant, or tight base), indicating a potential "coiling" before continuation.
Trend Confirmation: Uses moving averages (e.g., 20/50/200 EMA) to ensure the stock is trading above key averages on the daily chart, confirming an uptrend.
Price Break: Enters when price clears the consolidation high with conviction.
Risk Management:
Initial Stop Loss: Placed below the consolidation low or a recent swing point to limit downside.
Break-Even Adjustment: Moves stop loss to breakeven once the trade reaches 1.5x risk-to-reward (RR), securing a "free trade" while letting winners run.
Trailing Stop (Unique Edge):
Market Structure Trailing: Instead of trailing via moving averages, the stop is dynamically adjusted using structural invalidation level. This adapts to price action, allowing the trade to stay open during volatile retracements while locking in gains as new structure forms.
Why This Matters: Most strategies use rigid trailing stops (e.g., below the 10EMA), which often exit prematurely in choppy markets. By trailing based on structure, this strategy avoids "noise" and captures larger trends, directly boosting overall returns.
----
What markets or timeframes is this suited for?
This is a long-only strategy designed for trending markets, and it performs best in:
Markets: Stocks (especially high-growth, liquid equities), cryptocurrencies (major pairs with strong volatility), commodities (e.g., oil, gold), and futures (index/commodity futures).
Timeframes: Primarily daily charts for swing trades (1-30 day holds), though weekly charts can help confirm broader trends.
Key Advantage: The TradingView script allows instant backtesting with adjustable parameters
You can:
- Test historical performance across multiple markets to identify which assets align best with the strategy.
- Optimize settings (e.g., trailing stop sensitivity, moving averages etc.) to match a market’s volatility profile.
Build a diversified portfolio by filtering for markets that show consistent profitability in backtests.
For example, you might discover cryptos require tighter trailing stops due to volatility, while stocks thrive with wider structural stops. The script automates this analysis, letting you to trade confidently.
----
What indicators or tools does the strategy use?
The strategy combines customizable technical tools with strict anti-lookahead safeguards:
Core Indicators:
Moving Averages: Adjustable periods (e.g., 20/50/200 EMA or SMA) and timeframes (daily/weekly) to confirm trend alignment. Users can test combinations (e.g., 10EMA vs. 20EMA) to optimize for specific markets.
Breakout Parameters:
Consolidation Length: Adjustable window to define the "tightness" of the pre-breakout pattern.
Entry Models: Flexible entry logics (Breakouts and fractals)
Anti-Lookahead Design:
All calculations (e.g., moving averages, consolidation ranges, volume averages) use only closed/confirmed data available at the time of the signal.
----
How do I manage risk with this strategy?
The strategy prioritizes customizable risk controls to align with your trading style and account size:
User-Defined Risk Inputs:
Risk Per Trade: Set a % of Equity (e.g., 1-2%) to determine position size. The strategy auto-calculates shares/contracts to match your selected risk per trade.
Flexibility: Choose between fixed risk or equity-based scaling.
The script adjusts position sizing dynamically based on your selection.
Pyramiding Feature:
Customizable Entries: Adjust the number of pyramiding trades allowed (e.g., 1-3 additional positions) in the strategy settings. Each new entry is triggered only if the prior trade hits its 1.5x RR target and the trend remains intact.
Risk-Scaled Additions: New positions use profits from prior trades, compounding gains without increasing initial risk.
Risk-Free Trade Mechanic:
Once a trade reaches 1.5x RR, the stop loss is moved to breakeven, eliminating downside risk.
The strategy then opens a new position (if pyramiding is enabled) using a portion of the locked-in profit. This "snowballs" winners while keeping total capital exposure stable.
Impact on Net Profit & Drawdown:
Net Profit Boost: Pyramiding lets you ride multi-leg trends aggressively. For example, a 100% runner could generate 2-3x more profit vs. a single-entry approach.
Controlled Drawdowns: Since new positions are funded by profits (not initial capital), max drawdown stays anchored to your original risk per trade (e.g., 1-2% of account). Even if later entries fail, the breakeven stop on prior trades protects overall equity.
Why This Works: Most strategies either over-leverage (increasing drawdowns) or exit too early. By recycling profits into new positions only after securing risk-free capital, this approach mimics hedge fund "scaling in" tactics while staying retail-trader friendly.
----
How does the strategy identify market structure for its trailing stoploss?
The strategy identifies market structure by utilizing an efficient logic with for loops to pinpoint the first swing candle that features a pivot of 2. This marks the beginning of the break of structure, where the market's previous trend or pattern is considered invalidated or changed.
----
What are the underlying calculations?
The underlying calculations involve:
Identifying Swing Points: The strategy looks for swing highs (marked with blue Xs) and swing lows (marked with red Xs). A swing high is identified when a candle's high is higher than the highs of the candles before and after it. Conversely, a swing low is when a candle's low is lower than the lows of the candles before and after it.
Break of Structure (BOS):
Bullish BOS: This occurs when the price breaks above the swing high level of the previous structure, indicating a potential shift to a bullish trend.
Bearish BOS: This happens when the price breaks below the swing low level of the previous structure, signaling a potential shift to a bearish trend.
Structural Liquidity and Invalidation:
Structural Liquidity: After a break of structure, liquidity levels are updated to the first swing high in a bullish BOS or the first swing low in a bearish BOS.
Structural Invalidation: If the price moves back to the level of the first swing low before the bullish BOS or the first swing high before the bearish BOS, it invalidates the break of structure, suggesting a potential reversal or continuation of the previous trend.
This method provides users with a technical approach to filter market regimes, offering an advantage by minimizing the risk of overfitting to historical data, which is often a concern with traditional indicators like moving averages.
By focusing on identifying pivotal swing points and the subsequent breaks of structure, the strategy maintains a balance between sensitivity to market changes and robustness against historical data anomalies, ensuring a more adaptable and potentially more reliable market analysis tool.
----
What entry criteria are used in this script?
The script uses two entry models for trading decisions: BreakOut and Fractal.
Underlying Calculations:
Breakout: The script records the most recent swing high by storing it in a variable. When the price closes above this recorded level, and all other predefined conditions are satisfied, the script triggers a breakout entry. This approach is considered conservative because it waits for the price to confirm a breakout above the previous high before entering a trade. As shown in the image, as soon as the price closes above the new candle (first tick), the long entry gets taken. The stop-loss is initially set and then moved to break-even once the price moves in favor of the trade.
Fractal: This method involves identifying a swing low with a period of 2, which means it looks for a low point where the price is lower than the two candles before and after it. Once this pattern is detected, the script executes the trade. This is an aggressive approach since it doesn't wait for further price confirmation. In the image, this is represented by the 'Fractal 2' label where the script identifies and acts on the swing low pattern.
----
What type of stop-loss identification method are used in this strategy?
This strategy employs two types of stop-loss methods: Initial Stop-loss and Trailing Stop-Loss.
Underlying Calculations:
Initial Stop-loss:
ATR Based: The strategy uses the Average True Range (ATR) to set an initial stop-loss, which helps in accounting for market volatility without predicting price direction.
Calculation:
- First, the True Range (TR) is calculated for each period, which is the greatest of:
- Current Period High - Current Period Low
- Absolute Value of Current Period High - Previous Period Close
- Absolute Value of Current Period Low - Previous Period Close
- The ATR is then the moving average of these TR values over a specified period, typically 14 periods by default. This ATR value can be used to set the stop-loss at a distance from the entry price that reflects the current market volatility.
Swing Low Based:
For this method, the stop-loss is set based on the most recent swing low identified in the market structure analysis. This approach uses the lowest point of the recent price action as a reference for setting the stop-loss.
Trailing Stop-Loss:
The strategy uses structural liquidity and structural invalidation levels across multiple timeframes to adjust the stop-loss once the trade is profitable. This method involves:
Detecting Structural Liquidity: After a break of structure, the liquidity levels are updated to the first swing high in a bullish scenario or the first swing low in a bearish scenario. These levels serve as potential areas where the price might find support or resistance, allowing the stop-loss to trail the price movement.
Detecting Structural Invalidation: If the price returns to the level of the first swing low before a bullish break of structure or the first swing high before a bearish break of structure, it suggests the trend might be reversing or invalidating, prompting the adjustment of the stop-loss to lock in profits or minimize losses.
By using these methods, the strategy dynamically adjusts the initial stop-loss based on market volatility, helping to protect against adverse price movements while allowing for enough room for trades to develop. The ATR-based stop-loss adapts to the current market conditions by considering the volatility, ensuring that the stop-loss is not too tight during volatile periods, which could lead to premature exits, nor too loose during calm markets, which might result in larger losses. Similarly, the swing low based stop-loss provides a logical exit point if the market structure changes unfavorably.
Each market behaves differently across various timeframes, and it is essential to test different parameters and optimizations to find out which trailing stop-loss method gives you the desired results and performance. This involves backtesting the strategy with different settings for the ATR period, the distance from the swing low, and how the trailing stop-loss reacts to structural liquidity and invalidation levels.
Through this process, you can tailor the strategy to perform optimally in different market environments, ensuring that the stop-loss mechanism supports the trade's longevity while safeguarding against significant drawdowns.
----
What type of break-even method is used in this strategy? What are the underlying calculations?
Moves the initial stop-loss to the entry price when the price reaches a certain RR ratio.
Calculation:
Break-even level = Entry Price + (Initial Risk * RR Ratio)
----
What tables are available in this script?
- Summary: Provides a general overview, displaying key performance parameters such as Net Profit, Profit Factor, Max Drawdown, Average Trade, Closed Trades and more.
Total Commission: Displays the cumulative commissions incurred from all trades executed within the selected backtesting window. This value is derived by summing the commission fees for each trade on your chart.
Average Commission: Represents the average commission per trade, calculated by dividing the Total Commission by the total number of closed trades. This metric is crucial for assessing the impact of trading costs on overall profitability.
Avg Trade: The sum of money gained or lost by the average trade generated by a strategy. Calculated by dividing the Net Profit by the overall number of closed trades. An important value since it must be large enough to cover the commission and slippage costs of trading the strategy and still bring a profit.
MaxDD: Displays the largest drawdown of losses, i.e., the maximum possible loss that the strategy could have incurred among all of the trades it has made. This value is calculated separately for every bar that the strategy spends with an open position.
Profit Factor: The amount of money a trading strategy made for every unit of money it lost (in the selected currency). This value is calculated by dividing gross profits by gross losses.
Avg RR: This is calculated by dividing the average winning trade by the average losing trade. This field is not a very meaningful value by itself because it does not take into account the ratio of the number of winning vs losing trades, and strategies can have different approaches to profitability. A strategy may trade at every possibility in order to capture many small profits, yet have an average losing trade greater than the average winning trade. The higher this value is, the better, but it should be considered together with the percentage of winning trades and the net profit.
Winrate: The percentage of winning trades generated by a strategy. Calculated by dividing the number of winning trades by the total number of closed trades generated by a strategy. Percent profitable is not a very reliable measure by itself. A strategy could have many small winning trades, making the percent profitable high with a small average winning trade, or a few big winning trades accounting for a low percent profitable and a big average winning trade. Most mean-reversion successful strategies have a percent profitability of 40-80% but are profitable due to risk management control.
BE Trades: Number of break-even trades, excluding commission/slippage.
Losing Trades: The total number of losing trades generated by the strategy.
Winning Trades: The total number of winning trades generated by the strategy.
Total Trades: Total number of taken traders visible your charts.
Net Profit: The overall profit or loss (in the selected currency) achieved by the trading strategy in the test period. The value is the sum of all values from the Profit column (on the List of Trades tab), taking into account the sign.
- Monthly: Displays performance data on a month-by-month basis, allowing users to analyze performance trends over each month and year.
- Weekly: Displays performance data on a week-by-week basis, helping users to understand weekly performance variations.
- UI Table: A user-friendly table that allows users to view and save the selected strategy parameters from user inputs. This table enables easy access to key settings and configurations, providing a straightforward solution for saving strategy parameters by simply taking a screenshot with Alt + S or ⌥ + S.
User-input styles and customizations:
Please note that all background colors in the style are disabled by default to enhance visualization.
How to Use This Strategy to Create a Profitable Edge and Systems?
Choose Your Strategy mode:
- Decide whether you are creating an investing strategy or a trading strategy.
Select a Market:
- Choose a one-sided market such as stocks, indices, or cryptocurrencies.
Historical Data:
- Ensure the historical data covers at least 10 years of price action for robust backtesting.
Timeframe Selection:
- Choose the timeframe you are comfortable trading with. It is strongly recommended to use a timeframe above 15 minutes to minimize the impact of commissions/slippage on your profits.
Set Commission and Slippage:
- Properly set the commission and slippage in the strategy properties according to your broker/prop firm specifications.
Parameter Optimization:
- Use trial and error to test different parameters until you find the performance results you are looking for in the summary table or, preferably, through deep backtesting using the strategy tester.
Trade Count:
- Ensure the number of trades is 200 or more; the higher, the better for statistical significance.
Positive Average Trade:
- Make sure the average trade is above zero.
(An important value since it must be large enough to cover the commission and slippage costs of trading the strategy and still bring a profit.)
Performance Metrics:
- Look for a high profit factor, and net profit with minimum drawdown.
- Ideally, aim for a drawdown under 20-30%, depending on your risk tolerance.
Refinement and Optimization:
- Try out different markets and timeframes.
- Continue working on refining your edge using the available filters and components to further optimize your strategy.
What Makes This Strategy Unique?
This strategy combines flexibility, smart risk management, and momentum focus in a way that’s rare and practical:
1. Adapts to Any Market Rhythm
Works on daily, weekly, or intraday charts without code changes.
Uses two entry types: classic breakouts (like trending stocks) or fractal patterns (to avoid false starts).
2. Smarter Stop-Loss System
No rigid rules: Stops adjust based on price structure (e.g., new “higher lows”), not fixed percentages.
Avoids whipsaws: Tightens stops only when the trend strengthens, not in choppy markets.
3. Safe Profit-Boosting Pyramiding
Adds new positions only after prior trades are risk-free (stops moved above breakeven).
Scales up using locked-in profits, not new capital, to grow gains safely.
4. Built-In Momentum Check
Tracks 1/3/6-month price growth to spotlight stocks with strong, lasting momentum.
Terms and Conditions | Disclaimer
Our charting tools are provided for informational and educational purposes only and should not be construed as financial, investment, or trading advice. They are not intended to forecast market movements or offer specific recommendations. Users should understand that past performance does not guarantee future results and should not base financial decisions solely on historical data.
Built-in components, features, and functionalities of our charting tools are the intellectual property of @Fractalyst Unauthorized use, reproduction, or distribution of these proprietary elements is prohibited.
- By continuing to use our charting tools, the user acknowledges and accepts the Terms and Conditions outlined in this legal disclaimer and agrees to respect our intellectual property rights and comply with all applicable laws and regulations.

IB with Range PercentageThis Pine Script indicator for TradingView combines several powerful technical analysis tools to give traders a comprehensive view of market action:
Inside Bar Detection: Identifies the classic inside bar candlestick pattern.
Moving Averages: Provides multiple moving averages to help determine trend and potential support/resistance levels.
Information Table: Displays key market data in a concise table format.
1. Inside Bar Detection and Range
The indicator marks inside bars on the chart. An inside bar is a candlestick where its entire range (high and low) falls within the range of the preceding candlestick (often called the "mother bar"). This pattern often signifies market consolidation or indecision.
Customizable Marking: Users can choose the shape and color used to mark the inside bars, such as triangles, squares, or circles.
Range Percentage: A label shows the range of the inside bar as a percentage of the previous bar's low, providing a quantitative measure of its size.
Time Restriction: A setting allows displaying inside bars only for a specified number of past days, focusing analysis on recent price action.
Customizable Label Size: Users can choose the size of the range percentage label for optimal visibility.
2. Moving Averages for Trend Analysis
The indicator can plot up to four moving averages (MAs) on the chart. Moving averages smooth out price data to help identify trends and potential support and resistance levels.
User-Selectable MA Type: For each MA, traders can choose between Simple Moving Average (SMA) or Exponential Moving Average (EMA).
Customizable Length: Users can specify the length (number of periods) for each MA, such as 20, 50, 100, or 200.
Customizable Color: Each MA's line color can be chosen to suit personal preferences.
Trend Identification: When the price is above an MA, it suggests an uptrend, while prices below suggest a downtrend. The slope of the MA also indicates trend momentum.
3. Information Table for Key Data
A customizable information table is displayed on the chart, providing a quick overview of important market data.
Average Daily Range (ADR) Percentage: Shows the average daily range of the asset as a percentage, reflecting its historical volatility.
Distance from EMAs: Displays how far the current price is from the 10, 20, and 50 period Exponential Moving Averages. A positive percentage indicates the price is above the MA, while a negative percentage means it's below.
Customizable Table Elements: Users can choose the table's background color, text color, and text size for optimal readability.
How to Use This Indicator:
This indicator can be a valuable tool for traders using technical analysis:
Inside Bar Breakouts: Inside bars often precede breakouts. Traders can use the inside bar markings and range percentage to identify potential breakout opportunities.
Confirmation of Trends: Moving averages help confirm the direction of the trend, enabling traders to align their inside bar strategies with the prevailing market direction.
Support and Resistance: Moving averages can act as dynamic support and resistance levels. Traders can look for inside bars forming near these levels as potential entry or exit points.
Volatility and Range Analysis: The ADR percentage helps assess the normal daily range of an asset, which can be useful for setting realistic price targets and managing risk.
Risk Management: The distance from EMAs can alert traders to potential overextended moves, providing information for setting stop-loss or take-profit levels.
By combining these elements, this indicator provides a layered approach to market analysis, allowing traders to identify potential trading opportunities and manage risk effectively based on both candlestick patterns and trend-following indicators. Remember that no indicator guarantees success, and it's essential to use this tool in conjunction with other analysis techniques and proper risk management practices.

EMA/SMA Distance Percentage TableThis TradingView indicator, "EMA/SMA Distance Percentage Table," is designed to help traders and analysts quickly assess the current price's relationship to key Exponential Moving Averages (EMAs) and Simple Moving Averages (SMAs).
Here's a breakdown of what it does:
Calculates Multiple Moving Averages: It computes EMAs for lengths 10, 30, 50, and 200, and SMAs for lengths 50 and 200. These are commonly used moving averages in technical analysis.
Measures Percentage Distance: For each of these moving averages, it calculates the percentage difference between the current closing price and the moving average's value. This indicates how far, in percentage terms, the price has deviated from that average. A positive percentage means the price is above the MA, while a negative percentage means it's below.
Displays Data in a Table: All the calculated information (MA type and length, its current value, and the percentage distance) is presented in a clear, organized table on the chart. This allows for quick at-a-glance monitoring.
Customizable Visibility: Users have the flexibility to show or hide the plots of the EMAs and SMAs on the chart, as well as the entire data table, through the indicator's settings.
Purpose:
The primary purpose of this indicator is to provide a concise overview of price momentum and potential overbought/oversold conditions relative to various moving averages. Traders often use the distance from MAs to:
Identify Trend Strength: A large distance from a long-term MA might suggest a strong trend.
Spot Potential Reversals: If the price is significantly extended from an MA, it might indicate that a pullback or reversal is due.
Confirm Support/Resistance: Moving averages often act as dynamic support or resistance levels, and their distance can provide context.
In essence, it helps you quickly see if the price is "stretched" or "compressed" relative to its historical averages, which can be valuable for making trading decisions.

Trend Confirmation StrategyComprehensive Trend Confirmation System
Indicator Features (Professional Description):
Comprehensive Trend Confirmation System is a versatile indicator meticulously designed to identify and confirm trend-based trading opportunities with exceptional efficiency. By seamlessly integrating analysis from a suite of leading technical tools, it aims to provide superior accuracy and reliability for informed trading decisions.
Key Features:
Intelligent Trend Identification: A robust trend analysis system that considers:
Adjustable Moving Averages: Utilizes three customizable moving average periods (fast, medium, slow) with user-selectable lengths and types (SMA, EMA, WMA, VWMA) to accurately determine the prevailing trend across different timeframes.
In-depth Price Action Analysis: Examines the formation of Higher Highs/Higher Lows (uptrend) and Lower Highs/Lower Lows (downtrend) to validate price direction.
Average Directional Index (ADX) with Adjustable Threshold: Measures the strength of a trend and employs the comparison between +DI and -DI to pinpoint the dominant momentum, featuring a customizable threshold to filter out weak signals.
Multi-Factor Signal Confirmation System: Enhances the reliability of trading signals through verification from four distinct confirmation tools:
Volume Analysis with Average Reference: Assesses whether trading volume supports price movements by comparing it to historical averages.
Relative Strength Index (RSI) with Reference Levels: Measures price momentum and identifies overbought/oversold conditions to confirm trend strength.
Moving Average Convergence Divergence (MACD) Divergence and Crossovers: Detects shifts in momentum and potential trend changes through the relationship between the MACD line and the Signal line.
Stochastic Oscillator with Reference Levels: Measures the current price's position relative to its historical range to evaluate overbought/oversold conditions and potential reversal opportunities.
Intelligent Signal Generation Logic:
Buy Signal: Triggered when a strong uptrend is identified (meeting defined criteria) and confirmed by at least three out of the four confirmation tools.
Sell Signal: Triggered when a strong downtrend is identified (meeting defined criteria) and confirmed by at least three out of the four confirmation tools.
User-Friendly Visualizations:
Moving Averages (MA): Displays three MA lines on the chart with user-configurable colors (default: fast-blue, medium-orange, slow-red) for easy visual trend analysis.
Clear Buy and Sell Signal Symbols: Presents distinct green upward-pointing triangles for buy signals and red downward-pointing triangles for sell signals at the corresponding candlestick.
Dynamic Candlestick Color Coding: Candlesticks are dynamically colored green upon a buy signal and red upon a sell signal for quick identification of trading opportunities.
Highly Customizable Parameters: Users have extensive control over the indicator's parameters, including:
Lengths and types of Moving Averages.
Length and Threshold of the ADX.
Length of the RSI.
Parameters for the MACD (Fast Length, Slow Length, Signal Length).
Parameters for the Stochastic Oscillator (%K Length, %D Length, Smoothing).
Ideal For:
Traders seeking a robust tool to accurately identify and confirm market trends.
Individuals aiming to reduce false signals and enhance the precision of their trading decisions.
Traders employing trend-following strategies in markets with clear directional movement.
Important Note:
While Comprehensive Trend Confirmation System is engineered to improve trading accuracy, no indicator can guarantee 100% profitable trades. Users are advised to utilize this indicator in conjunction with relevant fundamental analysis and sound risk management practices for optimal trading outcomes.

Moving Average Convergence Divergence with Enhanced Cross Alerts
Overview of Features and Settings
- Customizable Parameters:
- Fast and Slow Periods: Users can set the duration for both the fast (default 12) and slow (default 26) moving averages.
- Source Selection: The indicator uses the closing price (close) by default, though this can be modified to any other data source.
- Signal Smoothing: The smoothing period for the signal line is adjustable (default 9), and you can choose whether to use SMA or EMA for both the oscillator and the signal line calculations.
Calculation Logic
1. Calculation of Moving Averages:
- The fast and slow moving averages are computed based on the chosen moving average type (SMA or EMA) over the specified periods.
- The MACD line is then determined as the difference between these two moving averages.
2. Signal Line and Histogram:
- Signal Line: Created by smoothing the MACD line, with the option to choose between SMA and EMA.
- Histogram: Represents the difference between the MACD line and the signal line, visually indicating the divergence between the two.
Detection of Cross Events
The script identifies two specific cross events with additional filtering conditions:
- Bullish Cross:
- The MACD line **crosses above** the signal line.
- The previous value of the histogram is negative, and both the MACD and the signal line are below zero.
- This condition suggests that a cross occurring in the negative territory might indicate a potential upward trend reversal.
- **Bearish Cross:**
- The MACD line **crosses below** the signal line.
- The previous value of the histogram is positive, and both the MACD and the signal line are above zero.
- This condition indicates that a cross in the positive territory may signal a potential downward trend reversal.
For each event, there are dedicated alert conditions defined that trigger notifications when the criteria are met.
Visualization
- Displayed Elements:
- Histogram: Rendered as a column chart with colors that change based on the rate of change. For instance, a rising positive histogram uses a stronger green, whereas a declining positive histogram uses a lighter shade.
- MACD and Signal Lines: Displayed as separate lines with distinct colors to differentiate them.
- Zero Line: A horizontal line is drawn to help visually pinpoint the zero level.
- Crossing Signals:
- Optional markers in the form of arrows appear on the chart:
- **Bullish Cross: A green, upward-pointing triangle at the bottom.
- **Bearish Cross: A red, downward-pointing triangle at the top.
Summary
This indicator not only incorporates the traditional MACD components but also offers the following additional benefits:
- **Enhanced Accuracy:** Extra conditions (such as checking the previous histogram value and the position of the lines relative to zero) improve the identification of significant cross events.
- **Customization:** Users can personalize the moving average types and periods, making the indicator adaptable to different trading strategies.
- **Visual Assistance:** The combination of histogram columns, lines, and markers helps quickly pinpoint potential trend reversals, thereby aiding trading decisions.
This comprehensive description is intended to clearly demonstrate to users how the indicator works, outlining its calculations, filtering conditions, and its role in identifying cross events within technical analysis.
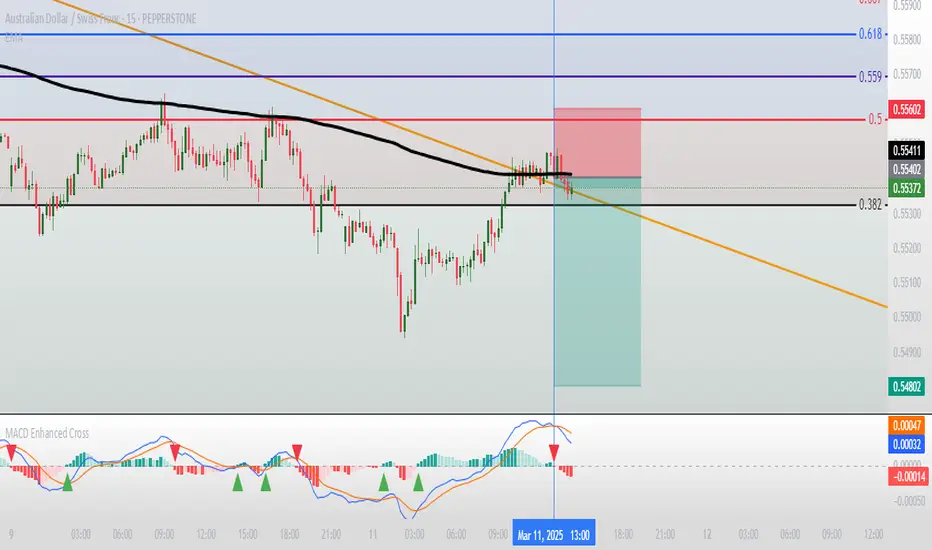
[blackcat] L2 BullBear OscillatorOVERVIEW
The " L2 BullBear Oscillator" is a custom trading indicator for TradingView that helps traders identify market trends, potential tops and bottoms, and the strength of trends using various moving averages and price relationships.
FEATURES
Calculates a base oscillator based on the close price relative to the highest and lowest prices over the past 60 periods.
Smoothes the oscillator using exponential moving averages (EMAs).
Determines market strength through relative strength indicators and moving averages.
Identifies potential tops and strong support levels based on specific conditions involving oscillators and price actions.
Plots several signals to help traders make informed decisions.
HOW TO USE
Install the script on your TradingView chart.
Customize the settings in the "Inputs" section:
Set the periods for the short-term and long-term EMAs.
Set the periods for the three SMAs used in calculations.
Interpret the plots:
BullBear Signal (Fuchsia Line): Indicates the overall market trend. Uptrends suggest buying opportunities, while downtrends suggest selling.
Decreasing BullBear Signal (Aqua Line): Highlights periods when the trend is weakening or turning bearish, signaling possible selling opportunities.
Potential Top Condition (Yellow Plot): Signals possible trend reversals from bullish to bearish, indicating times to consider taking profits or preparing for a downtrend.
High Price Condition (Yellow Plot): Indicates strong bullish momentum but also potentially overbought conditions, which might precede a correction.
Earning Condition (Red Line): Possibly signifies strong bullish signals, indicating good times to enter long positions.
Strong Support Condition (White Arrows): Signals potential bottoms or support levels, indicating buying opportunities.
Start Hiding Condition (Fuchsia Plot): Might indicate times to exit positions or reduce exposure due to unfavorable market conditions.
ALGORITHMS
Moving Averages:
Simple Moving Averages (SMAs): Used to calculate averages of price data over specified periods.
Exponential Moving Averages (EMAs): Used to give more weight to recent prices, making the moving averages more responsive to new data.
Oscillator Calculation:
The base oscillator is calculated based on the close price's position within the highest and lowest prices over 60 periods, normalized to a 0-100 scale.
This oscillator is then smoothed using EMAs to reduce noise and make trends more visible.
Relative Strength Indicator:
Calculated based on the close price's position within the highest and lowest prices over 20 periods, also normalized to a 0-100 scale.
This is smoothed using SMAs to get a more stable signal.
Condition Checks:
Various conditions are checked to identify potential tops, strong support, and other market states based on the relationships between these indicators and price actions.
LIMITATIONS
The script is based on historical data and does not guarantee future performance.
It is recommended to use the script in conjunction with other analysis tools.
The effectiveness of the strategy may vary depending on the market conditions and asset being traded.
NOTES
The script is designed for educational purposes and should not be considered financial advice.
Users are encouraged to backtest the strategy on a demo account before applying it to live trades.
THANKS
Special thanks to the TradingView community for their support and feedback.
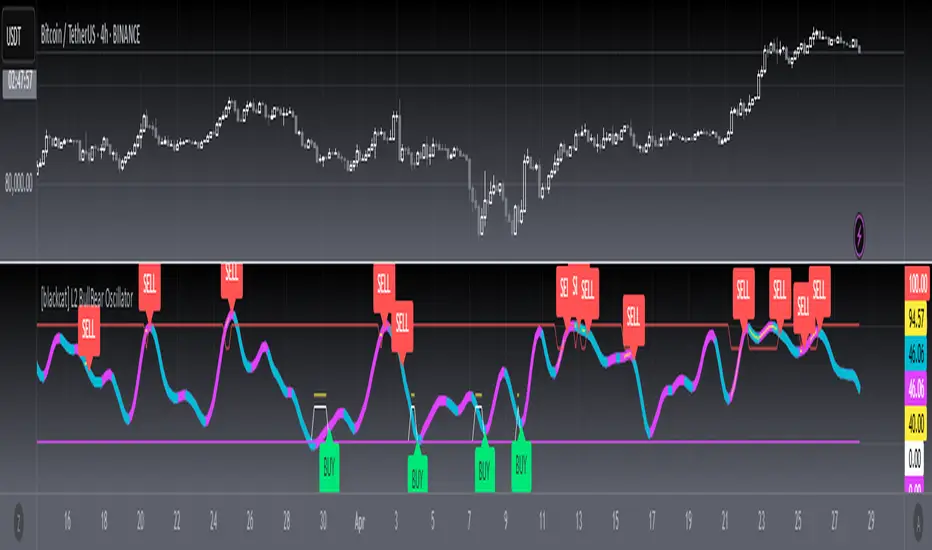
DTS- Dynamic Trend SignalDynamic Trend Signal
The Dynamic Trend Signal indicator is a powerful and highly customizable tool designed for traders who want clear and actionable signals to guide their trading decisions. This indicator leverages the relationship between two moving averages and the current price to provide concise buy/sell recommendations while visually enhancing your chart with professional-grade features.
Key Features:
Actionable Trading Signals:
STRONG BUY / NO SELL: When the price is above both moving averages.
BUY / NO SELL: When the price is above the longer moving average but below the shorter moving average.
NO BUY / SELL: When the price is below the longer moving average but above the shorter moving average.
STRONG SELL / NO BUY: When the price is below both moving averages.
Dynamic Signal Table:
Displays real-time trading signals in a convenient table format.
Automatically updates based on market conditions.
Customizable table position (top-left, top-right, bottom-left, or bottom-right).
Dynamic background and text colors for improved visibility:
Green shades for bullish signals.
Red shades for bearish signals.
Customizable Moving Averages:
Configure each moving average independently:
Choose between Simple Moving Average (SMA) and Exponential Moving Average (EMA).
Set unique lengths, colors, and line thickness for each average.
Default settings:
MA1: Short-term (8-period) with thickness 1.
MA2: Long-term (20-period) with thickness 2.
Optional Crossover Alerts:
Visual and textual alerts for moving average crossovers:
BUY: When the shorter moving average crosses above the longer moving average.
SELL: When the shorter moving average crosses below the longer moving average.
Crossover alerts are disabled by default but can be easily enabled in settings.
Ease of Use:
Intuitive interface with clean and professional visuals.
Fully customizable to fit any trading strategy or chart style.
How It Helps Traders:
The Dynamic Trend Signal simplifies market analysis by removing guesswork and focusing on clear, data-driven signals. Whether you're a beginner looking for straightforward guidance or an experienced trader seeking to enhance your strategy, this indicator provides:
Confidence in decision-making with clear buy/sell signals.
Customization to align with your unique trading approach.
Clarity through visually appealing, color-coded signals and alerts.
Ideal For:
Swing Traders
Day Traders
Trend Followers
Traders looking to integrate a dynamic, rule-based approach to their analysis.
How to Use:
Add the Dynamic Trend Signal indicator to your chart.
Adjust the moving average lengths, types, colors, and thickness to suit your trading strategy.
Monitor the signal table for actionable recommendations.
Optionally enable crossover alerts for real-time buy/sell notifications.
Unlock the power of clear and actionable trading signals with the Dynamic Trend Signal! Add it to your TradingView chart today and take your trading strategy to the next level.
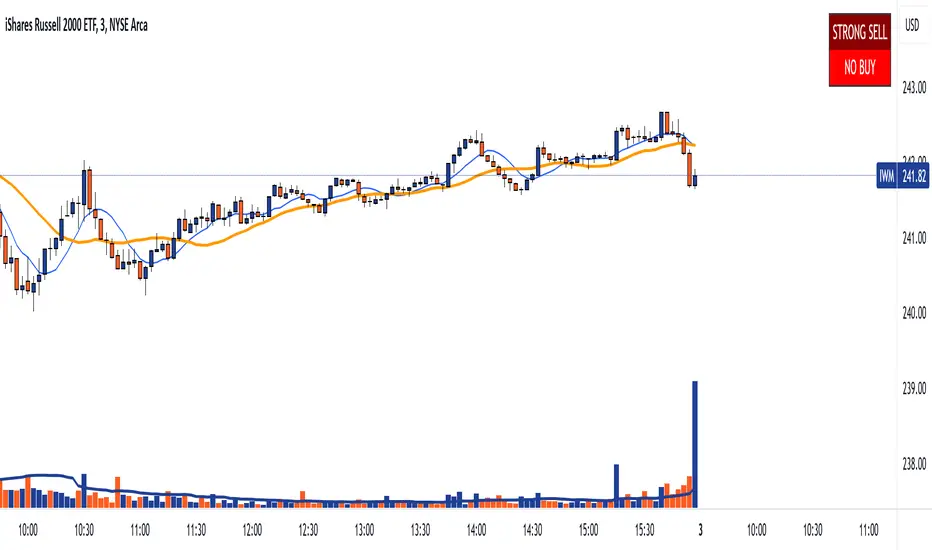
WODIsMA Strategy 3 MA Crossover & Bull-Bear Trend ConfirmationWODIsMA Strategy is a versatile trading strategy designed to leverage the strength of moving averages and volatility indicators to provide clear trading signals for both long and short positions. This strategy is suitable for traders looking for a systematic approach to trading with adjustable parameters to fit various market conditions and personal trading styles.
Key Features
Customizable Moving Averages:
The strategy allows users to select different types of moving averages (SMA, EMA, SMMA, WMA, VWMA) for short-term, mid-term, long-term, and bull-bear trend identification.
Each moving average can be customized with different lengths, sources (e.g., close, high, low), timeframes, and colors.
Position Management:
Users can specify the percentage of capital to use per trade and the percentage to close per partial exit.
The strategy supports both long and short positions with the ability to enable or disable each direction.
Volatility Filter:
Incorporates a volatility filter to ensure trades are only taken when market volatility is above a user-defined threshold, enhancing the strategy's effectiveness in dynamic market conditions.
Bull-Bear Trend Line:
Option to enable a bull-bear trend line that helps identify the overall market trend. Trades are taken based on the relationship between the long-term moving average and the bull-bear trend line.
Partial Exits and Full Close Logic:
The strategy includes logic for partial exits based on the crossing of mid-term and long-term moving averages.
Ensures that positions are fully closed when adverse conditions are detected, such as the price crossing below the bull-bear trend line.
Stop Loss Management:
Implements user-defined stop loss levels to manage risk effectively. The stop loss is dynamically adjusted based on the entry price and user input.
Detailed Description
Moving Average Calculation: The strategy calculates up to six different moving averages, each with customizable parameters. These moving averages help identify the short-term, mid-term, long-term trends, and overall market direction.
Trading Signals:
Long Signal: A long position is opened when the short-term moving average is above the long-term moving average, and the mid-term moving average crosses above the long-term moving average.
Short Signal: A short position is opened when the short-term moving average is below the long-term moving average, and the mid-term moving average crosses below the long-term moving average.
Volatility Condition: The strategy includes a volatility filter that activates trades only when volatility exceeds a specified threshold, ensuring trades are made in favorable market conditions.
Bull-Bear Trend Confirmation: When enabled, trades are filtered based on the relationship between the long-term moving average and the bull-bear trend line, adding another layer of confirmation.
Stop Loss and Exits:
The strategy manages risk by placing stop loss orders based on user-defined percentages.
Positions are partially or fully closed based on the crossing of moving averages and the relationship with the bull-bear trend line.
Originality and Usefulness
This strategy is original as it combines multiple moving averages and volatility indicators in a structured manner to provide reliable trading signals. Its versatility allows traders to adjust the parameters to match their trading preferences and market conditions. The inclusion of a volatility filter and bull-bear trend line adds significant value by reducing false signals and ensuring trades are taken in the direction of the overall market trend. The detailed descriptions and customizable settings make this strategy accessible and understandable for traders, even those unfamiliar with the underlying Pine Script code.
By providing clear entry, exit, and risk management rules, the WODIsMA Strategy enhances the trader's ability to navigate different market environments, making it a valuable addition to the TradingView community scripts.

Moving Average Confluence [ST]Moving Average Confluence
Description in English:
This indicator uses multiple moving averages (SMA, EMA, WMA) with different periods to identify confluence points that can indicate support or resistance zones.
Detailed Explanation:
Configuration:
SMA Length: This input defines the period for the Simple Moving Average (SMA). The default value is 50.
EMA Length: This input defines the period for the Exponential Moving Average (EMA). The default value is 50.
WMA Length: This input defines the period for the Weighted Moving Average (WMA). The default value is 50.
Confluence Threshold: This input defines the maximum allowable difference between the moving averages to consider them in confluence. The default value is 0.01.
Calculation of Moving Averages:
SMA: Calculated as the simple arithmetic mean of the closing prices over the specified period.
EMA: Calculated by giving more weight to recent prices.
WMA: Calculated by weighting the closing prices based on their age.
Identification of Confluence:
Confluence is identified when the differences between SMA, EMA, and WMA are all within the specified threshold. This can indicate potential support or resistance zones.
Plotting:
The SMA, EMA, and WMA are plotted with different colors for easy identification.
Confluence points are marked with yellow labels on the chart.
Indicator Benefits:
Support and Resistance Identification: Helps traders identify potential support and resistance zones through the confluence of different moving averages.
Visual Cues: Provides clear visual signals for confluence points, aiding in making informed trading decisions.
Customizable Parameters: Allows traders to adjust the periods of the moving averages and the confluence threshold to suit different trading strategies and market conditions.
Justification of Component Combination:
Combining multiple types of moving averages (SMA, EMA, WMA) provides a comprehensive view of market trends. Identifying confluence points where these averages are close together can indicate strong support or resistance levels.
How Components Work Together:
The script calculates the SMA, EMA, and WMA for the specified periods.
It then checks if the differences between these moving averages are within the specified threshold.
When a confluence is detected, it is marked on the chart with a yellow label, providing a clear visual signal to the trader.
Título: Confluência de Médias Móveis
Descrição em Português:
Este indicador utiliza várias médias móveis (SMA, EMA, WMA) com diferentes períodos para identificar pontos de confluência que podem indicar zonas de suporte ou resistência.
Explicação Detalhada:
Configuração:
Comprimento da SMA: Este parâmetro define o período para a Média Móvel Simples (SMA). O valor padrão é 50.
Comprimento da EMA: Este parâmetro define o período para a Média Móvel Exponencial (EMA). O valor padrão é 50.
Comprimento da WMA: Este parâmetro define o período para a Média Móvel Ponderada (WMA). O valor padrão é 50.
Limite de Confluência: Este parâmetro define a diferença máxima permitida entre as médias móveis para considerá-las em confluência. O valor padrão é 0.01.
Cálculo das Médias Móveis:
SMA: Calculada como a média aritmética simples dos preços de fechamento ao longo do período especificado.
EMA: Calculada atribuindo mais peso aos preços mais recentes.
WMA: Calculada ponderando os preços de fechamento com base em sua idade.
Identificação de Confluência:
A confluência é identificada quando as diferenças entre SMA, EMA e WMA estão todas dentro do limite especificado. Isso pode indicar potenciais zonas de suporte ou resistência.
Plotagem:
A SMA, EMA e WMA são plotadas com cores diferentes para fácil identificação.
Pontos de confluência são marcados com etiquetas amarelas no gráfico.
Benefícios do Indicador:
Identificação de Suporte e Resistência: Ajuda os traders a identificar potenciais zonas de suporte e resistência através da confluência de diferentes médias móveis.
Sinais Visuais Claros: Fornece sinais visuais claros para pontos de confluência, auxiliando na tomada de decisões informadas.
Parâmetros Personalizáveis: Permite que os traders ajustem os períodos das médias móveis e o limite de confluência para se adequar a diferentes estratégias de negociação e condições de mercado.
Justificação da Combinação de Componentes:
Combinar vários tipos de médias móveis (SMA, EMA, WMA) fornece uma visão abrangente das tendências do mercado. Identificar pontos de confluência onde essas médias estão próximas pode indicar níveis fortes de suporte ou resistência.
Como os Componentes Funcionam Juntos:
O script calcula a SMA, EMA e WMA para os períodos especificados.
Em seguida, verifica se as diferenças entre essas médias móveis estão dentro do limite especificado.
Quando uma confluência é detectada, ela é marcada no gráfico com uma etiqueta amarela, fornecendo um sinal visual claro para o trader.
Buying - Selling StrengthThis script is designed as a TradingView indicator called "Buying Selling Volume". It aims to provide insights into buying and selling pressures in the market, along with the comparison of these pressures against moving averages.
Calculation of Buying and Selling Volumes:
Buying Volume (BV) is calculated based on the difference between the close price and the low price, weighted by the volume traded.
Selling Volume (SV) is calculated based on the difference between the high price and the close price, weighted by the volume traded.
These volumes are normalized to ensure positive values.
Plotting of Buying and Selling Volumes:
The script plots the Buying Volume (green) and Selling Volume (red) on the chart using vertical bars.
Each bar represents the relative strength of buying or selling pressure at a given point in time.
Moving Averages Calculation:
Users can select the type of moving average (SMA, EMA, WMA, or VWMA) and the length of each moving average.
Moving averages are calculated for both buying and selling volumes based on the selected parameters.
Plotting of Moving Averages:
The script plots the selected moving averages for buying (blue) and selling (orange) volumes on the chart.
These moving averages provide smoothed representations of the underlying volume trends.
Bar Color and Background Color:
The script dynamically adjusts the color of the bars and the background based on specific conditions:
If both buying and selling volumes are above their respective moving averages, the bar color is green, indicating a bullish signal.
If both volumes are below their moving averages, the bar color is red, indicating a bearish signal.
If buying volume is above its moving average while selling volume is below its moving average, the bar color is yellow, suggesting mixed market sentiment.
Otherwise, the bar color is gray, indicating a neutral market condition.

Voluminati: Uncovering Market SecretsVoluminati: Uncovering Market Secrets
Overview:
The Voluminati indicator dives deep into the secrets of trading volume, providing traders with unique insights into the market's strength and direction. This advanced tool visualizes the Relative Strength Index (RSI) of trading volume alongside the traditional RSI of price, presenting an enriched perspective on market dynamics.
Features:
Volume RSI: A unique twist on the traditional RSI, the Volume RSI measures the momentum of trading volume. This can help identify periods of increasing buying or selling pressure.
Traditional RSI: The renowned momentum oscillator that measures the speed and change of price movements. Useful for identifying overbought or oversold conditions.
Moving Averages: Both the Volume RSI and traditional RSI come with optional moving averages. These can be toggled on or off and are customizable in type (SMA or EMA) and length.
Overbought & Oversold Fills: Visual aids that highlight regions where the Volume RSI is in overbought (above 70) or oversold (below 30) territories. These fills help traders quickly identify potential reversal zones.
How to Use:
Look for divergence between the Volume RSI and price, which can indicate potential reversals.
When the Volume RSI moves above 70, it might indicate overbought conditions, and when it moves below 30, it might indicate oversold conditions.
The optional moving averages can be used to identify potential crossover signals or to smooth out the oscillators for a clearer trend view.
Customizations:
Toggle the display of the traditional RSI and its moving average.
Choose the type (SMA/EMA) and length for both the Volume RSI and traditional RSI moving averages.
Note: Like all indicators, the Voluminati is best used in conjunction with other tools and analysis techniques. Always use proper risk management.