5 Consecutive bars up and down pattern This indicator mark the reversal bar after 5 or more consecutive bars.Pine Script® indicatorby riseofthecapitalist77
My Simple Gaps with overlay (Bar and Candlestick Charts)updated screenshot with some narrative this is a bar and candlestick chart gap identification toolPine Script® indicatorby bigfish214442
Simple Gaps for use on Bar ChartsThis script identifies when price gaps up and gaps down, represented by green and red box icons respectively. Future enhancements to this script will work across Candle charts and will indicate the size of the script, perhaps with more prominent colours. Please suggest improvements as you see fit. Thanks, and enjoy.Pine Script® indicatorby bigfish21Updated 1154
Deribit ChartsCurious what the price is on Deribit and can't wait for the new charts to be posted on TradingView? This gives you an overlay of their price bars based upon how they calculate their derivative.Pine Script® indicatorby CryptoSamurai_OG22102
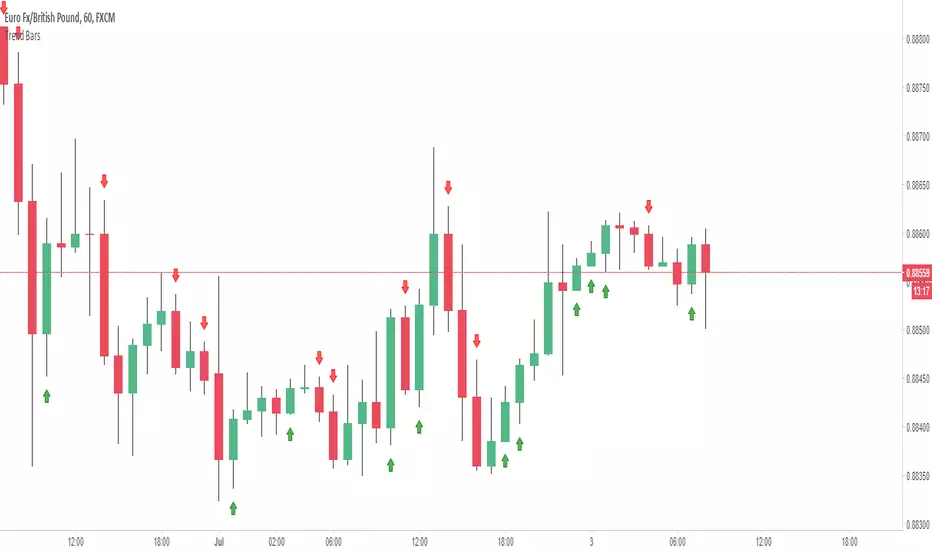
Two Bar Reversal with AlertTwo Bar Reversal with Alert Alert 1 : Long Sign Alert 2 : Short SignPine Script® indicatorby matsu_bitmexUpdated 11693
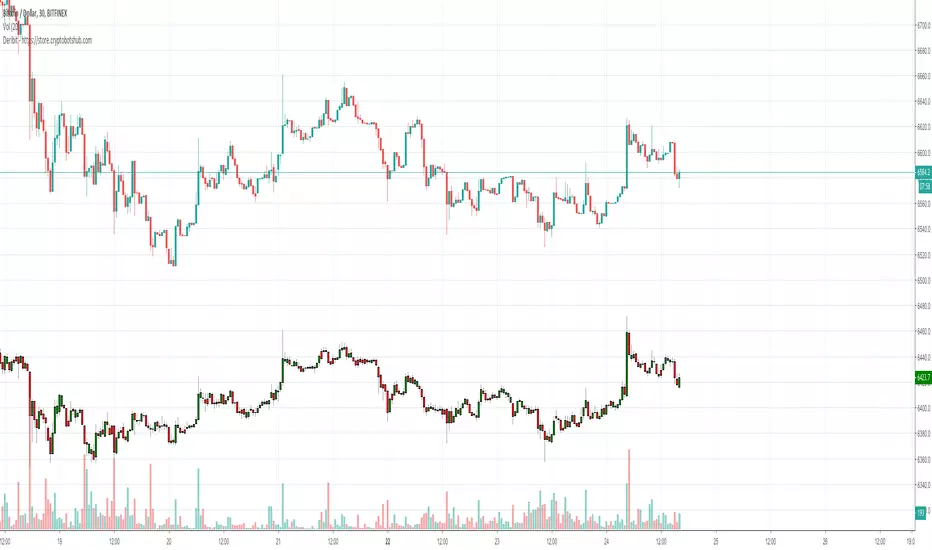
Color Volume Bars [G.Freitas] V 0.1Paints the candlesticks according to its volume levelPine Script® indicatorby guirf001111155
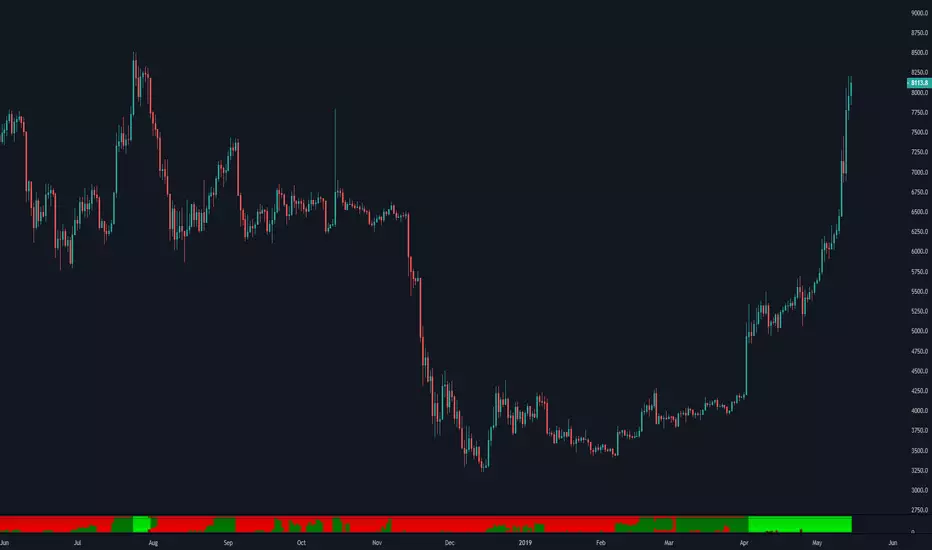
Margin Changes Per BarBased on Made a few changes to better show why price might be going up or down. Increase in longs (lime) and decrease in shorts (teal) are added up and plotted above 0 Increase in shorts (red) and decrease in longs (gray) are added up and plotted below 0 Pine Script® indicatorby null-1143
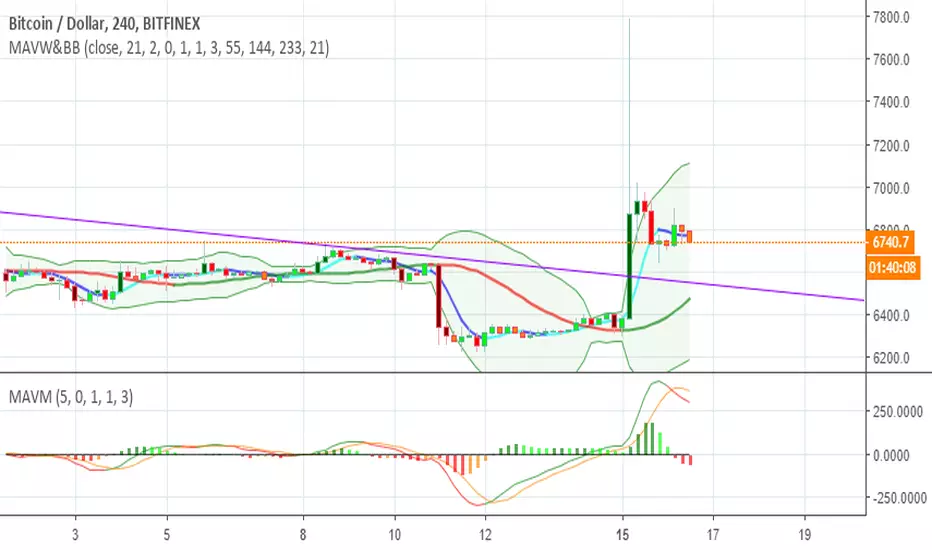
MavilimW/Double+Colored Volume BarMavilimW/Double+Colored Volume BarPine Script® indicatorby bilgindurmazUpdated 11166
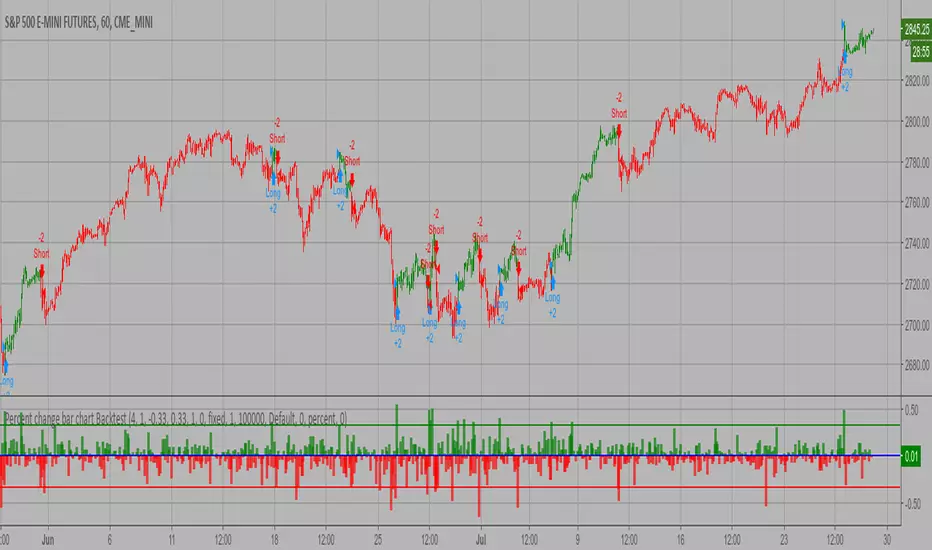
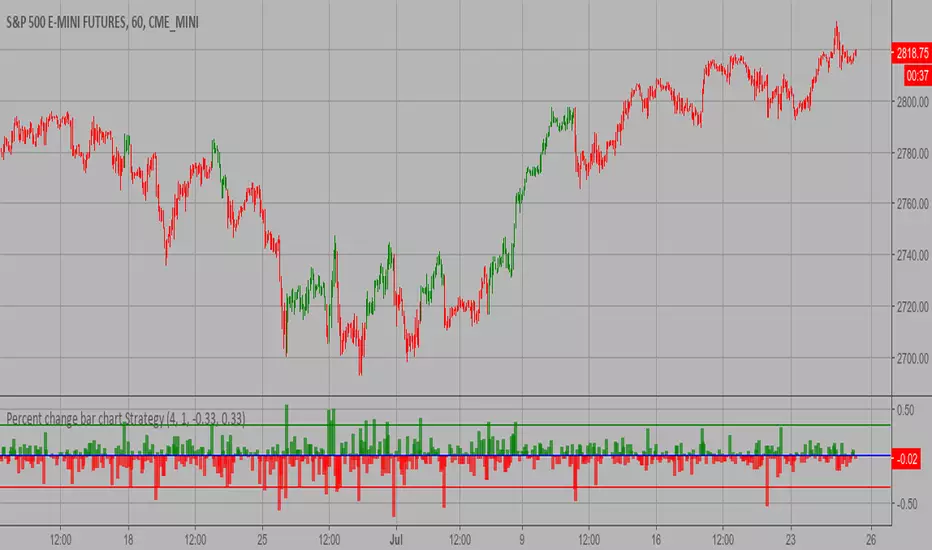
Percent change bar chart Backtest This histogram displays price or % change from previous bar. You can change long to short in the Input Settings WARNING: - For purpose educate only - This script to change bars colors.Pine Script® strategyby HPotter6682
Percent change bar chart Strategy This histogram displays price or % change from previous bar. WARNING: - This script to change bars colors.Pine Script® indicatorby HPotter41
dual ma cross colored barsSimple Indicator that colors the bars based on whether the fast ma is over or under the slow ma to visually identify trends and when do the crossover occur.Pine Script® indicatorby MohitMarwaha20
EdgeAnalysisGroup: Volume BarsVolume painted bars to show primary trends and short-term floats during low volume.Pine Script® indicatorby TheKujiras11166
Super Gupper Bar I modified the script of Madrid ,to make a super guppy, the interpretation is the same except that here the super guppy is in linear format. You can still see the pullback and the bullish and bearish trends as with a super guppy! The EMA 200 is placed just above the EMA 70, otherwise it was a big empty space between the last 2 EMA! You can chose between EMA or MA 1. Red : A downtrend in progress 2. Green: Trend reversal warning 3. Lime : An uptrend in progress 4. Maroon: Trend reversal warning www.tradingview.comPine Script® indicatorby jod17Updated 44283
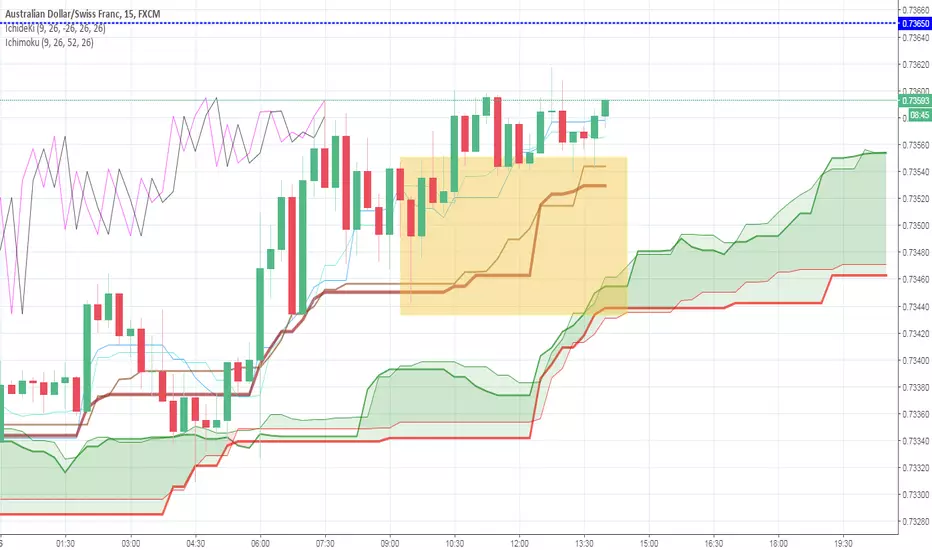
Ichimoku on closing price without current bar @bhutanoThis is the "Ichimoku" rivisited. The current bar is not considerated on the plotting (so less chance to confusion) and the averages are calculated on the closing prices. It seems to be more precise then the original one. Leave me a comment please based on your experiencePine Script® indicatorby BLOCKCHAINme28