Bitcoin Exchanges PremiumThis is a % premium vs average BTCUSD price. In other words, how much % more are exchanges selling bitcoin at compared to normal BTCUSD price?
Blue: Korea
Red: Japan
Yellow: China
Green: USD Exchanges including Bitfinex, Poloniex, Coinbase, and Bitstamp
Search in scripts for "bitcoin"
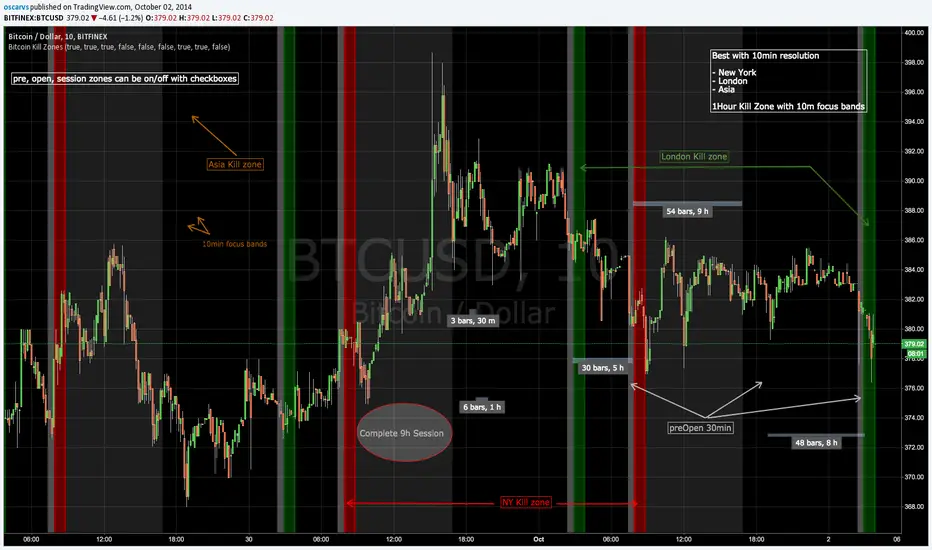
Bitcoin Kill ZonesGRAB THE LASTEST VERSION HERE:
*********************
This indicator shows when the candle is entering New York, London or Asia Kill Zone (open market).
gray: 30min before market opens.
red, green, orange: First 1 hour with 10min focus bands.
silver: complete 30min session market until close.
FIX NOTE:
Set this hours for Asia to fix the 1 hour difference:
2330-0000
0000-0010
0010-0050
0050-0100
0100-0900
* this is beta, in planning to mark dynamically ranges before/after open/close session and use some Fibs to have some ripple effect indicator
Updated code: github.com
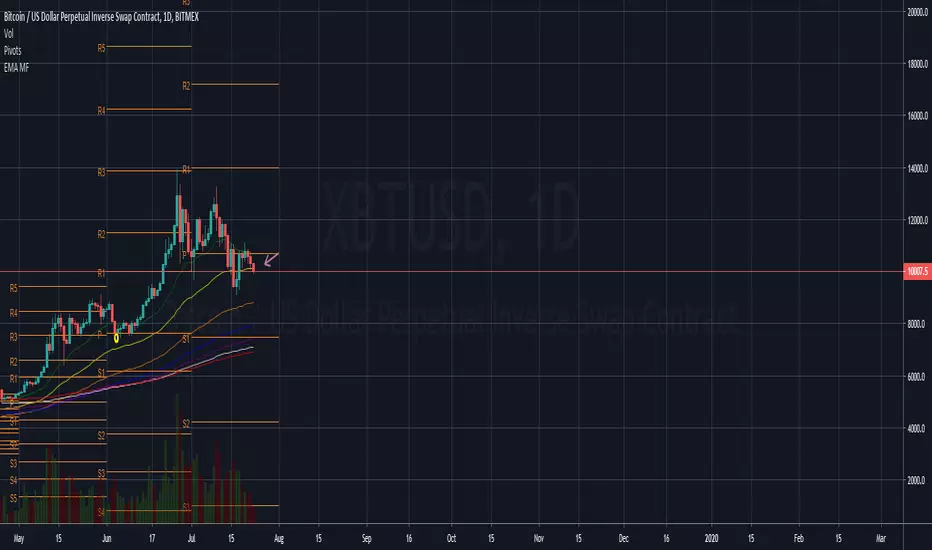
EMA MF - EMA (21,50,100,200,250,300)Hey guys
a simple script for some EMA's at one indicator
For signals news TA and more join BitcoinMF
Links are at the TV profile
--
This is not financial advice
DYOR
Trade Safe and Good Luck
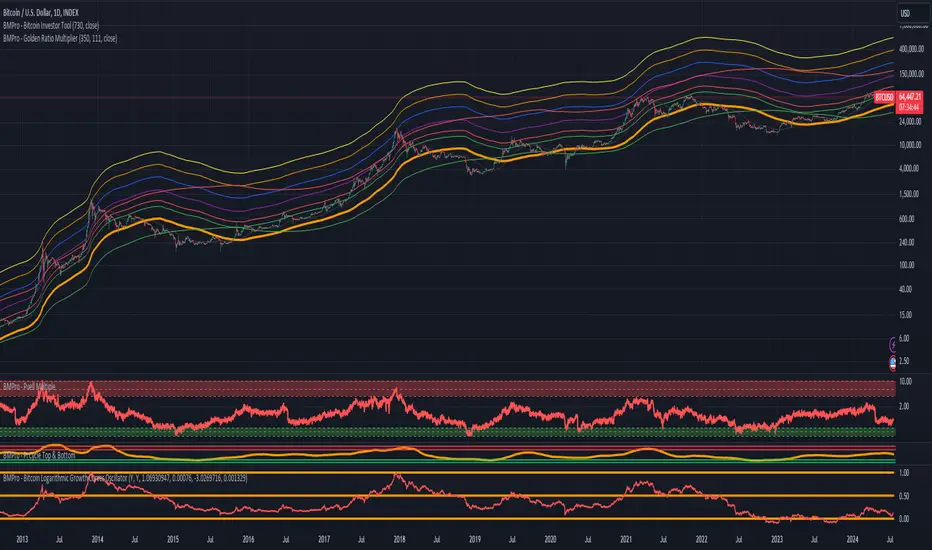
LIB: Bitcoin Investor ToolIndicator Overview
The 2-Year MA Multiplier is intended to be used as a long term investment tool.
It highlights historically good periods to buy or sell Bitcoin during the market cycles that Bitcoin goes through.
To do this, it uses a moving average line, the 2yr MA, and also a multiplication of that moving average line, 2yr MA x5.
Note: the x5 multiplication is of the price values of the 2yr moving average, not of its time period.
Buying Bitcoin when price drops below the 2yr MA (green line) has historically generated outsized returns. Selling Bitcoin when price goes above the 2yr MA x 5 (red line) has been historically effective for taking profit.
Why This Happens
As Bitcoin is adopted, it moves through market cycles. These are created by periods where market participants are over-excited causing the price to over-extend, and periods where they are overly pessimistic where the price over-contracts. Identifying and understanding these periods can be beneficial to the long term investor.
This tool is a simple and effective way to highlight those periods.
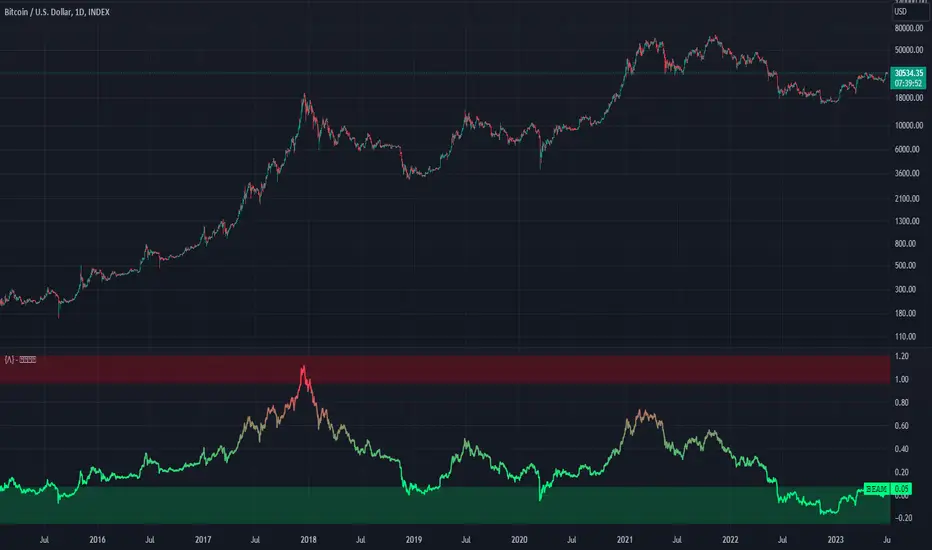
Bitcoin Economics Adaptive MultipleBEAM (Bitcoin Economics Adaptive Multiple) is an indicator that assesses the valuation of Bitcoin by dividing the current price of Bitcoin by a moving average of past prices. Its purpose is to provide insights into whether Bitcoin is under or overvalued at any given time. The thresholds for the buy and sell zones in BEAM are adjustable, allowing users to customize the indicator based on their preferences and trading strategies.
BEAM categorizes Bitcoin's valuation into two distinct zones: the green buy zone and the red sell zone.
Green Buy Zone:
The green buy zone in BEAM indicates that Bitcoin is potentially undervalued. Traders and investors may interpret this zone as a favorable buying opportunity. The threshold for the buy zone can be adjusted to suit individual preferences or trading strategies.
Red Sell Zone:
The red sell zone in BEAM suggests that Bitcoin is potentially overvalued. Traders and investors may consider selling their Bitcoin holdings during this zone to secure profits or manage risk. The threshold for the sell zone is adjustable, allowing users to adapt the indicator based on their trading preferences.
Methodology:
BEAM calculates the indicator value using the following formula:
beam = math.log(close / ta.sma(close, math.min(count, 1400))) / 2.5
The calculation involves taking the natural logarithm of the ratio between the current price of Bitcoin and a simple moving average of past prices. The moving average period used is a minimum of the specified count or 1400, providing a suitable historical reference for valuation assessment.
The resulting value of BEAM provides a standardized measure that can be compared across different time periods. By adjusting the thresholds for the buy and sell zones, users can customize BEAM to their preferred levels of undervaluation and overvaluation.
Utility:
BEAM serves as a tool for investors in the Bitcoin market, offering insights into Bitcoin's valuation and potential buying or selling opportunities. By monitoring BEAM, market participants can gauge whether Bitcoin is potentially undervalued or overvalued, helping them make informed decisions regarding their Bitcoin positions.
It is important to note that BEAM should be used in conjunction with other technical and fundamental analysis tools to validate signals and avoid relying solely on this indicator for trading decisions. Additionally, traders and investors are encouraged to adjust the threshold values based on their specific trading strategies, risk tolerance, and market conditions.
Credit: The BEAM (Bitcoin Economics Adaptive Multiple) indicator was originally developed by BitcoinEcon
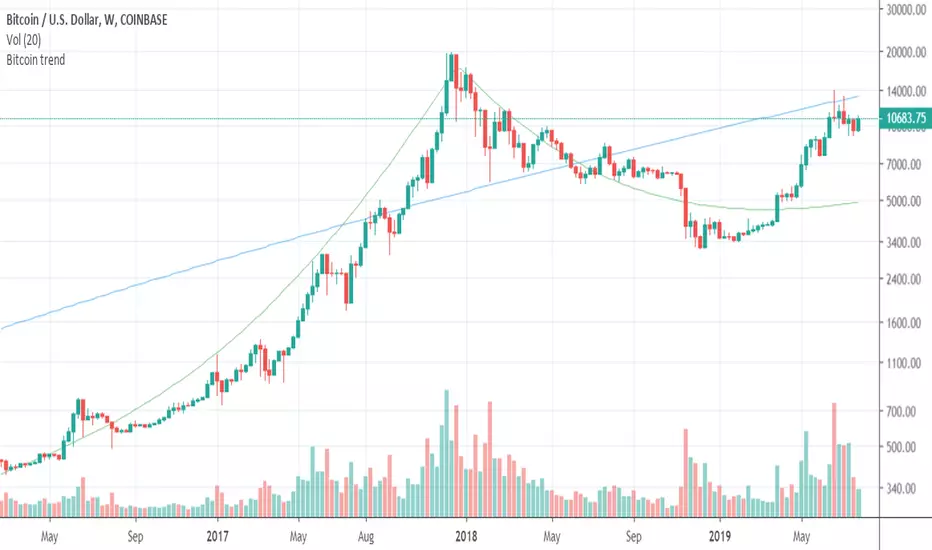
Bitcoin long term trendsThis script shows the long term trends in Bitcoin price.
It is based on my mathematical formula for the long term trends.
The blue line is a long term trend as a power function B = (t/693)^5.526
And the green line is a more sophisticated trend, which models the wave behavior over the whole history of bitcoin.
This script is only applicable to BTCUSD price. The trend lines are calculated as the functions of time only.
BITFINEX:BTCUSD
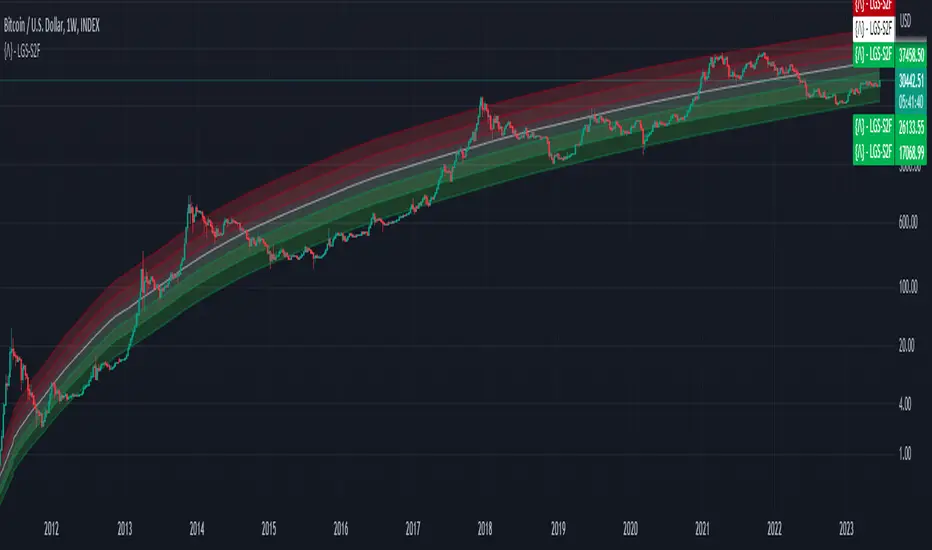
Bitcoin Limited Growth ModelThe Bitcoin Limeted Growth is a model proposed by QuantMario that offers an alternative approach to estimating Bitcoin's price based on the Stock-to-Flow (S2F) ratio. This model takes into account the limitations of the traditional S2F model and introduces refinements to enhance its analysis.
The S2F model is commonly used to analyze Bitcoin's price by considering the scarcity of the asset, measured by the stock (existing supply) relative to the flow (new supply). However, the LGS-S2F Bitcoin Price Formula recognizes the need for improvements and presents an updated perspective on Bitcoin's price dynamics.
Invalidation of the Normal S2F Model:
The normal S2F model has faced criticisms and challenges. One of the limitations is its assumption of a linear relationship between the S2F ratio and Bitcoin's price, overlooking potential nonlinearities and other market dynamics. Additionally, the normal S2F model does not account for external influences, such as market sentiment, regulatory developments, and technological advancements, which can significantly impact Bitcoin's price.
Addressing the Issues:
The LGS-S2F Bitcoin Price Formula introduces refinements to address the limitations of the traditional S2F model. These refinements aim to provide a more comprehensive analysis of Bitcoin's price dynamics:
Nonlinearity: The LGS-S2F model recognizes that the relationship between the S2F ratio and Bitcoin's price may not be linear. It incorporates a logistic growth function that considers the diminishing returns of scarcity and the saturation of market demand.
Data Analysis: The LGS-S2F model employs statistical analysis and data-driven techniques to validate its predictions. It leverages historical data and econometric modeling to support its analysis of Bitcoin's price.
Utility:
The LGS-S2F Bitcoin Price Formula offers insights for traders and investors in the cryptocurrency market. By incorporating a more refined approach to analyzing Bitcoin's price, this model provides an alternative perspective. It allows market participants to consider various factors beyond the S2F ratio alone, potentially aiding in their decision-making processes.
Key Features:
Adjustable Coefficients
Sigma calculation methods: Normal or Stdev
Credit:
The LGS-S2F Bitcoin Price Formula was developed by QuantMario, who has contributed to the field of cryptocurrency analysis through their research and modeling efforts.
Bitcoin Puell Multiple (BPM)The Bitcoin Puell Multiple is a key indicator for evaluating buying and selling opportunities based on the profitability of Bitcoin miners.
The Idea
The Bitcoin Puell Multiple is a ratio that measures the daily profitability of Bitcoin miners in relation to the historical annual average of this profitability. It is calculated by dividing the amount of newly issued Bitcoins (in USD) each day by the 365-day moving average of that same amount. This indicator provides valuable information on Bitcoin's market cycles, helping investors to identify periods when Bitcoin is potentially undervalued or overvalued.
How to Use
To use the Bitcoin Puell Multiple, investors watch for extreme levels of the indicator. A high Puell Multiple suggests that miners are making exceptionally high profits compared to the previous year, which could indicate an overvaluation of Bitcoin and a selling opportunity (red zones). Conversely, a low Puell Multiple indicates that miners' earnings are low relative to history, suggesting an undervaluation of Bitcoin and a potential buying opportunity (green zones). The trigger thresholds for these zones can be configured in the tool's parameters.
What makes this tool different from the other "Puell Multiple" scripts available is that it is up to date in terms of its data sources, with a more precise calculation, and allows you to view the entire history.
Zone trigger limits and their visualization, as well as colors, are all configurable via the tool parameters.
Here, for example, is a configuration with more sensitive trigger levels and a different color:

Bitcoin Halving Rainbow + S2F Model PriceOverview
The rainbow price line:
This script creates a colorful view of Bitcoin's price action, where different colors indicate the time until the next halving date. The color scale in the top right highlights what each main color group represents in terms of days until the next halving. Using historical data, the simple indication of days until the next halving has somewhat accurately predicted potential bottoms and tops of market cycles. Comparing current colors to previous cycles provides a rough view of where BTC is in its current cycle and what to expect going forward until the next halving date.
In addition to the colored price action, I have incorporated the stock-to-flow model price for Bitcoin.
The stock-to-flow (S2F) model price:
The stock-to-flow ratio is a calculation that aims to estimate how many years are required to produce the current stock of an asset, based on the current production rate. When applied to Bitcoin, we simply divide the total amount of bitcoins in circulation by the amount of bitcoins mined in a certain timeframe. Once we have this value, we can calculate a model price based on the stock-to-flow ratio. This S2F model price uses a 463-day moving average. Preston Pysh came up with this number as he believed Bitcoin cycles happen in three phases: bull run, correction, and a reversion to the mean. He estimated there are about 200,000 blocks per cycle, three phases per cycle, and ~144 blocks per day. Dividing all three gets us 463. I have removed 1,000,000 coins from this calculation to account for Satoshi's coins.
The process I took to plot this model price (credit to PlanB for originally creating this calculation):
-Declare constant variables for the halving period, starting block reward, and the number of coins Satoshi owns.
-Fetch the block index by using the request.security() function.
-Determine the number of halvings that have occurred by dividing the block index by the halving period.
-Calculate the current block reward by multiplying the initial block reward by 0.5 raised to the power of the number of halvings.
-Calculate the number of blocks mined per period (day or week) and derive the stock (total bitcoins in circulation minus Satoshi's coins) and flow (annual block rewards) from it.
-Calculate the S2F ratio by dividing the stock by the flow.
-Calculate the S2F model price by applying a mathematical formula (ModelPrice = exp(-1.84) * S2F to the power of 3.36) along with a 463-day moving average.
** Please note, due to the use of the 463-day MA, the first ~400 days of the S2F model price is not entirely accurate.
In addition to the above, I have added vertical lines on each halving date, along with labels that have a tooltip if you hover over them, which will show more information about that particular halving.
Important tips:
-This script has been designed to work on the 1-Day timeframe but can also work on the 1-Week timeframe. Any other timeframe will not accurately plot all the information due to the way I have developed the script.
-This script is best used on the ticker I have posted this on, "INDEX:BTCUSD". It can also work on "BLX" or "BITSTAMP:BTCUSD".
-Hide candles when using the script to just show the halving rainbow (hover over the symbol name in the top left and press the eye icon).
-Right-click the price scale and select "Scale price chart only" to get a better view of the plots.
-Right-click the price scale and select "Logarithmic."
-I will update the script as time goes on to show future halvings along with adjusting the next halving date as we get closer (if it changes).
Settings Menu:
Tooltips are included explaining what the settings do, but here's a quick summary:
-'Show Vertical Halving Lines?': Default is true. This allows the user to remove the vertical lines shown on each halving date.
-'Show Halving Labels?': Default is true. This allows the user to remove the info labels shown on each halving date.
-'Halving Line and Label Color': Default is white. This allows the user to change the color of the halving lines and labels to better fit their chart layout.
-'Show Stock to Flow Model Price?': Default is true. This allows the user to remove the S2F model price.
-'Stock to Flow Model Price Color': Default is white. This allows the user to change the color of the S2F model price to better fit their chart layout.
-'Draw Color Table?': Default is true. This allows the user to remove the color table in the top right of the chart.
-'Distance rainbow is away from actual price action': Default is 0 (Plots over candles). This allows the user to adjust where the halving rainbow is plotted if they would like to also see candles on the chart. (Use any value under 0.9)
Feel free to message me or comment on the post with any questions or issues!
Much more to come!
Thanks for reading, enjoy!

Bitcoin: Price Action Integral BandsThis indicator tries to display absolute tops and bottoms for Bitcoin. The price action gets integrated with two custom functions resulting in the blue top and red bottom price action integrals. From those integral values we allow 5% deviation in up and down direction, leading to price action integral bands of some non-zero width.
Even in the current liquidity crisis with abnormal price movements, Bitcoin had no weekly candle close below the support band. One thing to note is that in the here presented model, up until now only one single weekly candle touches the blue band in each of Bitcoin's cycles. For longer-term trades it might be a good idea to buy BTC when price is around the red band, and sell/go short when BTC is around the blue band, although this is no financial advice and one should always cross-check with other indicators/informations.
There's the option to plot or hide the bands individually.
The integral bands are specifically designed for the Bitcoin BLX (BraveNewCoin Liquid Index) ticker on weekly timeframe. For other assets, tickers and timeframes the functionality of this indicator cannot be guaranteed and will most probably not deliver meaningful results.

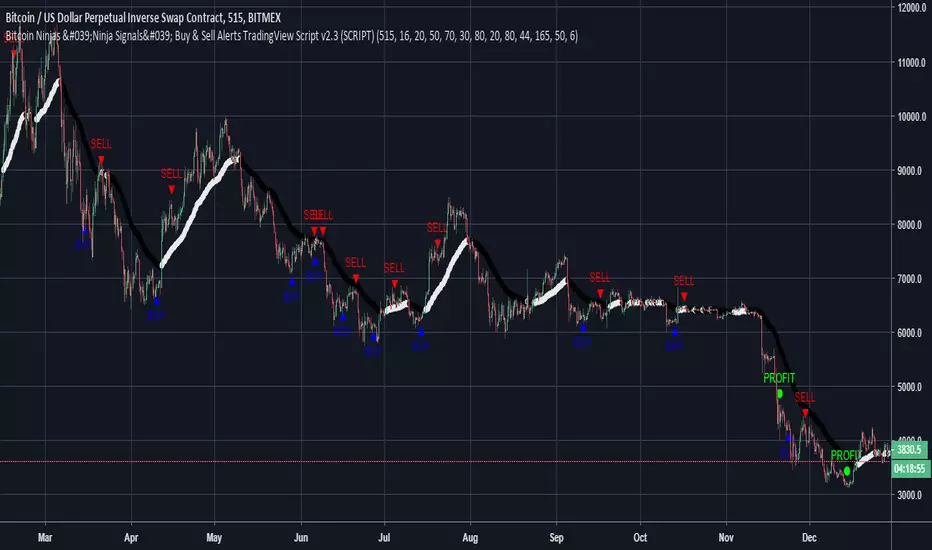
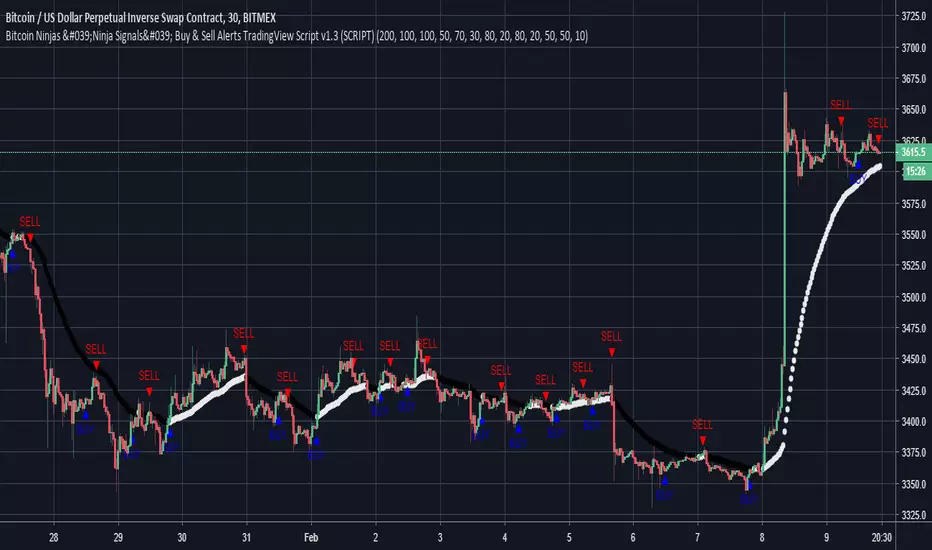
BitcoinNinjas 'Ninja Signals' Buy/Sell Alert Trading Script v3.0Bitcoin Ninjas 'Ninja Signals' Buy/Sell Alerts & Backtesting TradingView Script v3.0
(for Cryptocurrencies, Forex, GunBot, ProfitTrailer, automatic trading software, and more)
This is version 3 of our popular Ninja Signals trading script, which is similar to version 2, but with a new hard-coded calibration (resolution) setting that automatically matches candle size (period) to ensure that no repainting occurs regardless of the number or type of indicators and filters traders apply when configuring the script.
'Ninja Signals' v3.0 (SCRIPT)
'Ninja Signals' v3.0 (STRATEGY)
'Ninja Signals' v2.0 (SCRIPT)
'Ninja Signals' v2.0 (STRATEGY)
'Ninja Signals' v1.0 (SCRIPT)
'Ninja Signals' v1.0 (STRATEGY)
-Allows users to easily set automated buy and sell alerts on TradingView for use with automatic and manual trading of cryptocurrencies, Forex securities, and more (alerts are compatible with automatic trading software such as GunBot, ProfitTrailer, and more).
-Synthesizes many powerful indicators [e.g. Relative Strength Index (RSI), stochastic RSI, Money Flow Index (MFI), Moving Average Convergence Divergence (MACD), etc.) into one super script to generate very precise buy and sell signals in almost any market condition.
-Buy arrows (blue) and sell arrows (red) can be changed or hidden for ease of viewing.
-No lag EMA trendline featuring trend-reversal color-coding (white uptrend, black downtrend).
-Adjustable ‘calibration’ setting allows users to customize the script to work for any currency or security available through TradingView, on any exchange, simply by adjusting a number.
-Complete with backtesting strategy version of script which allows users to test various buy and sell strategies based on the alerts the script generates (see info and screenshots below).
-Backtesting strategy incorporates a user-defined adjustable date range, so users can estimate the script’s performance over specific periods of time, such as the last day, week, or month.
-Backtesting strategy utilizes a minimum protective gain setting to help you never sell for a loss. Simply adjust your minimum profit (%) per trade, and the test results will update.
-Backtesting strategy allows for pyramid buying to test various average down / double up buying strategies. Simply adjust the number of pyramid buys and the quantity of each buy.
- Free 7-day trial available for TradingView users who join our free BitcoinNinjas community.
-Free 24/7 support via BitcoinNinjas Telegram GunBot support group with script purchase.
-Fully compatible with GunBot automatic trading software (TradingView plugin is required).
-Special discount available for traders who purchase GunBot automatic trading software and the GunBot TradingView plugin from BitcoinNinjas, allowing for fully automatic trading.
-Contact us via Email or Telegram for more information, to request additional / custom screenshots, or to start your free trial.
DISCLAIMER: By using our BitcoinNinjas ‘Ninja Signals’ planning script, you agree to the BitcoinNinjas 'Terms of Use', as presented on our website (www.BitcoinNinjas.org) and as stated here. No sharing, copying, reselling, modifying, or any other forms of use are authorized for our documents, script / strategy, and the information published with them. This informational planning script / strategy is strictly for individual use and educational purposes only. This is not financial or investment advice. Investments are always made at your own risk and are based on your personal judgement. Bitcoin Ninjas is not responsible for any losses you may incur. Please invest wisely.

Bitcoin as % Global M2 signalThis script provides signal system:
Buy signal: each time the YoY of the Global M2 rises more than 2.5% while the distance between the bitcoin price as a percentage of the Global M2 is below its yearly SMA.
Sell signal: the distance between the bitcoin price as a percentage of the Global M2 and its yearly SMA is > 0.7
This is a very simple system, but it seems to work pretty well to ride the bitcoin price cycle wave.
The parameters are hard coded but they can be easily changed to test different levels for both the buy and sell signals.

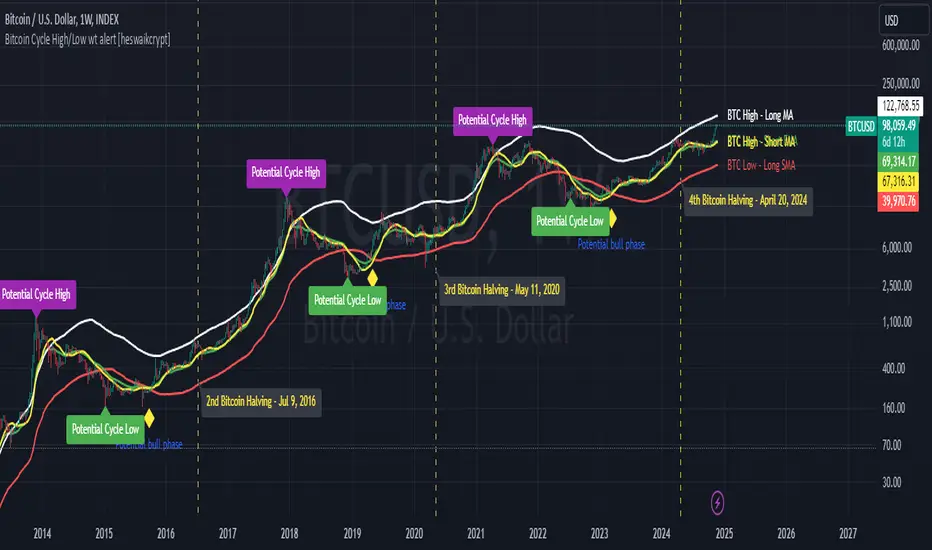
Bitcoin Cycle High/Low with functional Alert [heswaikcrypt]Introduction
Just as machines are fine-tuned for maximum efficiency, trading indicators must evolve to meet the demands of ever-changing markets.
Credit goes to the initial author, @NoCreditsLeft I only improved the existing Pi-cycle indicator with a functional alert and included a bull mode indicator in the script. The alert can help you get a live alert at candle close when the cycle tops, bottoms, and the potential bull phase switch occurs.
Philip Swift’s Pi Cycle Top Indicator is a brilliant example of leveraging mathematical relationships to signal critical turning points in Bitcoin’s price cycles. Historically, it has identified market and local tops with some relative accuracy, often within three days, as demonstrated in all the previous bull run cycles.
At its core, the Pi Cycle Indicator derives its name from the mathematical constant π (pi), achieved by using simple moving averages (MAs) in a specific ratio: 𝜋 = Long MA/short MA
The Bull mode switch is calculated using a crossover of the short exponentia moving average and the long moving average.
.
.
.
Knowing when Bitcoin reaches its top—and receiving timely alerts about it—is crucial for successful trading. The indicator is designed to signal;
Potential Bitcoin tops: Purple label
Potential Bitcoin bottoms : green Label, and
Parabolic swing : Yellow diamond shape (relating to the market switching to a potential bull mode)
"Please note: This indicator is tailored for Bitcoin using historical data analysis and should not be considered definitive. However accurate it might be."
Setting alerts
To set the alert conditions, select any alert function call to get alert whenever the conditions are met. The script is configured on dialy TF; you can set it on 1D or weekly TF.
Enjoy and Trade smartly
Bitcoin wave modelBitcoin wave model is based on the logarithmic regression model and the sinusoidal waves, induced by the halving events.
This chart presents the outcome of an in-depth analysis of the complete set of Bitcoin price data available from October 2009 to August 2023.
The central concept is that the logarithm of the Bitcoin price closely adheres to the logarithmic regression model. If we plot the logarithm of the price against the logarithm of time, it forms a nearly straight line.
The parameters of this model are provided in the script as follows: log (BTCUSD) = 1.48 + 5.44log(h).
The secondary concept involves employing the inherent time unit of Bitcoin instead of days:
'h' denotes a slightly adjusted time measurement intrinsic to the Bitcoin blockchain. It can be approximated as (days since the genesis block) * 0.0007. Precisely, 'h' is defined as follows: h = 0 at the genesis block, h = 1 at the first halving block, and so forth. In general, h = block height / 210,000.
Adjustments are made to account for variations in block creation time.
The third concept revolves around investigating halving waves triggered by supply shock events resulting from the halvings. These halvings occur at regular intervals in Bitcoin's native time 'h'. All halvings transpire when 'h' is an integer. These events induce waves with intervals denoted as h = 1.
Consequently, we can model these waves using a sin(2pih - a) function. The parameter determining the time shift is assessed as 'a = 0.4', aligning with earlier expectations for halving events and their subsequent outcomes.
The fourth concept introduces the notion that the waves gradually diminish in amplitude over the progression of "time h," diminishing at a rate of 0.7^h.
Lastly, we can create bands around the modeled sinusoidal waves. The upper band is derived by multiplying the sine wave by a factor of 3.1*(1-0.16)^h, while the lower band is obtained by dividing the sine wave by the same factor, 3.1*(1-0.16)^h.
The current bandwidth is 2.5x. That means that the upper band is 2.5 times the lower band. These bands are forming an exceptionally narrow predictive channel for Bitcoin. Consequently, a highly accurate estimation of the peak of the next cycle can be derived.
The prediction indicates that the zenith past the fourth halving, expected around the summer of 2025, could result in prices ranging between 200,000 and 240,000 USD.
Enjoy the mathematical insights!

Bitcoin Logarithmic Fractal Growth Model By ARUDDThis model, which I'm calling the Logarithmic Fractal Growth Mode (L.F.G) , uses Bitcoin's mathematical monetary policy to evaluate the future possible price valuation.
It takes into account fractal (and logarithmic) growth as well as how those who hold bitcoins might react to certain events such as changes in supply and demand. It also shows that it is mathematically logical that someday it must become stable.
The information gained from knowing this helps people make more informed decisions when buying bitcoin and thinking of its future possibilities.
The model can serve as some type of general guideline for determining how much bitcoins should be worth in the future if it follows a certain path from its current price.
Modeling Bitcoin's money supply mathematically, and knowing that there is a finite number of them, makes this whole process much more rational than just thinking about the possibilities in pure subjective terms.
Before going any further I want to say that no one can know with absolute certainty what will happen to bitcoins price in the future, but using mathematics gives us an idea of where things are headed.
The results presented here are based on very reasonable assumptions for how bitcoin might continue to grow (and then level out) once there are over 21 million bitcoins in existence.
The model shows that bitcoin's price can never go down to zero (thus creating the "death spiral" phenomenon), and as such, bitcoin has an extremely high probability of becoming stable as it approaches infinity.
Conversely, this model also shows that at some point there is a high probability that bitcoin will not continue to grow exponentially forever.
Credit goes to Quantadelic for the awesome original script.
ARUDD

Bitcoin Ninjas 'Ninja Signals' Script [NLM Edition] (SCRIPT)Private script for research and development purposes based on our popular 'Ninja Signals' script. Public versions of our 'Ninja Signals' script are available below:
Bitcoin Ninjas 'Ninja Signals' Buy & Sell Alert Trading Script : bitcoinninjas.org
'Ninja Signals' v1.0 (SCRIPT)
'Ninja Signals' v1.0 (STRATEGY)
'Ninja Signals' v2.0 (SCRIPT)
'Ninja Signals' v2.0 (STRATEGY)

Bitcoin Leveraged Movement, 3 different short/long views3 different views for bitcoin short/longs. the main view allows you to see changes from one bar to the next.

BitcoinNinjas Ninja Signals Buy/Sell Alert Trading Script v2.0Bitcoin Ninjas 'Ninja Signals' Buy/Sell Alerts & Backtesting TradingView Script v2.0
(for Cryptocurrencies, Forex, GunBot, ProfitTrailer, automatic trading software, and more)
'Ninja Signals' v2.0 (STRATEGY)
'Ninja Signals' v2.0 (SCRIPT)
'Ninja Signals' v1.0 (STRATEGY)
'Ninja Signals' v1.0 (SCRIPT)
-Allows users to easily set automated buy and sell alerts on TradingView for use with automatic and manual trading of cryptocurrencies, Forex securities, and more (alerts are compatible with automatic trading software such as GunBot, ProfitTrailer, and more).
-Synthesizes many powerful indicators [e.g. Relative Strength Index (RSI), stochastic RSI, Money Flow Index (MFI), Moving Average Convergence Divergence (MACD), etc.) into one super script to generate very precise buy and sell signals in almost any market condition.
-Buy arrows (blue) and sell arrows (red) can be changed or hidden for ease of viewing.
-No lag EMA trendline featuring trend-reversal color-coding (white uptrend, black downtrend).
-Adjustable ‘calibration’ setting allows users to customize the script to work for any currency or security available through TradingView, on any exchange, simply by adjusting a number.
-Complete with backtesting strategy version of script which allows users to test various buy and sell strategies based on the alerts the script generates (see info and screenshots below).
-Backtesting strategy incorporates a user-defined adjustable date range, so users can estimate the script’s performance over specific periods of time, such as the last day, week, or month.
-Backtesting strategy utilizes a minimum protective gain setting to help you never sell for a loss. Simply adjust your minimum profit (%) per trade, and the test results will update.
-Backtesting strategy allows for pyramid buying to test various average down / double up buying strategies. Simply adjust the number of pyramid buys and the quantity of each buy.
- Free 7-day trial available for TradingView users who join our free BitcoinNinjas community.
-Free 24/7 support via BitcoinNinjas Telegram GunBot support group with script purchase.
-Fully compatible with GunBot automatic trading software (TradingView plugin is required).
-Special discount available for traders who purchase GunBot automatic trading software and the GunBot TradingView plugin from BitcoinNinjas, allowing for fully automatic trading.
-Contact us via Email or Telegram for more information, to request additional / custom screenshots, or to start your free trial.
DISCLAIMER: By using this BitcoinNinjas document or ‘Ninja Signals’ planning script, you agree to the BitcoinNinjas 'Terms of Use', as presented on our website (www.BitcoinNinjas.org) and as stated here. No sharing, copying, reselling, modifying, or any other forms of use are authorized for our documents, script / strategy, and the information published with them. This informational document and planning script / strategy is strictly for individual use and educational purposes only. This is not financial or investment advice. Investments are always made at your own risk and are based on your personal judgement. BitcoinNinjas is not responsible for any losses you may incur. Please invest wisely.
Bitcoin Ninjas 'Ninja Signals' Buy & Sell Alert Trading ScriptBitcoin Ninjas 'Ninja Signals' Buy/Sell Alerts & Backtesting TradingView Script
(for Cryptocurrencies, Forex, GunBot, ProfitTrailer, automatic trading software, and more)
-Allows users to easily set automated buy and sell alerts on TradingView for use with automatic and manual trading of cryptocurrencies, Forex securities, and more (alerts are compatible with automatic trading software such as GunBot, ProfitTrailer, and more).
-Synthesizes many powerful indicators [e.g. Relative Strength Index (RSI), stochastic RSI, Money Flow Index (MFI), Moving Average Convergence Divergence (MACD), etc.) into one super script to generate very precise buy and sell signals in almost any market condition.
-Buy arrows (blue) and sell arrows (red) can be changed or hidden for ease of viewing.
-No lag EMA trendline featuring trend-reversal color-coding (white uptrend, black downtrend).
-Adjustable ‘calibration’ setting allows users to customize the script to work for any currency or security available through TradingView, on any exchange, simply by adjusting a number.
-Complete with backtesting strategy version of script which allows users to test various buy and sell strategies based on the alerts the script generates (see info and screenshots below).
-Backtesting strategy incorporates a user-defined adjustable date range, so users can estimate the script’s performance over specific periods of time, such as the last day, week, or month.
-Backtesting strategy utilizes a minimum protective gain setting to help you never sell for a loss. Simply adjust your minimum profit (%) per trade, and the test results will update.
-Backtesting strategy allows for pyramid buying to test various average down / double up buying strategies. Simply adjust the number of pyramid buys and the quantity of each buy.
-Free 7-day trial available for TradingView users who join our free BitcoinNinjas community.
-Free 24/7 support via BitcoinNinjas Telegram GunBot support group with script purchase.
-Fully compatible with GunBot automatic trading software (TradingView plugin is required).
-Special discount available for traders who purchase GunBot automatic trading software and the GunBot TradingView plugin from BitcoinNinjas, allowing for fully automatic trading.
-Contact us for more information, to request additional / custom screenshots, or to start your free trial.
DISCLAIMER: By viewing and/or using this TradingView script, you agree to the BitcoinNinjas 'Terms of Use', as presented on our website and as stated here. No sharing, copying, reselling, modifying, or any other forms of use, are authorized for this document. This document is strictly for individual use and informational purposes only. This is not financial or investment advice. Investments are always made at your own risk, and are ba
Bitcoin Monthly Seasonality [Alpha Extract]The Bitcoin Monthly Seasonality indicator analyzes historical Bitcoin price performance across different months of the year, enabling traders to identify seasonal patterns and potential trading opportunities. This tool helps traders:
Visualize which months historically perform best and worst for Bitcoin.
Track average returns and win rates for each month of the year.
Identify seasonal patterns to enhance trading strategies.
Compare cumulative or individual monthly performance.
🔶 CALCULATION
The indicator processes historical Bitcoin price data to calculate monthly performance metrics
Monthly Return Calculation
Inputs:
Monthly open and close prices.
User-defined lookback period (1-15 years).
Return Types:
Percentage: (monthEndPrice / monthStartPrice - 1) × 100
Price: monthEndPrice - monthStartPrice
Statistical Measures
Monthly Averages: ◦ Average return for each month calculated from historical data.
Win Rate: ◦ Percentage of positive returns for each month.
Best/Worst Detection: ◦ Identifies months with highest and lowest average returns.
Cumulative Option
Standard View: Shows discrete monthly performance.
Cumulative View: Shows compounding effect of consecutive months.
Example Calculation (Pine Script):
monthReturn = returnType == "Percentage" ?
(monthEndPrice / monthStartPrice - 1) * 100 :
monthEndPrice - monthStartPrice
calcWinRate(arr) =>
winCount = 0
totalCount = array.size(arr)
if totalCount > 0
for i = 0 to totalCount - 1
if array.get(arr, i) > 0
winCount += 1
(winCount / totalCount) * 100
else
0.0
🔶 DETAILS
Visual Features
Monthly Performance Bars: ◦ Color-coded bars (teal for positive, red for negative returns). ◦ Special highlighting for best (yellow) and worst (fuchsia) months.
Optional Trend Line: ◦ Shows continuous performance across months.
Monthly Axis Labels: ◦ Clear month names for easy reference.
Statistics Table: ◦ Comprehensive view of monthly performance metrics. ◦ Color-coded rows based on performance.
Interpretation
Strong Positive Months: Historically bullish periods for Bitcoin.
Strong Negative Months: Historically bearish periods for Bitcoin.
Win Rate Analysis: Higher win rates indicate more consistently positive months.
Pattern Recognition: Identify recurring seasonal patterns across years.
Best/Worst Identification: Quickly spot the historically strongest and weakest months.
🔶 EXAMPLES
The indicator helps identify key seasonal patterns
Bullish Seasons: Visualize historically strong months where Bitcoin tends to perform well, allowing traders to align long positions with favorable seasonality.
Bearish Seasons: Identify historically weak months where Bitcoin tends to underperform, helping traders avoid unfavorable periods or consider short positions.
Seasonal Strategy Development: Create trading strategies that capitalize on recurring monthly patterns, such as entering positions in historically strong months and reducing exposure during weak months.
Year-to-Year Comparison: Assess how current year performance compares to historical seasonal patterns to identify anomalies or confirmation of trends.
🔶 SETTINGS
Customization Options
Lookback Period: Adjust the number of years (1-15) used for historical analysis.
Return Type: Choose between percentage returns or absolute price changes.
Cumulative Option: Toggle between discrete monthly performance or cumulative effect.
Visual Style Options: Bar Display: Enable/disable and customize colors for positive/negative bars, Line Display: Enable/disable and customize colors for trend line, Axes Display: Show/hide reference axes.
Visual Enhancement: Best/Worst Month Highlighting: Toggle special highlighting of extreme months, Custom highlight colors for best and worst performing months.
The Bitcoin Monthly Seasonality indicator provides traders with valuable insights into Bitcoin's historical performance patterns throughout the year, helping to identify potentially favorable and unfavorable trading periods based on seasonal tendencies.

Bitcoin Fundamentals - Bitcoin Block RewardThe Bitcoin Block Reward is the batch of new Bitcoins generated by the miners after solving each block.
The Block Reward is set as a basic rule and cannot be changed without agreement between the entire Bitcoin network. It started at 50 BTC during the first period. Afterwards the Block Reward gets adjusted to half of it value (Halving Event) on each cycle of 210000 blocks mined.
This is the only way that new bitcoins are created. It creates an incentive for miners to secure the network.
Over time the Block Reward will decreases to a value that might not cover the mining costs. At that point, the use of the Bitcoin Network might have increased sufficiently as to generate enough transaction fees to cover the mining costs.
MOTIVATION
Even though this is a very simple indicator, I'm currently missing a data source to compute the Block Reward value within Tradingview. Therefore, I created this indicator and its associated library function to enable its visualization and (eventually) for coders to make use of the source function to power more elaborate scripts related to the Halving Events.
Hope that helps!

Bitcoin Comparison to GBTC!This script tells you if GBTC is overvalued or undervalued compared to Bitcoin.

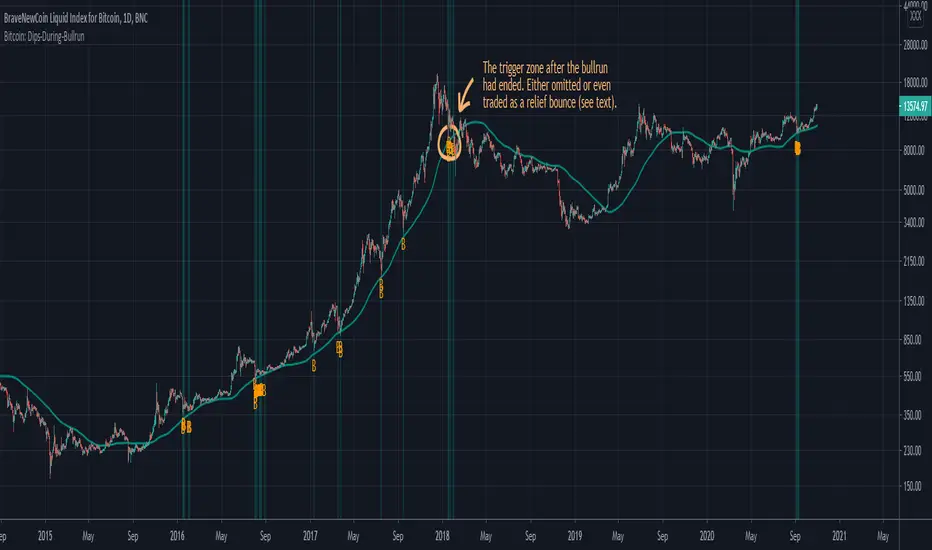
Bitcoin: Dips During BullrunThis script is designed to show dips during Bitcoin bull markets, assuming that Bitcoin finds its local low points in that market phase mostly around the MA(20W=140D) while having a low RSI value. Some other condition is also used to really only trigger after a distinct uptrend has begun. This indicator should only be used on the daily (D) timeframe, and preferably for the BraveNewCoin Liquid Index for Bitcoin (BLX). It's mostly for convenience as people could also just track the MA and the RSI closely, and additionally watch for evidence of a starting bull market. It is yet to be seen if Bitcoin really finds its local bottoms in this bull cycle based on those rules, but the latest price action looks promising. The indicator triggered a few weeks ago, so that the start of the next parabolic run of Bitcoin might be just around the corner.
Note that this algorithm is rather rudimentary, and it will also trigger in one more zone after the bullrun has already ended (marked on the chart above), as the first retest of the MA(20W) shows similar behaviour in the RSI as during bullrun dips. However with other indicators DeanTrader provides (as e.g. the "Bitcoin: Price Action Integrals", and the "Bitcoin: Top & Bottom Mini-Algo" indicators), it should be possible to determine when the bullrun has roughly ended to then discard this indicator until the next bull phase starts sometime in the future. Also some people might even want to trade the relief bounce based on that after-bullrun trigger.
You can hide the MA, as well as the green overlay and/or the plotted "B"s, if you only want to see some part of this indicator on your chart.
For access please contact me via DM on TradingView or on Twitter (linked on my TradingView profile and in my signature).