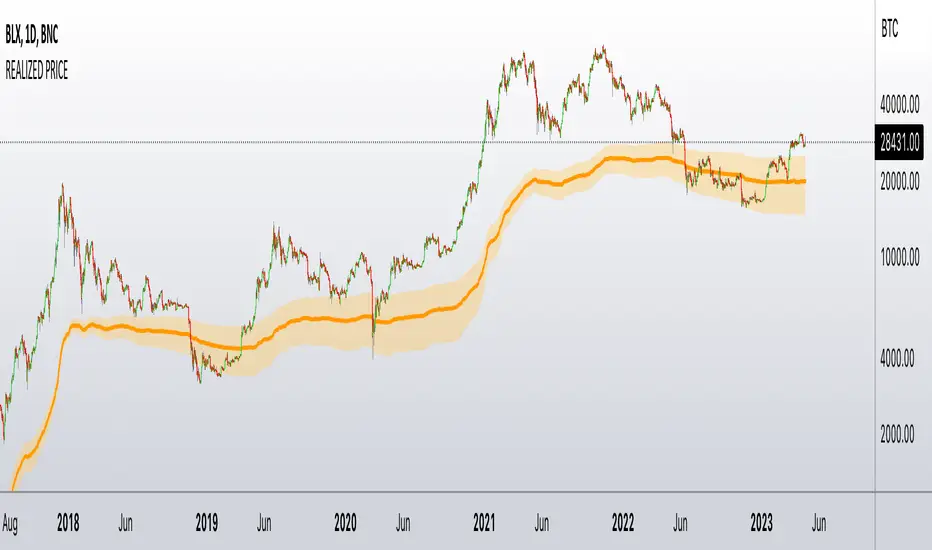
Realized PriceBitcoin Realized Price is a metric that determines the value of all bitcoins in circulation by dividing the total purchase price by the number of bitcoins. This provides traders with the average cost basis for all bitcoins in circulation, which is also known as Realized Price.
Unlike the current Market Price that reflects the current value of CRYPTOCAP:BTC , Realized Price shows the average purchase price of all bitcoins in circulation. It is essential to note that Realized Price values each UTXO based on the value when it last moved from one wallet to another, assuming that the movement represents the purchase of the bitcoins.
The significance of Bitcoin Realized Price lies in its ability to provide traders with an overall economic perspective of the Bitcoin market. When the CRYPTOCAP:BTC Market Price exceeds the Realized Price, the market participants are making a profit on average. Conversely, when the CRYPTOCAP:BTC Market Price is lower than the Realized Price, traders are incurring paper losses on average.
It's worth noting that Realized Price is a modification of Realized Cap, created in 2018 by Antoine Le Calvez.
In addition to BTC I have added LTC and ETH
NB!
Script is history data depended - use on charts with most history data
BTC -> BNC:BLX
ETH -> BITSTAMP:ETHUSD
LTC -> BITFINEX:LTCUSD
it plots realized price and its deviation - when price break out from these bands it explodes hard - near the realized price is good to accumulate the coin - it is fair price
Examples
BTC
ETH
LTC
Search in scripts for "bitcoin"
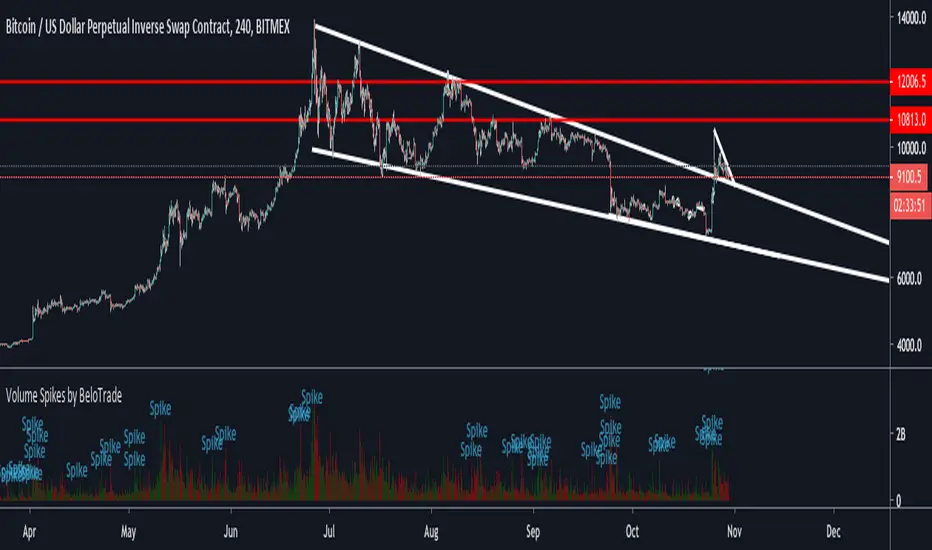
Volume Spikes by BeloTradeBitcoin: 3 Times Bigger / 20 Period
Big Altcoins: 4 Times Bigger / 20 Period
Small Altcoins 5 Times Bigger / 20 Period
Always apply this settings with the price context.
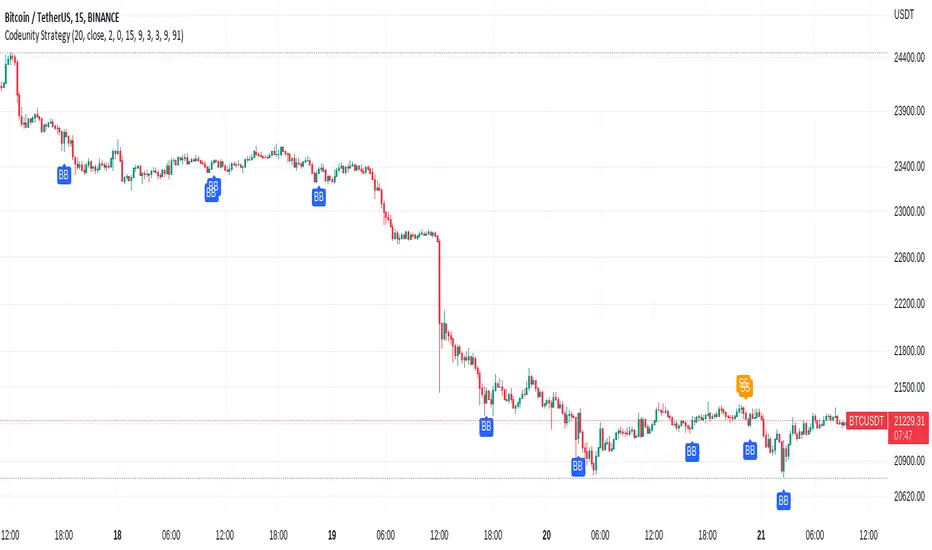
Code Unity 1.0Bitcoin 15 minutes strategy.
Bitcoin 15 minutes strategy.
Bitcoin 15 minutes strategy.
Bitcoin 15 minutes strategy.
Bitcoin 15 minutes strategy.
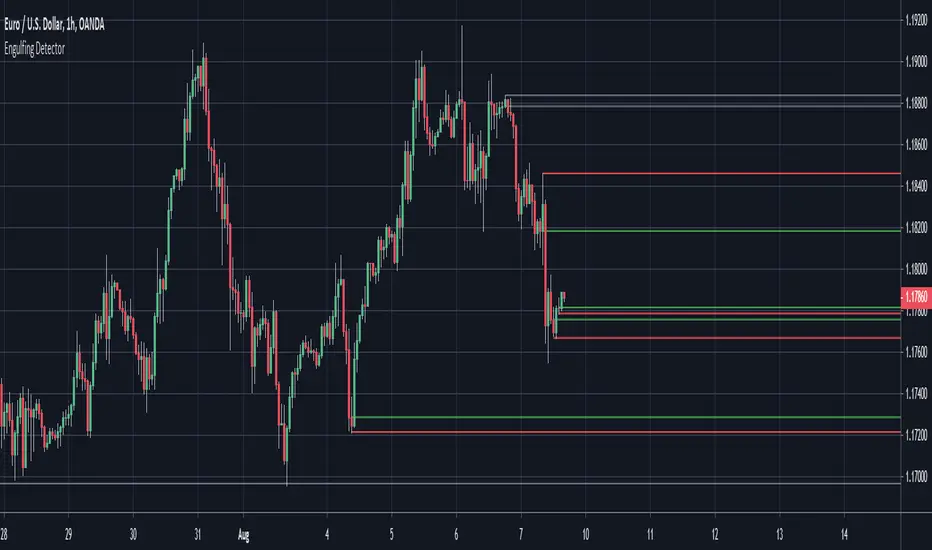
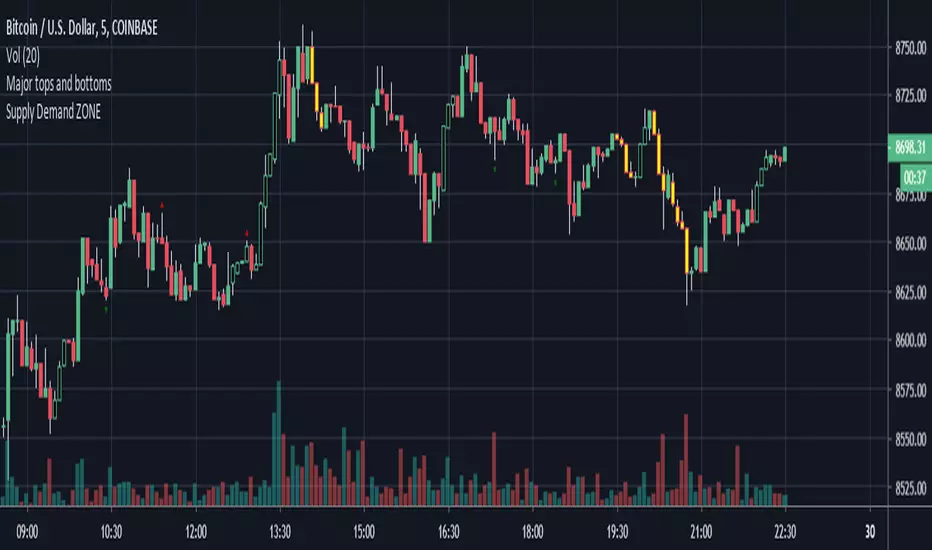
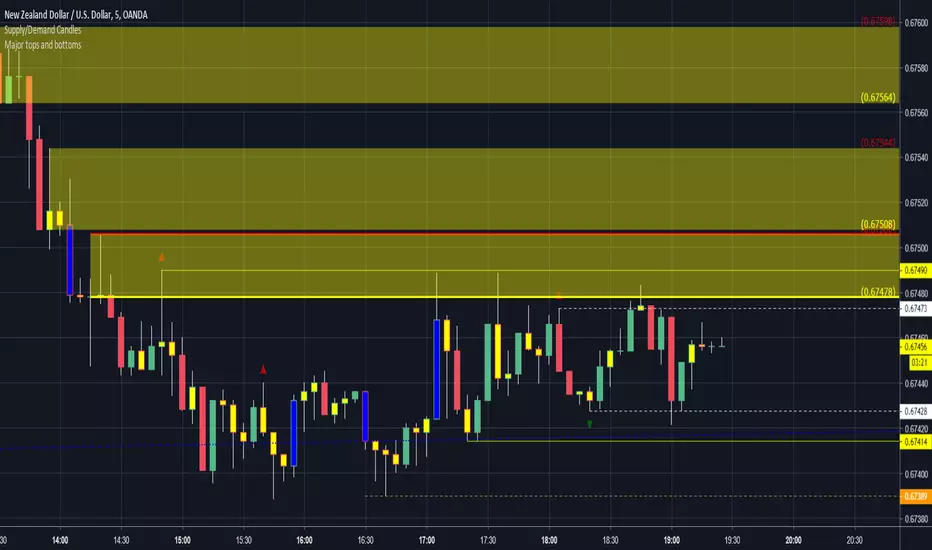
Engulfing Detector (Supply and Demand)Bullish and bearish engulfing candles marked with horizontal lines around engulfed candle.
This indicator can be used to assist in locating potential supply and demand zones.
The fresh zones will be of green and red line colors and the tested zone lines are grey in color.
Hash Finder [Cocosta]Bitcoin is a blockchain based asset and this makes difference from other asset. Thus more hash power they get, price usually get higher.
This indicator find and tells you a spot with biggest gap between where hashrate-based theory price and market value.
We all know there is no "Cure all" tool for trading.
So here it is.
This indicator is specifically DESIGNED ONLY FOR BITCOIN.
No use for other assets at all.

Incremental Lines Above and BelowPut lines above and below current price by a specified value. The step value refers to the mintick value of the symbol. (e.g. BTCUSD has a mintick value of 0.01 so if you wanted an increment of $12.50 you would use 1250 for the number of steps between value)
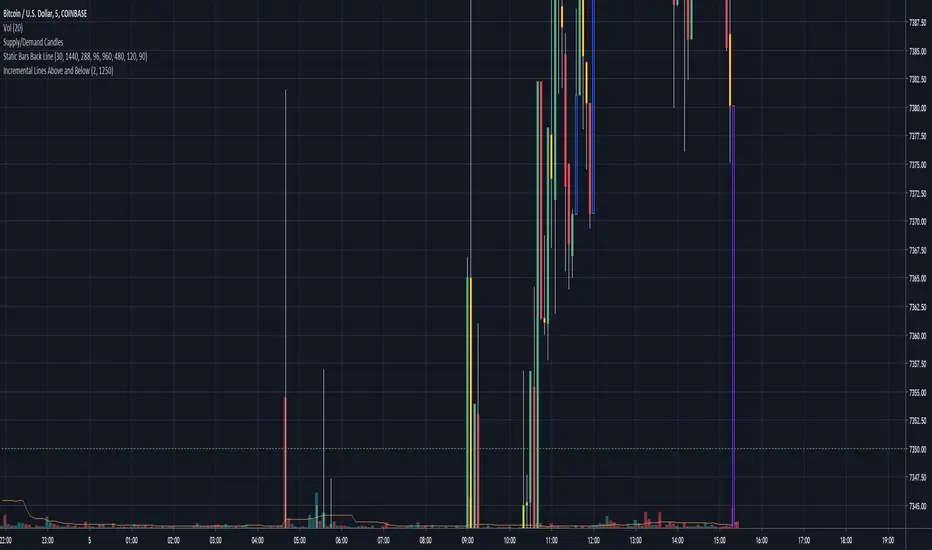
Engulfing Detector (Supply and Demand)Bullish and bearish engulfing candles marked with horizontal lines around engulfed candle. Currently looks a max of 2000 bars back.
This indicator can be used to assist in locating potential supply and demand zones.
The fresh zones will be of green and red line colors and the tested zone lines are grey in color.

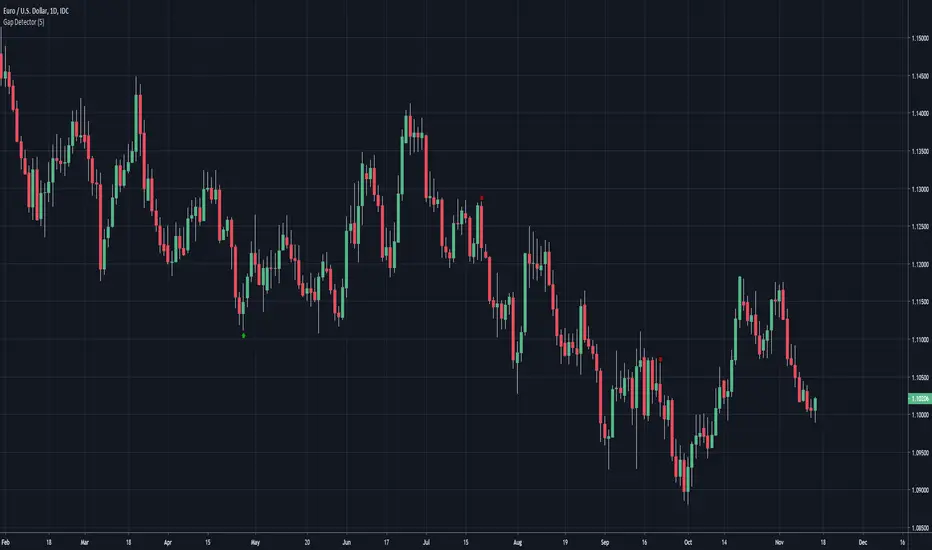
Gap DetectorArrow at candle where bullish or bearish gap occurred by a configurable minimum pip distance


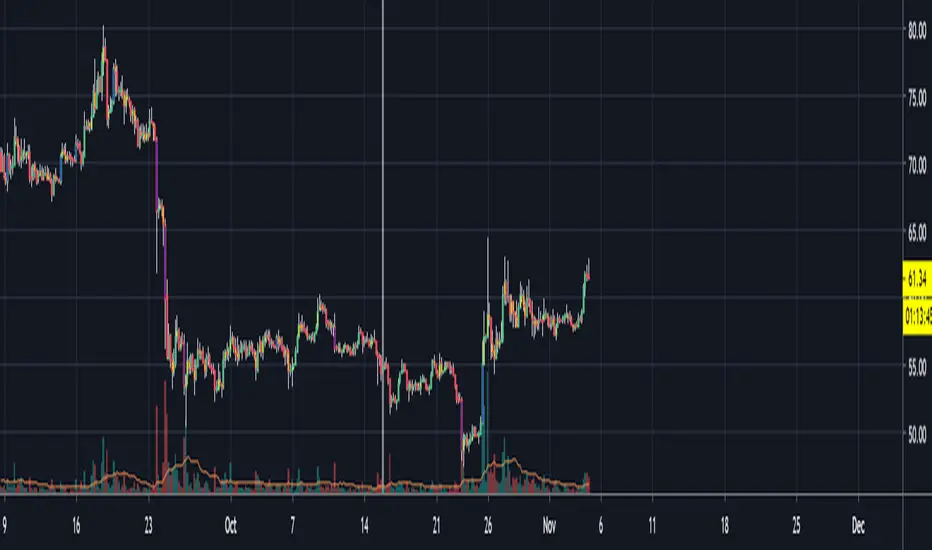
Kruxin Flow Sacred NumbersBitcoin has had its ups and down and it has been hard to predict when trends may end for some and with that I am releasing my work on sacred numbers and indicators.
Kruxin Flow
It has built in Volume Weight Average Price which turn green and red when price is above/below.
Checkbox to enable extended VWAP price areas for future support/restistance use.
Envelope Fib 35 Transparent background showcase mean reversion theory with in greater swing trades.
Dynamic 1.618 Target Checkbox in options for alert usage! Key for spotting breakout buying areas and parabolic markets!
When price is above and bullish the chart will color itself accordingly why keep drawing lines?
Bitcoin may be the saving grace of freedom.
#litecoinfam
Donations greatly appreciated.
Bitcoin may be the saving grace of freedom.
Bitcoin Address:
1B8WshCbkH58RSsxTccBFYPV76tXhdPNUp
Litecoin Adress:
LhT4KGrUwdLZQT3Hw7Go1u2b8vam1yLDk8

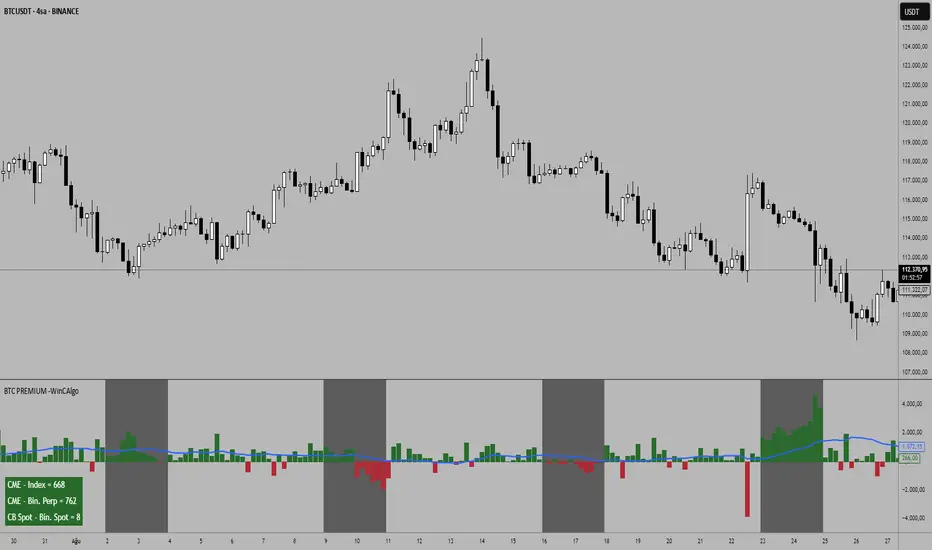
BTC Premium -WinCAlgoBitcoin Premium/Discount Tracker
This indicator tracks the premium or discount between different Bitcoin markets, helping traders identify arbitrage opportunities and market sentiment shifts.
What it shows:
CME vs Index: Price difference between CME Bitcoin futures and BTC index
CME vs Binance Perpetual: Spread between traditional futures and crypto perpetual contracts
Coinbase vs Binance Spot: Price difference between major spot exchanges
Moving Averages: 20-period smoothed trend lines for each spread
CME Market Hours: Automatically detects when CME is closed (weekends)
How to interpret:
Positive Values (Green): First market trading at premium to second market
Negative Values (Red): First market trading at discount to second market
Large Spreads: Indicate potential arbitrage opportunities or market stress
Converging Spreads: Suggest market equilibrium and efficient pricing
Diverging MA: May signal trend changes in market dynamics
📌 Trading Applications:
Arbitrage Detection: Identify price discrepancies between markets
Market Sentiment: Premium/discount patterns often reflect institutional vs retail sentiment
Weekend Analysis: CME closure periods can create temporary price dislocations
Risk Assessment: Large persistent premiums may indicate overheating in specific markets
Entry Timing: Use spread normalization as confluence for position entries
Key Features:
Smart Timeframe: Automatically switches to daily data on higher timeframes
CME Hours Detection: Shows "No Data" during CME closure with background highlighting
Customizable Display: Toggle different spread calculations and moving averages
Real-time Table: Current values displayed in customizable table
Visual Clarity: Color-coded columns and clear positive/negative distinction
Market Sentiment Vote - Up or DownBitcoin Sentiment Vote - Up or Down
This indicator is used to analyze the general sentiment of investors towards Bitcoin, using weekly votes to show whether the majority of traders expect the price to rise or fall. It serves as a gauge to determine whether the prevailing market sentiment is "Bullish" (uptrend) or "Bearish" (downtrend).
Components of the Indicator on the Chart:
Black Line: Represents the Bitcoin price (BTC Price).
Green Bars: "Up" votes (Bullish sentiment - market is expected to rise).
Red Bars: "Down" votes (Bearish sentiment - market is expected to fall).
Purple Line: The ratio between "Up" votes and "Down" votes (sentiment ratio).
Green Connected Line + Text "Green": When the indicator turns green, signaling positive sentiment for the first time in a while.
SMA-90d + STDV: The 90-day simple moving average and standard deviations used to identify abnormal changes in market sentiment.
This indicator allows traders to anticipate shifts in market sentiment based on crowd psychology, offering an early signal of potential trends

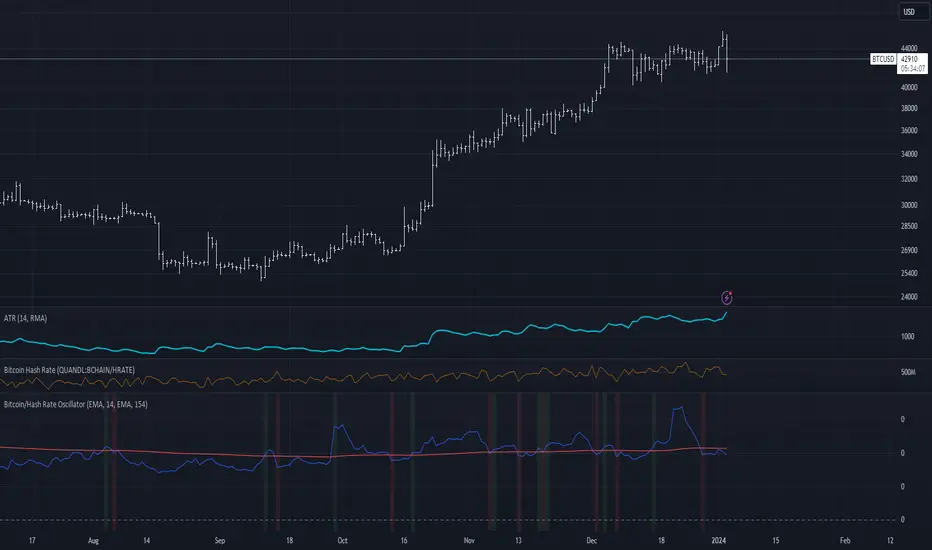
Bitcoin/Hash Rate Oscillator & MAWhat it does:
Finds the ratio of BTC price to the Hash Rate with an additional MA applied to find changes in volatility with relative context. Best used as a two lines cross indicator.
When the ratio of price to hashrate increases, it may be a sign miners cannot or will not sell as much.
When the ratio decreases, it may indicate miners have more capability and/or incentive to sell.
How it works:
The indicator uses a MA applied to the hashrate(first MA input), then finds the difference between it and the actual hash rate. Then it finds the STD of that to create an oscillating value. BTC is divided by said value. Then a second MA is applied to that ratio(second MA input)
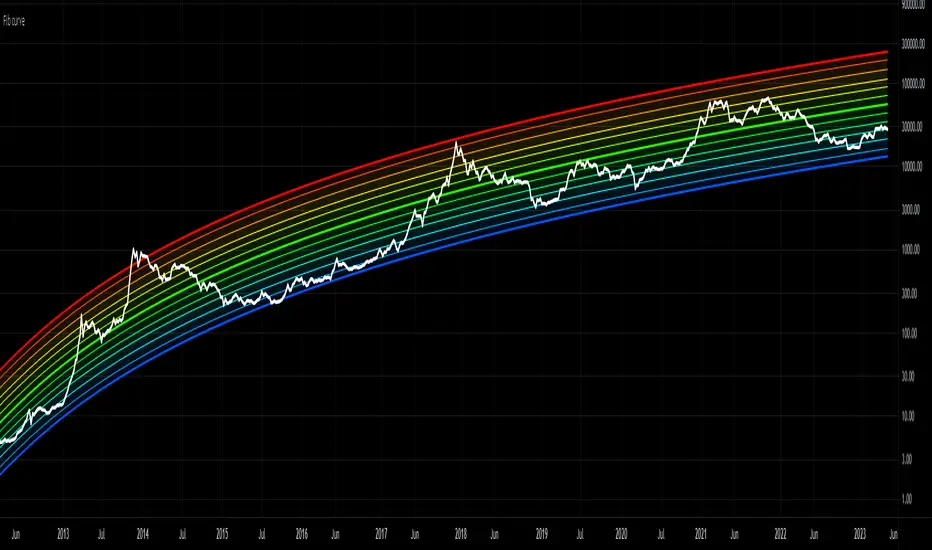
Bitcoin Rainbow Logarithmic CurvesThis indicator shows the logarithmic regression curves for BTC and color codes it based on how extended we are from the best fit line (middle).
Bitcoin Investor Tool: 2-Year MA MultiplierIt is two 2 year length sma's. One sma*5 another just sma.
It is a long term investing tool with Valuation scores in a upper right corner. When price moves from a middle up scores decreas maximum to -1 in a near place to higher sma which usually a top of cycle.
When price moves near to bottom sma score indcreasing to +1 maximum
Visual reprasantation of valuation you can see on a color of sma's. When upper sma become red, means top is close, when bottom sma become green, bottom is close, the same with background.
You can send allert with values.
Example of scores

BitCoin RSI TrendWhat is it?
This indicator will plot the RSI of BTC with a red or green background based on the top and bottom values which you can set.
How to use it?
For example, you want to trade only if the RSI of BTC is between 50 and 70, so the top value is 70 and bottom is 50. If the RSI value between those values the background will be green, else it will be red.
Why to use it?
The buy and sell strength of the BTC controls the other coins, and it is noticeable when the BTC is over sold and the RSI exceeding the 70, the price will reverse its movement to down, thus it is advisable to not open long position if the RSI of BTC is above the 70-75. Also, if the RSI is under 50 there is a big possibility to move down further to the over bought areas. The best is to buy a altcoins when the BTC RSI is between 50 and 70.
For example, I could avoid a bad long trade on MATICUSDT when the RSI of BTC is going under 50
Or, get a good long trade on MATICUSDT when the RSI of BTC is between 50 and 70

Bitcoin CME Gap MonitorDescription
This is an indicator of the gap that occurred in BTC1!
interpretation
Gap increase: Gap increase means that the market price is formed at a higher price than the previous closing price. In this case, the indicator displays the corresponding gap with a dotted blue line and background color.
Gap fall: Gap fall means that the market price is formed at a lower price than the previous closing price. In this case, the indicator displays the gap in black dotted lines and background colors.
These indicators are free for use by anyone without restriction.

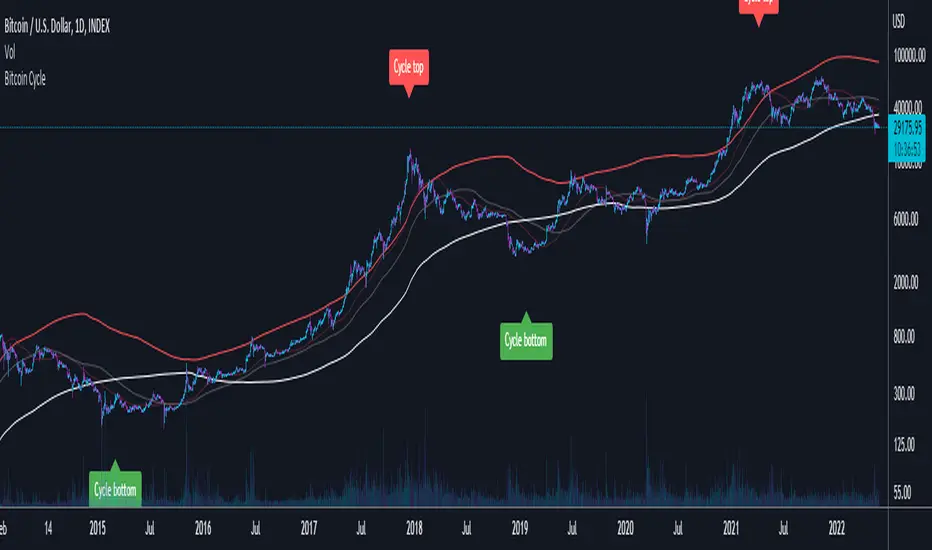
Bitcoin CycleThis script displays 4 different Moving Averages:
2 Year Moving Average (White)
1 Year Moving Average (Doubled in value, Red)
116 Day Moving Average (Transparent, Red)
232 Day Moving Average (Transparent, White)
For the last cycles: once the 2 year MA crossed the 232 Day MA, it marked the cycle bottom within a few days and once the 1 year MA (x2) crossed the 116 Day MA, it marked the cycle top within a few days.
It is interesting to note that both 365/116 and 730/232 equal 3.1465, which is very close to Pi (3.142). It is actually the closest we can get to Pi when dividing 365 by another whole number.