Buy Sell Signal & IchimokuThe script totally based on technical analysis. Indication of "Buy" will appear once the conditions are matched. Please don't follow "Buy" indication if it appear at top of chart.
Yellow candle is a pre-alert for any momentum coming together with increasing of price.
Yellow circle at volume bar is to show that the momentum was there.
Orange line is support & resistance.
Search in scripts for "buy sell"


Buy SellKıvanc hocanın yazdığı 2 stop loss indikatörünün birleşmesi sonucu bulundu. Çalışma mantığını kullandıkça anlayacaksınızıdır.


Buy Sell signal by Spicytrader
Get on board before going to the moon !
Spicytrader instantly identifies when a potential pump or dump is beginning.
Compatible with Autoview bot
GET ACCESS : spicytrader.com


Buy/Sell Ahmed Rashiedtrade with confidence good for both intra day and long term took me 2 yrs to finish it


Triple Confirmation StrategyTriple Confirmation Strategy (TCS)
Ez az indikátor három különböző technikai eszközt kombinál a megbízhatóbb belépési jelek érdekében:
RSI + mozgóátlag keresztezés → momentum konfirmáció
MACD line & signal keresztezés → trendirány jelzés
OBV + EMA keresztezés → volumen alapú megerősítés
Egy jelzés akkor érvényes, ha mindhárom feltétel adott gyertyák számán belül (alapértelmezés: 5) teljesül. Opcionálisan beállítható, hogy csak akkor jelezzen, amikor a harmadik konfirmáció éppen megtörténik.
✨ Funkciók
BUY / SELL jelölés a chartra
Alertcondition támogatás → riasztás azonnal beállítható
Csoportosított beállítások (RSI, MACD, OBV, Logika)
Diagnosztikai overlay (WSCD-stílus): az RSI, MACD és OBV normalizált görbékkel –100…100 skálán vizuálisan is nyomon követhető
🎯 Használat
Alapbeállításokkal intraday és swing kereskedéshez is alkalmas.
A paraméterek szabadon állíthatók (ablakhosszok, gyertyaszám, diag overlay).
A jelek nem önálló kereskedési rendszerként, hanem kontextusban, más elemzésekkel együtt használva a leghatékonyabbak.
Triple Confirmation Strategy (TCS)
This indicator combines three different technical tools to provide more reliable entry signals:
RSI + Moving Average crossover → momentum confirmation
MACD line & signal crossover → trend direction signal
OBV + EMA crossover → volume-based confirmation
A signal is valid only if all three conditions occur within a given number of bars (default: 5). Optionally, it can be set to trigger only when the third confirmation happens at the current bar.
✨ Features
BUY / SELL markers on the chart
Alertcondition support → alerts can be set instantly
Grouped settings (RSI, MACD, OBV, Logic)
Diagnostic overlay (WSCD-style): RSI, MACD, and OBV visualized on a normalized –100…100 scale for easier monitoring
🎯 Usage
Suitable for both intraday and swing trading with default settings.
Parameters are fully customizable (lookback periods, bar window, diagnostic overlay).
Signals should not be used as a standalone trading system but are most effective when combined with broader context and other forms of analysis.

Triple Confirmation StrategyTriple Confirmation Strategy (TCS)
This indicator combines three different technical tools to provide more reliable entry signals:
RSI + Moving Average crossover → momentum confirmation
MACD line & signal crossover → trend direction signal
OBV + EMA crossover → volume-based confirmation
A signal is valid only if all three conditions occur within a given number of bars (default: 5). Optionally, it can be set to trigger only when the third confirmation happens at the current bar.
✨ Features
BUY / SELL markers on the chart
Alertcondition support → alerts can be set instantly
Grouped settings (RSI, MACD, OBV, Logic)
Diagnostic overlay (WSCD-style): RSI, MACD, and OBV visualized on a normalized –100…100 scale for easier monitoring
🎯 Usage
Suitable for both intraday and swing trading with default settings.
Parameters are fully customizable (lookback periods, bar window, diagnostic overlay).
Signals should not be used as a standalone trading system but are most effective when combined with broader context and other forms of analysis.

Volume Comparison with Buyer/Seller PressureTHIS indicator is well-structured and provides a comprehensive way to analyze volume alongside buyer and seller pressure. This indicator helps traders analyze volume dynamics in the stock or cryptocurrency market while simultaneously assessing buyer and seller pressure. Its use case revolves around identifying strong buying or selling activity, neutral conditions, and volume trends over different time periods. Below is a breakdown of how to use this indicator:
This Pine Script indicator helps traders analyze volume dynamics in the stock or cryptocurrency market while simultaneously assessing buyer and seller pressure. Its use case revolves around identifying strong buying or selling activity, neutral conditions, and volume trends over different time periods. Below is a breakdown of how to use this indicator:
Key Features and Use Case
Volume-Based Insights:
Displays daily volume and compares it to the 3-day, 5-day, 10-day, and 20-day moving averages of volume. Helps traders identify days with unusual volume spikes relative to historical averages, signaling potential reversals or breakouts.
Buyer and Seller Pressure:
Measures buyer pressure: how much the closing price dominates the trading range of the day.
Measures seller pressure: how much the opening price dominates the trading range of the day.
Highlights areas where buying or selling pressure is particularly strong (≥ 0.75).
Background Signals:
Green Background: Strong buyer pressure (indicative of potential upward momentum).
Red Background: Strong seller pressure (indicative of potential downward momentum).
Gray Background: Neutral market conditions (neither buying nor selling dominance).
Alerts:
Alerts traders when:
Strong buying signals are detected.
Strong selling signals are detected.
The market is neutral, with neither buyers nor sellers in control.
Decision-Making Aid:
Combines volume analysis with price action (buyer/seller pressure) to help traders identify:
Potential breakout opportunities.
Reversal points.
Neutral zones where a trader might avoid trading due to indecision in the market.
How to Use It in Trading:------->
Add the Indicator:
Apply this Indicator to your Trading View chart to start visualizing the buyer/seller pressure and volume averages.
Interpret Volume Trends:
Look for days when daily volume significantly exceeds the 3-day, 5-day, 10-day, or 20-day average.
These could indicate:
A breakout when aligned with strong buyer pressure.
A sell-off when aligned with strong seller pressure.
React to Background Colors:
* Green Background (Strong Buyer Pressure):
Suggests buyers are dominating the market, and upward momentum is likely.
Use this signal to consider buying opportunities, especially if volume is above average.
* Red Background (Strong Seller Pressure):
Indicates sellers are in control, and prices might fall.
Use this signal to consider selling or shorting opportunities.
* Gray Background (Neutral Market):
Reflects indecision; avoid entering trades during these periods unless other signals support a strategy.
Volume Confirmation:
Combine volume analysis with buyer/seller pressure to confirm trends.
Example: A high daily volume with strong buyer pressure signals a high-probability uptrend.
Set Alerts:
Enable alerts to receive real-time notifications when the market generates strong buy/sell signals or enters a neutral zone.
Who Can Benefit:
* Day Traders: Quickly assess intraday market dynamics and volume trends.
* Swing Traders: Identify breakout opportunities or reversal points based on strong buyer/seller pressure.
* Volume Analysts: Compare historical volume averages to current conditions for deeper insights.
Limitations:
Does not guarantee success—should be combined with other technical indicators or strategies.
In low-volume markets, signals may produce false positives or unreliable results.
Assumes traders have basic knowledge of price action and volume analysis.
By integrating this indicator into your strategy, you gain a powerful tool to analyze buyer/seller dominance alongside volume trends, improving your market timing and trade execution.
The Buyer and Seller Pressure components in this indicator provide crucial insights into the market's sentiment and momentum by analyzing the price action relative to the trading volume. Here's how they are used:
1. Buyer Pressure:
Formula:
Buyer Pressure = (Close − Open) / (High − Low )
Interpretation:
* A high buyer pressure (≥ 0.75) indicates strong bullish sentiment, where the price closes much higher than it opened, and the range (high-low) is sufficiently wide.
* It identifies periods of aggressive buying, often signaling potential bullish trends or confirming upward momentum.
2. Seller Pressure:
Formula:
Seller Pressure = (Close − Open ) / (High -Low )
Interpretation:
*A high seller pressure (≥ 0.75) suggests strong bearish sentiment, where the price closes much lower than it opened, within a wide range.
*It helps identify periods of aggressive selling, signaling potential bearish trends or downward momentum.
Purpose in the Indicator:
1. Market Sentiment Analysis:
* Buyer Pressure and Seller Pressure allow traders to gauge market sentiment—whether buyers or sellers dominate a particular time frame.
* This helps in identifying trend reversals or confirmations.
2. Decision-Making Framework:
* The indicator uses thresholds (default 0.75) to classify the market into:
* Strong Buy Signal: When buyer pressure is dominant.
* Strong Sell Signal: When seller pressure is dominant.
* Neutral Signal: When neither buyer nor seller pressure dominates.
*This classification provides a straightforward decision-making tool for traders.
Risk Management:
*By identifying periods of strong buying or selling, traders can avoid entering trades in highly volatile or one-sided markets, which helps reduce risk.
Volume Confirmation:
*Integrating volume data with buyer/seller pressure helps confirm trends. For example:
*High buyer pressure accompanied by higher-than-average volume strengthens the bullish signal.
*Similarly, high seller pressure with higher-than-average volume confirms bearish signals.
Trade Timing:
*The indicator highlights conditions of potential entry (strong buy) or exit (strong sell), allowing traders to time their trades better based on real-time market activity.
Use Case:
*Example:
*Suppose the indicator shows Buyer Pressure = 0.85 with daily volume above the 3-day average. This combination suggests strong bullish activity with momentum, signaling a buy opportunity.
*Conversely, if Seller Pressure = 0.80 with volume above the 5-day average, it signals strong bearish momentum, ideal for selling or shorting.
This indicator combines buyer/seller pressure with volume dynamics, making it valuable for short-term and intraday traders looking for precise market entries and exits.
The background color in this indicator plays an important visual role in helping traders quickly identify the market sentiment based on buyer and seller pressure. It provides a dynamic, color-coded background that changes depending on the strength of the market's buying or selling activity.
Here's how it works:
Background Color Logic:
1. Green Background (Strong Buy Signal):
*Condition: The background turns green when buyer pressure is greater than or equal to 0.75 (strong buying pressure).
*Interpretation: A green background indicates that there is significant bullish sentiment in the market, with strong buying activity. Traders can interpret this as an environment conducive to buying or holding long positions.
*Visual Effect: This helps to quickly spot bullish market conditions, reinforcing potential entry signals for buyers.
2.Red Background (Strong Sell Signal):
*Condition: The background turns red when seller pressure is greater than or equal to 0.75 (strong selling pressure).
*Interpretation: A red background indicates that the market is dominated by selling, showing strong bearish sentiment. Traders can consider this as a signal to sell or short the asset.
*Visual Effect: The red background highlights moments when the market is heavily selling, prompting traders to either exit long positions or take short positions.
Gray Background (Neutral/Indecision Zone):
Condition: The background turns gray when neither buyer nor seller pressure exceeds 0.75. This means the market is neutral, with no dominant bullish or bearish sentiment.
Interpretation: A gray background suggests market indecision or balance between buyers and sellers. It can indicate periods of consolidation or sideways movement where no strong trend is forming.
Visual Effect: The gray background helps traders avoid entering trades when the market lacks a clear direction or when the sentiment is neutral, reducing risk during indecisive times.
Practical Use:
Instant Visual Confirmation:
*Traders can use the background color as an instant confirmation of the market’s sentiment. For instance, if the background turns green, traders might feel more confident in making a long (buy) trade.
*If the background turns red, it serves as a strong visual cue to short or exit a long position.
Helps with Trade Timing:
*The background color can be used in conjunction with other indicators and volume data to time entries and exits more effectively. For example:
*A green background with strong volume indicates a strong trend that could justify a buy.
*A red background with a significant volume surge signals strong selling pressure, which could prompt a sell.
Simplifies Market Analysis:
*For traders who prefer visual cues over complex analysis, the background color simplifies market conditions. Instead of focusing on individual numbers or values, the color-coded background gives them a quick, intuitive view of the market sentiment.
Summary:
* Green background = Strong buying pressure (bullish sentiment)
* Red background = Strong selling pressure (bearish sentiment)
* Gray background = Neutral market (indecision or balance between buyers and sellers)
This background color functionality helps traders stay aware of the prevailing market sentiment at a glance, providing an intuitive way to guide trading decisions.

Volume Imbalance Analyzer - 70% & 80% Version1.01Here’s a clean “definition” you can drop into your docs. It explains **what** the indicator is, **what it helps with**, and **how** to use it—plain and practical.
# Definition
**Volume Imbalance Analyzer (70% & 80%)** flags bars where estimated buy vs. sell volume is heavily one-sided. It colors those bars, adds labels (B70/B80 or S70/S80), and can alert you in real time. The goal is to quickly spot spots of **aggressive participation** (buyers or sellers) that often act as magnets for a **retest** or as **exhaustion/continuation** areas.
# What it helps you do
* **Find high-energy bars** where one side dominates (potential turning or continuation points).
* **Plan retests:** Track when price comes back into the imbalance candle’s range (common entry/take-profit logic).
* **Filter trades:** Only act when the market shows unusual pressure (≥70% or ≥80%).
* **Add context to setups:** Combine with S/R, FVGs, or trend tools to time entries with less guesswork.
* **Alert-driven workflow:** Get notified the moment extreme pressure prints.
# How it helps (workflow)
1. **Scan for signals:**
* **B80/B70** = strong buying; **S80/S70** = strong selling.
* 80% is “extreme” and overrides 70%.
2. **Mark the zone:** The imbalance candle’s **high–low** defines a zone. Many traders wait for a **retest** into that range.
3. **Decide intent:**
* After **B80/B70**, look for pullbacks to buy (or fades if you see exhaustion).
* After **S80/S70**, look for rallies to sell (or fades if exhaustion).
4. **Confirm with context:** Check trend, key levels, liquidity, session timing, ATR/volatility.
5. **Manage risk:** Place stops beyond the zone; size trades so a failed retest doesn’t ruin the day.
# How it works (under the hood, briefly)
The script **estimates buy/sell volume** from each candle’s body, wicks, and total volume, then computes an **imbalance %**. If the % crosses **70%** or **80%** (scaled by a Sensitivity setting), it paints the bar, drops a label, and optionally fires an alert. It also stores the imbalance candle’s range so you can watch for a **retest**.
# Reading the signals (quick guide)
* **B80**: Extreme buyer pressure → watch for pullback buys or exhaustion shorts, depending on context.
* **B70**: Strong buyer pressure → mild continuation bias.
* **S80**: Extreme seller pressure → watch for rally sells or exhaustion longs.
* **S70**: Strong seller pressure → higher reversal probability noted in the table (informational).
# Configuration tips
* **Sensitivity**: Higher = more bars qualify (more signals).
* **Label distance**: Scales with ATR so labels don’t overlap candles.
* **Colors/opacity**: Separate for 70% vs 80% and buyer vs seller.
* **Alerts**: Enable to catch signals live without staring at the screen.
# Notes & limits
* Uses **estimation** (not true bid/ask) on most symbols; treat as a **context tool**, not a stand-alone system.
* The optional stats table’s “expected outcomes” are **informational**, not live probabilities.
* Works on any timeframe; results improve when combined with structure and risk controls.

IQ_Trader's Technical Scoring System With SignalsThe IQ Trader's Technical Scoring System is a sophisticated trading indicator designed to assist traders in identifying potential BUY and SELL opportunities using a dynamic scoring mechanism.
By combining traditional technical indicators (SMA, MACD) with a custom Adaptive Gaussian Moving Average (AGMA) and Bayesian trend probability analysis, this indicator provides a comprehensive view of market conditions. It generates multiple signal types to support various trading strategies, including main BUY/SELL signals, additional BUYS/SELLS signals, and STOP/STRONG STOP signals for risk management.
Key Features
Dynamic Scoring System:
The indicator calculates separate Buy and Sell scores based on multiple conditions, including:
Price position relative to daily SMA50 and SMA200.
Price position relative to the Adaptive Gaussian Moving Average (AGMA).
Bayesian trend analysis incorporating RSI, MACD, EMA, ATR, and volume zones.
MACD position and crossover/crossunder events.
Scores are displayed in a table, showing the contribution of each component (e.g., "Price > SMA50: 20") for transparency.
Signal Types:
Main BUY/SELL Signals:
Triggered when the Buy/Sell score falls within user-defined dynamic thresholds (adjustable for above/below SMA50 conditions).
Controlled by an inTrade state to prevent overlapping signals (BUY only when not in a trade, SELL only when in a trade).
Disabled by default; enable via settings ("Enable Main BUY Signals" and "Enable Main SELL Signals").
Additional BUYS/SELLS Signals:
Generated when the Buy score exceeds the Sell score (BUYS) or vice versa (SELLS).
Sequentially alternates (BUYS → SELLS → BUYS) to avoid repetitive signals, using an inBuysState mechanism.
Always enabled for quick trend insights.
STOP/STRONG STOP Signals:
STOP: Triggered when the price is above SMA50 and MACD crosses below the signal line in a lower timeframe.
STRONG STOP: Triggered when the price is above SMA50, MACD is below the signal line, and the price is below AGMA in a lower timeframe.
Disabled by default; enable via settings ("Enable STOP Signals" and "Enable STRONG STOP Signals").
Useful for risk management and exiting positions.
Visual and Customization Options:
Plots: Displays daily SMA50, SMA200, AGMA, MACD, and MACD Signal lines, all toggleable via settings.
Score Table: Shows real-time Buy and Sell score components at the top center of the chart.
Signal Markers:
Main BUY: Green label ("BUY") below the bar.
Main SELL: Red label ("SELL") above the bar.
BUYS: Lime triangle up ("BUYS") below the bar.
SELLS: Fuchsia triangle down ("SELLS") above the bar.
STOP: Orange triangle down ("STOP") above the bar.
STRONG STOP: Red triangle down ("STRONG") above the bar.
Settings: Highly customizable thresholds, enable/disable conditions, and plot visibility.
Alert Support:
Configurable alerts for all signal types (Dynamic BUY, Dynamic SELL, BUYS, SELLS, STOP, STRONG STOP).
Alerts are gated by enable settings for main BUY/SELL and STOP/STRONG STOP signals to prevent unwanted notifications.
How to Use
Add the Indicator:
Apply the indicator to your chart via TradingView’s Pine Editor or Indicator Library.
By default, only the additional BUYS/SELLS signals are active, along with SMA50/200, AGMA, and MACD plots.
Customize Settings:
Thresholds: Adjust buyThresholdLow, buyThresholdHigh, etc., to fine-tune the sensitivity of main BUY/SELL signals.
Enable Signals: Check "Enable Main BUY Signals", "Enable Main SELL Signals", "Enable STOP Signals", or "Enable STRONG STOP Signals" to activate these signals.
Toggle Plots: Use "Show Daily SMA50/200", "Show AGMA", and "Show MACD and Signal Line" to control chart visuals.
Score Conditions: Enable/disable individual score components (e.g., "Price Above Daily SMA50") to focus on specific indicators.
Interpret Signals:
Main BUY/SELL: Use for primary entry (BUY) and exit (SELL) decisions, ideal for swing or trend-following strategies.
BUYS/SELLS: Monitor for early trend changes or confirmation of momentum, suitable for shorter-term trades.
STOP/STRONG STOP: Consider as warnings to tighten stops or exit positions, especially in volatile markets.
Check the score table to understand which conditions are driving the signals.
Set Alerts:
Create alerts for desired signals (e.g., "Dynamic BUY Signal") via TradingView’s alert menu.
Ensure the corresponding signal is enabled in settings to receive alerts.
Notes for Traders
Timeframe Flexibility: The indicator adapts to different timeframes, with lower timeframe MACD and AGMA calculations for STOP signals. Test on your preferred timeframe (e.g., 1H, 4H, 1D).
Risk Management: Always combine signals with proper risk management, such as stop-loss orders, as STOP/STRONG STOP signals are not guaranteed exit points.
Backtesting: Before trading, backtest the indicator on historical data to evaluate performance with your strategy.
Customization: Adjust score weights (e.g., scoreSMA50AbovePrice) or Bayesian conditions to align with specific assets or market conditions.
Why This Indicator?
The IQ Trader's Technical Scoring System SS stands out for its blend of traditional and advanced analytics. The Bayesian trend analysis adds a probabilistic layer to decision-making, while the dynamic scoring system ensures signals are context-aware (above/below SMA50). Whether you're a swing trader, day trader, or risk-conscious investor, this indicator offers actionable insights with customizable controls.
Feedback Welcome: Share your experience or suggestions in the comments to help improve this tool for the TradingView community!

TradingIQ - OrderFlow IQIntroducing “OrderFlow IQ”
OrderFlow IQ is an all-in-one order-flow and volume-profiling suite crafted to bring true market microstructure to your TradingView charts. It bundles footprints, per-bar and intra-bar delta analytics, class-based delta tracking, adaptive volume profiles, bubble-style trade tapes, live time-and-sales feeds, cumulative-volume fight meters, iceberg detection, and more—all driven by a single, user-friendly interface.
Features
The list below details an ever=expanding list of the indicators capabilities; more to come in the future!
Tick-based Footprints
Imbalance and stacked imbalance detection
Tick-based chronicled volume profile
Delta classification (small order, medium order, and block order delta)
Tick-based order flow bubble tape
Live order feed with total buying volume against total selling volume
Tick-based CVD
Iceberg order detection
Delta class lines
Tick-based bar statistics
Key Components and Their Functions
Data Granularity
• 1-Tick / 1-Second / 1-Minute modes let you choose the resolution of every calculation. On true tick charts you get genuine tick-by-tick precision; on second charts you see every intra-second print; on anything else it falls back to minute bars.
Footprint Engine
Bid vs Ask Volume Columns – Each candle is sliced into tick-level price rows showing buy-volume, sell-volume, total volume, delta and delta%.
CVD-Level Columns – Optionally color each row by net cumulative delta instead of raw volume to spotlight buying or selling pressure trends.
Imbalance Detection – Highlight rows where one side exceeds your % threshold, with “stacked” imbalances calling out multi-row alignment ahead of potential breaks.
Value Area & POC – Automatically compute and draw the 70% value area (VAH/VAL) and mark the Point of Control per session or any chosen timeframe.
Footprint
The image above shows the volume profiling data calculated for each row across the footprint engine.
Delta: Shows the net difference between buying and selling
Delta Percentage: Calculates delta as a percentage of total volume
Total Volume: The total volume at the price block
Buy Volume: The total buying volume at the price block
Sell Volume: The total selling volume at the price block
Additionally, you can select to only show buying volume and selling volume at each price block, as shown in the image above.
POC
The image above shows the visuals used to mark the POC of the footprint. The POC is marked yellow by default; the color can be changed in the settings.
Value Area
The image above shows the visuals used to mark the value area of the footprint.
Imbalance Detection
The image above shows the Footprint Engine detecting and marking buying/selling imbalances.
Stacked Imbalances
The image above shows the Footprint Engine detecting and marking stacked imbalances. Stacked imbalances are shown as consecutive, small blocks to the right of the footprint.
CVD Levels
The image above shows the footprint engine calculating CVD across the footprint, rather than net delta that resets bar by bar. Traders can enable the "Use CVD Levels" setting to have net delta persist across price bars, allowing traders to see the net CVD across various price blocks as the footprint develops.
Delta Class Statistics
With the inclusion of tick volume, The Delta Class Statistics component of the indicator classifies volume delta by order size to give traders detailed insights into whether small players are buying/selling and whether big players are buying/selling.
The image above shows a full view of the Delta Class Statistics feature.
The image above further explains the Delta Class Statistics view.
Orders are distributed (classified) across various order size amounts. From here, a rolling CVD is calculated across each order size. This feature gives traders detailed insights into whether big money is buying/selling (big player sentiment) and whether small money is buying/selling (small player sentiment).
Analysis
The image above shows a net-negative CVD for the session for both small orders (small money) and big orders (big money), while "medium" sized orders are currently at a net-positive CVD.
Consequently, sentiment for big players is bearish.
Additionally, small triangles are printed alongside each Delta Class box for each bar. You can hover over these labels with your cursor to see the net delta for the bar for each order size.
Bar Delta Statistics
With the inclusion of tick data, OrderFlow IQ is designed to generate detailed tick-based bar statistics for each candlestick.
The image above shows the feature in action.
Metrics
Volume: Total volume for the bar
Bar VWAP: The individual bar's VWAP
Delta: Net delta for the bar
Delta %: Delta % of the bar
Max Delta: The maximum positive delta achieved during the bar
Min Delta: The lowest negative delta achieved during the bar
CVD: Cumulative volume delta measurement by the bar
Buy Volume: Total buying volume for the bar
Sell Volume: Total selling volume for the bar
Iceberg Detection (Tick-Data Only)
An Iceberg Order is a type of large trading order that is broken up into much smaller visible portions. Only a small part of the order is displayed in the public order book at any given time, while the rest is hidden (like an iceberg where only the tip is above water).
Why are Iceberg Orders Important?
Minimizing Market Impact
If a trader were to post a 10,000-share sell order openly, the market would immediately react:
Buyers might panic, thinking there's a rush to sell.
Sellers could undercut the price aggressively.
This would likely drive the price down before the large order even finishes executing.
By revealing only a small portion at a time, Iceberg orders help avoid spooking the market and allow the trader to sell closer to the original price.
Hiding Trading Intentions
Markets are highly sensitive to order flow — the balance of buying and selling pressure.
If competitors, market makers, or algorithmic traders see a massive order, they might:
Front-run it (selling before it completes to profit from the expected price drop).
Reassess their own models about supply/demand imbalances.
Iceberg orders protect against this by masking true supply or demand.
Our Iceberg Detection Model
Using a proprietary iceberg order detection algorithm, OrderFlow IQ is capable of detecting/alerting iceberg orders when they occur.
The image above shows the Iceberg Detector in action.
When an iceberg order is identified, the size of the order in the quote currency, price of execution, and number of executions will be displayed.
It's important to set alerts for this feature, as iceberg orders aren't frequent and are easy to miss when away from the chart.
IQ Volume Profile (Chronicled Volume Profile)
OrderFlow IQ generates a Chronicled Volume Profile to give traders detailed insights into net delta by price level, but also historical net delta by price level.
The image above shows the feature in action. While the chronicled volume profile is seemingly a normal volume profile, the narrow-lines across the chronicle profile show historical min/max delta at each price level.
The image above exemplifies the feature.
The wide price blocks show the current net delta at each price area, while the small lines (with a circle at the end) show historical min/max delta at the price level.
This tool allows traders to see if buying/selling always dominated a price level, or if control of the price level changed hands between buyers/sellers throughout development of the profile.
Additionally, traders can hover over the small circles on the profile with their cursor to see the detailed delta statistics at each price area. The statistics will show the minimum delta at the price area, maximum delta, and the live change in delta.
Order Feed
OrderFlow IQ is capable of generating a live order feed with various metrics to assist real time orderflow traders in their analysis.
The image above exemplifies the feature.
Bid/Ask: The bid price and ask price of the current bar
Buys | Price: The size of a buy order and price of execution
Sells | Price: The size of a sell order and price of execution
▴ Vol: Cumulative buying volume (in quote currency) for the feed
▾ Vol: Cumulative selling volume (in quote currency) for the feed
Speed of tape: The average speed between each order fill
OrderFlow Bubble Tape
OrderFlow IQ also displays a traditional orderflow indicator, also known as OrderFlow Bubble Tape.
The image above shows the feature in action.
Orderflow Bubble Tape is a visual tool that shows recent market trades ("tape") as bubbles, where each bubble represents a trade.
The size of each bubble indicates the trade size (volume), and the color shows whether the trade was a buy (aggressive at the ask) or sell (aggressive at the bid).
Instead of showing trades as plain text (like a traditional tape), the bubble format makes it easier to spot bursts of aggressive buying or selling visually.
Clusters of large, fast bubbles in one color suggest momentum or imbalances in order flow, often signaling short-term price pressure.
Traders use Bubble Tape to quickly read supply/demand dynamics, identify hidden buyers/sellers (like iceberg orders), and anticipate short-term price moves.
Blue Bubble = Buy
Red Bubble = Sell
The larger the bubble, the larger the order. Traders can hover over each bubble with their cursor to see the exact size of the order.
Delta Class Lines
OrderFlow IQ shows Live Delta Class Lines grouped by order size buckets:
The blue line shows delta coming only from very large orders (100K–10B in size).
The red line shows delta coming from medium-large orders (50K–100K size).
The green line shows delta from small to medium orders (0–50K size).
Each line is the cumulative net delta for its class — meaning it is adding the buy and sell imbalances only from trades of that size class, live as trades occur.
For example, when a 30K-sized aggressive buy hits, it adds to the green line; if a 70K-sized sell hits, it subtracts from the red line.
The number next to each label is the current net delta value for that class, telling you whether buyers or sellers are dominating at that order size.
• Three Custom Dollar Brackets – Define “small,” “mid,” and “block” trade-size ranges (e.g., 0–50 K, 50 K–100 K, > 100 K).
• Live Streaming Lines – While a bar is forming, watch real-time totals for each bracket plotted as vertical columns or stair-step lines on the chart edge.
CVD
OrderFlow IQ also displays CVD as either candles or a line.
The image above shows the candles visualization for CVD. CVD can be calculated using tick data, 1-second bars, or 1-minute bars. The higher the granularity the more accurate the measurement.
More Features To Come
New features and calculations will be added to OrderFlow IQ based on community feedback, so feel free to share any requests you might have!
Summary
OrderFlow IQ brings a full suite of order-flow analytics into one Pine Script: footprints, delta analytics, dollar-bracket classes, adaptive profiles, bubble tapes, live feeds, CVD meters, and iceberg scans. Its unified Data Granularity switch and Preset System let you toggle entire dashboards with a click—scalpers, intraday traders, and long-term analysts alike can dial in the exact microstructure view they need without switching scripts. Publish once, share your preset layouts, and your TradingView community gains plug-and-play access to professional-grade order-flow tools—no extra installations or feeds required.

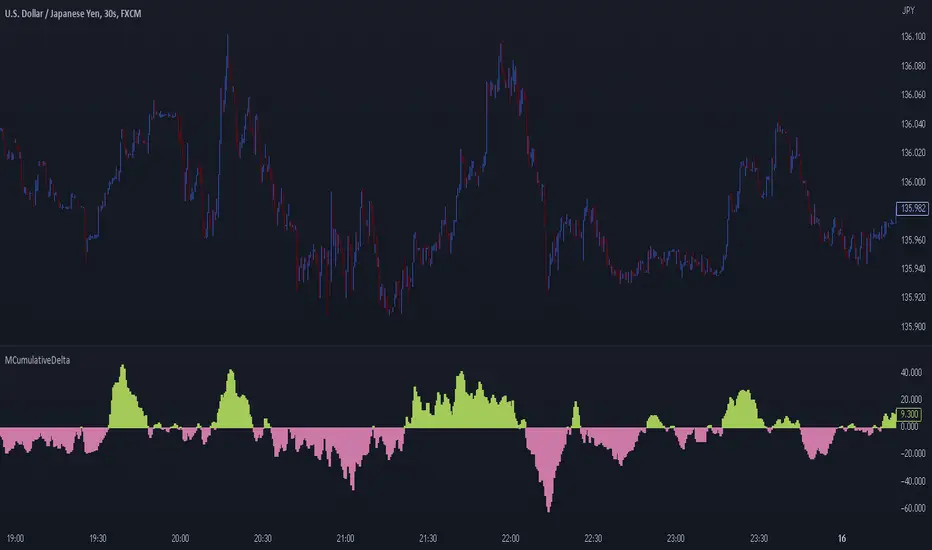
MCumulativeDelta* MCumulativeDelta Indicator *
The MCumulativeDelta Indicator shows the Buying / Selling pressure that is happening in the market. The Delta is powered by the *MBox Precision Delta* Algorithm. This indicator serves to show overall Accumulation and Distribution of the BUYERS and the SELLERS. It becomes possible to gauge if the market is overall Bullish or Bearish. This helps determine trade direction and keeping out of other trades that are counter to what the overall Buying / Selling is showing.
* WHAT THE SCRIPT DOES *
The script draws a histogram that can either be positive or negative. When the histogram is positive it means there are more Buyers in the Market. When the histogram is negative it means there are more sellers in the market. The more positive the histogram gets, the more BUYERS are flooding the market. The more negative the histogram gets, the more SELLERS are flooding the market. When the histogram switches over from negative to positive it is a Bullish sign of Buying. When the histogram switches over from positive to negative, it is a Bearish sign of Selling.
* HOW TO USE IT *
As the histogram becomes more negative, this shows that the SELLERS have taken control of the markets. Conversely, as the histogram becomes more positive, this shows that the Buyers have taken control of the markets. The side that is in control is the direction to generally place trades in, and at the same time filter out trades of the opposite direction.
* HOW IT WORKS *
The MCumulativeDelta histogram on the chart represents overall Buying / Selling. This is the DELTA (difference) between the BUYING and the SELLING. Taking the total BUYING and subtracting the total of SELLING, we produce the DELTA (difference) between the Buying / Selling and this is what is drawn by the histogram.
Unlike other Cumulative Delta indicators which determine delta from the Up / Down wick and just multiply by volume (not a true delta), the MCumulativeDelta indicator uses a sophisticated algorithm that analyzes price movement corresponding to volume movement.
The way the DELTA, BUYING, and SELLING is calculated is computed by the *MBox Precision Delta* Algorithm. The algorithm considers the following data points when making it's computation
1. Price moving up on increasing volume
2. Price moving up on decreasing volume
3. Price moving horizontally on increasing volume
4. Price moving horizontally on decreasing volume
5. Price moving down on increasing volume
6. Price moving down on decreasing volume
Using these data points allows MCumulativeDelta to effectively compute and define the following scenarios
1. Accumulation / Distribution
2. Buying / Selling Exhaustion
3. Buying / Selling EFFORT / NO RESULT
Once the scenario is determined, it will greatly aid in trade decision making. These scenarios are explained in the examples below
* EXAMPLE AND USE CASES *
- Accumulation Example -
When you see a large amount of BUYING (large positive histogram) and price entering an up trend, this is indicative of Accumulation and you would be looking for PULLBACKS to get into the up trend move.
- Distribution Example -
When you see a large amount of SELLING (large negative histogram) and price entering a down trend, this is indicative of Distribution and you would be looking for pullbacks to get into the down trend move.
- Buying EXHAUSTION Divergence -
As price makes higher highs, but the MCumulativeDelta histogram drops (becomes less positive) on the higher highs, it means BUYERS are exhausted. Potentially a reversal or change in behavior in the markets.
- Selling EXHAUSTION Divergence -
As price makes lower lows, but the MCumulativeDelta histogram contracts (becomes less negative) on the lower lows, it means SELLERS are exhausted. Potentially a reversal or change in behavior in the markets.
- BUYING EFFORT / NO RESULT -
As the MCumulativeDelta histogram increases positively, but price fails to make higher highs, it is a sign of EFFORT / NO RESULT on behalf of the Buyers. In this case Buyers are pushing hard to move price up, but are unable to, due to being OVERBOUGHT. If this is accompanied by visible SELLING, it would be a good short entry.
- SELLING EFFORT / NO RESULT -
As the MCumulativeDelta histogram increases negatively, but price fails to make lower lows, it is a sign of EFFORT / NO RESULT on behalf of the Sellers. In this case Sellers are pushing hard to move price down, but are unable to, due to being OVERSOLD. If this is accompanied by visible BUYING, it would be a good long entry.
* SETTING ALERTS *
- FOR CROSSING FROM BUYING TO SELLING OR SELLING TO BUYING -
To be alerted when the histogram crosses over from Buying to Selling (Positive to Negative) or Selling to Buying (Negative to Positive)
1. Right Click Chart -> Add Alert...
2. Select Condition to be "MCumulativeDelta"
3. Select "Crossing" with Value = 0
4. Options set "Once Per Bar Close"
5. Customize Any other Alert Options you want
* AUTHOR *
This script is published by MBoxWave LLC
Smart Pro Entry Guideज्यादातर नए और मिड-लेवल ट्रेडर indicator की भीड़ में या जल्दीबाज़ी में ग़लत entry/exit पर फँस जाते हैं, जिससे बार-बार loss होता है या सही trade छूट जाता है।
Smart Pro Entry Guide इसी असली समस्या का सीधा हल है:
यह indicator price action, candle analysis, volume और trend momentum – सबका adaptive combination लगाकर हर स्थिति में साफ शब्दों में (BUY/SELL/WAIT) real-time signal देता है। इसकी सबसे खास बात – higher और current timeframe की sync analysis और auto-adaptive logic, जिससे beginners/experienced – सभी traders किसी भी market structure में बिना confusion सही entry, support/resistance, liquidity और trend direction एक दम साफ देख सकते हैं।
Key Concept & Benefits
No Indicator Clutter: सिर्फ one-glance signals, सारे signals और levels auto-update ताकि screen पर कभी overload ना हो।
Exact Entry Guide: कब सही entry है – system खुद strongest action filter करता है, जिससे FOMO और whipsaw entry से बचा जा सके।
HTF+LTF Logic: Multitimeframe sync analysis – हर market mood (bullish, bearish, sideways) को पकड़े और जल्द signal ना बदले।
Auto S/R & Liquidity Zones: Important support/resistance और liquidity levels auto-plot, जिससे price action traders को ready reference मिले।
Clear Action/Direction: हर बार realtime table/dashboard में plain words में “market क्या चाहता है” दिखे – चाहे bull trap हो, sudden volume spike, wick reversal या trend exhaustion.
For Everyone: Trader चाहे newbie हो या pro – सिर्फ chart add करें और real market psychology का live simplified signal instantly पायें।
Ideal Usage
Instant decision support: जब भी confused हों entry/exit को लेकर – इस indicator की सिफारिश चेक करें।
Entry learning: Beginners को best real-time practice playground – हर entry/exit reason भी दिखता है।
Screen time & Stress कम: Chart पर clear, relevant info – no noise, no extra marks!
Smart Entry Guide – Pro Dashboard HTF/Action Split ट्रेडिंग को आसान, साफ और आत्मविश्वासी बनाता है – ताकि आप market signal miss ना करें, जल्दीबाज़ी में trap ना हों और हर बड़े move का सही हिस्सा बन सकें।
Input Setting:
Enable Wick Analysis (useWickAnalysis)
क्या है?
यह एक बूलियन (true/false) सेटिंग है जिससे यूज़र यह decide कर सकता है कि indicator में "wick analysis" को एक्टिव करना है या नहीं.
क्यों है?
"Wick analysis" ट्रेडिंग में कैंडलस्टिक के shadows (wick/tail) को analyze करता है — यानी किसी भी कैंडल का जो हिस्सा खुलने/बंद होने के दाम से उपर या नीचे जाता है, लेकिन वहीं टिकता नहीं।
यह analysis दर्शाता है कि प्राइस पर seller या buyer ने strength दिखाई, पर वो momentum टिक नहीं पाया— यानी rejection या sudden buying/selling pressure।
Intent (भावना/लक्ष्य)
मार्केट की psychology को और गहराई से पकड़ना।
Beginner को live chart पर वही logic समझाना जो manual price action expert traders ढूंढ़ते हैं।
False signals/whipsaws को avoid करना, खासकर wicks के कारण आने वाले traps से बचाव करना।
User के लिए फायदा
जब यह ON रहेगा, तो indicator extra alert देगा — अगर बहुत बड़ी wick बनी है (जैसे big lower wick यानी नीचे से strong buying या big upper wick यानी strong selling), तो signal जल्दी और सही मिलेगा।
इससे ट्रेडर को पता चलेगा कि market एक तरफ rejection दिखा चुका है — जिससे खास entry/exit का decision और strong हो जाता है।
FOMO या panic में गलती से entry/exit लेने से बचाव, क्यूंकि wick पहचानना often pro trader का काम था — indicator उसे भी automatically दिखा देता है।
Real market reversal या fake breakout points को early पहचानने में मदद।
संक्षेप में:
Enable Wick Analysis चालू करने पर indicator manual pro price action reading जैसा एक smart filter जोड़ लेता है — जिससे signals ज़्यादा powerful, और market के traps से बचने में मदद मिलती है।
Enable Absorption (useAbsorption)
क्या है?
यह एक बूल विकल्प (On/Off) है। जब आप इसे true/active करते हैं, तो indicator "absorption candle" का logic अपने analysis में शामिल करता है।
क्यों है?
Absorption trading में एक ऐसी स्थिति को दर्शाता है जहाँ एक तरफ से ज़बरदस्त buying या selling pressure आता है—लेकिन उसके सामने दूसरी ओर से equally strong order flow आकर move को absorb (निगल) लेता है, जिससे price को रोक दिया जाता है। यह market में hidden strength का संकेत होता है—जैसे कोई चलती ट्रेन अचानक दीवार से टकरा जाती है!
Indicator में absorption analysis यह पकड़ता है कि volume अचानक high है, और price एकदम lowest या highest point पर बंद हो गया, पर price बड़ा move नहीं कर पाया—यानी buyers या sellers का दबाव absorb हो गया।
Intent
Pro level price/volume dynamics को automatically पढ़ना, जिससे major reversals या breakout fakeouts का पता लगाया जा सके।
Beginners के लिए complicated manual candle/volume analysis को आसान बनाना।
Market में छुपी हुई liquidity और institutional order zones को पहचानना—जहाँ real move start हो सकता है।
User को क्या फायदा?
On करने पर जब भी absorption signal मिलेगा, indicator entry/exit या directional alert को और मजबूत बना देगा।
Reversal या fake breakout/trap के पहले ही user को advanced warning मिल सकती है—जो अक्सर सिर्फ बड़े price action expert charts से ही पकड़ते हैं।
Beginners के लिए "hidden" market action को सामने लायेगा—panic या FOMO entry से बचाव और patience बढ़ेगा।
खासकर volatile या news-driven market में जहाँ sudden wicks और volume spike निकलते हैं, वहाँ यह बहुत काबिल feature है।
संक्षेप में:
Enable Absorption ON रखने पर indicator market के छुपे हुए pressure zones को automatically detect करता है—traders को entry/reversal/exit points पर pro-level confidence देता है, जिससे major loss या फालतू entries से बचा जा सकता है।
Enable Unusual Breakout (useUnusualBreakout)
क्या है?
यह एक ON/OFF विकल्प है (बूल वैल्यू)। इसे सक्रिय करने पर indicator unusual breakout की प्रबल पहचान करता है — यानी जब candle का बॉडी औसत से बहुत बड़ा और वॉल्यूम ज़्यादा होता है।
क्यों है?
मार्केट में कभी-कभी अचानक बड़े मूव (breakout/breakdown) आते हैं — जिनमें volume भी साथ में surge करता है।
ऐसे unusual moves beginners अक्सर miss कर देते हैं, या उलटी साइड में फँस जाते हैं, क्योंकि वो normal range से बाहर signal होते हैं।
Intent
Sharp momentum और real breakout moves को identify करना।
Beginners को uncommon market situations में, पहले से alert करना, ताकि genuine move miss न हो और trap में भी न फँसे।
Volatility ke time पर traders को confidence और clarity मिल सके।
User फायदा कैसे ले सकता है?
ON रखने पर indicator जैसे ही unusual breakout detect करेगा (big candle + high volume), signal के साथ reason में दिखा देगा।
Scalping/trend ट्रेड या volatile मार्केट में, extraordinary moves को जल्दी पकड़ पाएँगे।
Entry miss या फालतू whipsaw moves में फँसने से बच सकते हैं, क्योंकि indicator unusual move को plain शब्दों में highlight करेगा।
High-probability moves में तेजी से action लेने का मौका मिलेगा।
संक्षेप में:
Unusual Breakout ON रखने पर indicator हर uncommonly strong move को समय पर पकड़ लेता है — जिससे users big and real market move miss नहीं करते और risky sudden traps से बचते हैं!
Enable Range/Expansion (useRangeExpansion)
क्या है?
यह एक boolean setting है (On/Off)। इसे ON करने पर indicator "Range Expansion" logic को activate करता है — यानी जब market में suddenly price range बढ़ जाती है, तब उसको खास तौर पर analyze करता है।
क्यों है?
"Range/Expansion" का मतलब है — जब किसी भी candle या bar का high-low suddenly पिछले average range के मुकाबले बहुत ज्यादा बड़ा/छोटा हो जाए।
यह अक्सर अचानक volatility, नए trend की शुरुआत, या powerful breakouts/breakdowns के वक्त होता है — यानी market stationary/restricted से एकदम dynamic/high-volatility mode में आ गई।
Beginners ये movement कई बार miss कर देते हैं या old range में फँसकर false entry ले लेते हैं।
Intent
Trend shift, volatility burst और range breakout जैसी critical movements को exact time पर पकड़ना।
User को warn करना कि market एक नए phase में आ चुकी है — अब entry/exit approach को accordingly adjust करना चाहिए।
Entry का best time signal करना, जब suddenly real move शुरू हो गया हो।
User को क्या फायदा?
ON करने पर जैसे ही market में unusual range expansion दिखाई देगी, indicator alert कर देगा — जिससे no-trade phase से out-of-box move को catch करना आसान हो जाएगा।
इसमें पुराने (previous) small ranges और sudden large candle के difference को detect किया जाता है — जिससे user sideways/confused market में trap होने से बच सकता है।
Best entry का timing improve करेगा — अगर expansion bullish/positive हो तो BUY या bearish/negative हो तो SELL quickly identify हो जाएगा।
Big trend moves miss नहीं होंगे, क्योंकि system खुद नए phase को instantly पकड़ लेगा।
संक्षेप में:
Enable Range/Expansion ON करने से indicator sudden trend shifts, breakout/breakdown या big volatility phase को तुरंत पकड़ता है — जिससे user entry/exit का फायदे-मंद decision ले सकते हैं, moving/range bound market trap से बच सकते हैं, और trend phase को miss नहीं करते!
Trend Bar Lookback (Rolling) (trendBarCount)
क्या है?
यह एक integer/numeric input है, जिससे आप set करते हैं कि indicator पिछले कितने candles/bars का data लेकर trend की direction और strength calculate (roll करता है) करे।
जैसे: अगर इसका मान 7 है, तो पिछले 7 candles की price movement देखकर trend का हिसाब करेगा।
क्यों है?
हर market/trader का style और time-frame अलग होता है;
Short lookback = तेज़ी से बदलने वाला, ज्यादा sensitive signal → scalping/small moves के लिए।
Long lookback = बड़ा data, ज़्यादा stable trend, कम whipsaw → swing/position trading के लिए।
Indicator को flexible बनाने के लिए यह option रखा गया, ताकि user अपने हिसाब से momentum/trend detection को adjust कर पाए।
Intent
User को control देना कि trend detection में कितना past data consider करना है।
Beginners और pros दोनों को flexibility देना — कोई ultra-fast trend देखना चाहे तो small value रखे, कोई safe/stable trend के लिए बड़ी value रख सकता है।
हर symbol/market के हिसाब से customization—volatile stocks में कम या ज़्यादा lookback set कर सकते हैं।
User के लिए फायदा
अपनी strategy, time-frame, और market के behaviour के हिसाब से best trend sensitivity set कर पायेंगे।
Short-term traders quick entries पकड़ सकते हैं; long-term traders noise से बच सकते हैं।
Indicator false signals या whipsaw से बचाने के लिए τtrendBarCount को adjust कर decision clarity पा सकता है।
Multi-timeframe analysis और system tuning ultra easy बन जाता है—user खुद देख सकता है कि कौन सा setting उसके लिए सबसे अच्छा result दे रहा है।
संक्षेप में:
Trend Bar Lookback user को ये control देता है कि trend/momentum calculation कितना “fast” या “slow” हो, जिससे वे अपनी style के हिसाब से indicator को बिलकुल fit बना सकते हैं—यह ट्रेडिंग में एक बहुत बड़ा practical edge देता है!
Bull/Bear Bars for Strong Trend Min (trendScoreMin)
क्या है?
यह setting यह define करती है कि पिछले lookback window (जैसे—Trend Bar Lookback) के अंदर लगातार कितनी bullish (green) या bearish (red) candles minimum चाहिए, ताकि indicator उसे "strong trend" मानकर BUY या SELL signal दे सके।
उदाहरण: अगर इसे 5 set किया है, तो पिछले lookback (माने 7) में कम-से-कम 5 बारें लगातार bullish हों—तभी उसे strong uptrend और vice versa के लिए strong downtrend trigger माना जाएगा।
क्यों है?
बहुत सारे indicators या strategies market में छोटे-छोटे या random price moves में भी trend detect कर लेते हैं, जिससे beginners बार-बार छोटे या झूठे (false) signal पर फंस जाते हैं।
trendScoreMin रखने का logic ही यह है कि सिर्फ तभी entry मिले, जब वहाँ सच्चा momentum, यानी majority candles एक direction में हों—ताकि weak trend, sideways, या whipsaw moves से user बचे।
Intent (मूल भावना)
Signal quality improve करना—सिर्फ “high probability” entries व strong momentum trade मिले।
Market noise और बार-बार signal flip या reversal के chance कम करना।
Beginner/trader discipline रखना—बार-बार entry/exit करके trap होने से रोकना।
User फ़ायदा (User कैसे लाभ उठा सकता है?)
अगर user aggressive है और ज्यादा fast signal चाहिए, तो इस value को कम रखे (जैसे 3-4)—उससे short trend/flips भी मिल जाएंगे।
अगर user को only strong/full-body trends चाहिए, loss से डर है या ज्यादा noise नहीं चाहिए, तो value ज्यादा रखें (6-7)—तभी signal आएगा जब market strongly एक तरफ जा रहा हो।
खासकर beginners जल्दी signal के चक्कर में fake moves पकड़ लेते हैं—यह setting उन्हें patience सिखाएगी और परेशान market moves में unwanted trades से रोकेगी।
Pro trader इसको नए-नए symbol या market reality के हिसाब से tweak कर सकते हैं—जैसे volatile crypto में कम, stable stock में ज्यादा।
Example Practical Use:
Suppose आपने lookback 7 रखा है और trendScoreMin 5, तो पिछले 7 candles में कम से कम 5 green पूरे हों तो ही BUY trigger बनेगा—वरना WAIT ही दिखेगा।
यह logic practically हर time frame, हर market, हर user type के लिए risk control और entry select करने को super easy और disciplined बना देता है।
Volume MA Length (length)
क्या है?
यह setting user से पूछती है कि वॉल्यूम का “moving average” कितने पिछले bars/candles के ऊपर लें।
माने, यह वह अवधि है जिसके आधार पर indicator वॉल्यूम का औसत निकालता है। Default value अक्सर 20 होती है, यानी पिछली 20 candles के volume का average लिया जाता है।
क्यों है?
Market में हर candle का वॉल्यूम अलग होता है—कभी ऊपर, कभी नीचे।
जब sudden volume spike/decline आता है तो वही असली move, trap या breakout का clue होता है।
Normal volume कितनी है ये पता रहे, ताकि unusual वॉल्यूम तुरंत पकड़ में आए।
Intent (लक्ष्य/भावना)
Beginner/pro दोनों trader को अपने हिसाब से volume behavior analyze करने देना।
हर symbol, market type, time frame आदि के लिए अपने हिसाब से logical वॉल्यूम spike/filter tuning देना।
Noise, trap या fake volume moves से alert रखना।
User फ़ायदा (कैसे use करे/benefit)
Short-term/small move के लिए: (e.g., Scalping, fast intraday) – कम value रखें जैसे 10–15। इससे fast volume change जल्दी पकड़ जायेगा।
Long-term/big move के लिए: (e.g., Swing, positional) – बड़ी value रखें जैसे 30–50। Stable average बनेगा, सिर्फ असली strong moves दिखेंगे।
Practical Entry/Exit: Unusual volume candle पर indicator quickly alert करेगा—FOMO, panic या silent entry से user बचेगा।
Beginner कोई भी market (Forex, stock, crypto) इस्तेमाल कर रहा हो, इस length के हिसाब से volume analysis best fit बना सकता है।
अगर volume ज्यादातर flat है, तो MA length बढ़ा लें। अगर हमेशा high change रहता है, तो कम कर सकते हैं।
Example:
अगर length 20 रखा और अगले candle का volume, पिछले 20 का average से 2x हो गया—system उसे impactful move मानेगा और यूजर को real breakout या absorption candle instant बता देगा।
यह setting छोटी है लेकिन trading में “volume traps” और “real participation” को पकड़ने के लिए बहुत काम की है। सही value experiment करके user अपनी strategy के लिए best sweet spot खुद खोज सकता है!
Swing Lookback Bars (swing_look)
क्या है?
यह setting बताती है कि indicator ब्रेकआउट/रिवर्सल या swing को पकड़ने के लिए कितनी पिछली candles (bars) का डेटा देखे।
Simple रूप में, जब system swing high/low (local top/bottom) calculate करता है, तो वह पीछे कितनी bars देखे — यह user decide करता है।
Default value 15 होती है, यानी पिछली 15 candles में सबसे ज़्यादा हाई या सबसे कम low को swing point माना जाएगा।
क्यों है?
हर मार्केट और हर trader का swing/reversal पढ़ने का तरीका अलग होता है — किसी को छोटी moves (scalping/small breakout) पकड़नी है, किसी को big swings (trend shift) चाहिए।
अगर छोटी value रखेंगे तो system जल्दी-जल्दी swings दिखाएगा; बड़ी value से सिर्फ major, मजबूत reversal points दिखेंगे।
Intent (लक्ष्य/भावना)
User को flexibility देना, ताकि वह chart structure अपनी strategy के हिसाब से देख सके।
Pro-level market structure analysis (higher highs/lows, lower lows/highs) को simplify करना।
Beginners को real swing/reversal या trend continuation signal में clarity देना, bar-बार changing signals से बचाना।
User फ़ायदा (कैसे use करें/benefit)
Short-term/Scalping के लिए: small value (जैसे 8-10)—quick swing points, fast choppy market में best है।
Swing/Positional Trading के लिए: larger value (15-30)—major reversal या only big breakouts/breakdowns दिखेंगे, noise कम, reliability ज्यादा।
Entry/exit timing ultra accurate हो जाती है — क्योंकि वही bars (swings) true reversal बन पाते हैं जिनके पीछे enough candles का context होता है।
Beginners भी chart पर local high/low, support/resistance आसानी से identify कर पाते हैं, manual drawing की ज़रूरत नहीं।
Trend-followers छोटे swing के trap से बच सकते हैं; reversal traders major profit capturing कर सकते हैं।
Example:
अगर swing_look = 15, तो indicator हर point पर पिछले 15 bars में highest high और lowest low देखेगा — अगर कोई बार इन values से ज़्यादा/कम है, तो swing high/low बन जाएगा।
इससे आप अपनी strategy को perfectly match करते हुए, strong और weak swings को filter कर सकते हैं—high probability trading, कम confusion, और confident setup!
HTF (Bias Window) (window_tf)
क्या है?
HTF (Higher Time Frame) Bias Window वह setting है जिससे आप यह decide करते हैं कि indicator multisystem logic में कौन सा higher time frame (जैसे—15min, 1H, 4H, 1D आदि) market bias/मूड पढ़ने के लिए इस्तमाल करे।
इसमें time-frame (window) select होता है जिस पर overall market trend, bias, liquidity और reversal zones का हिसाब लगाया जाता है।
क्यों है?
ज़्यादातर beginners या हाल ही के traders सिर्फ current/candle time-frame देखते हैं — जिससे बार-बार छोटे या fake signals आ जाते हैं।
लेकिन real market direction, big moves और trend reversals अक्सर bigger time frame (HTF) से ही decide होते हैं।
HTF bias window रखने का मकसद यह है कि entry/exit decisions हमेशा बड़े context के हिसाब से हों—market की asliyat कभी भी small time-frame में miss न हो!
Intent (मूल भावना)
User को multitimeframe trading की advanced power देना—बिना extra charts के।
हर trade से पहले bigger bias पता रहे—market bullish है, sideways है या bearish है, वो instantly clear हो।
Beginners को frustration, false breakout और whipsaw trap से बचाना—क्योंकि current TF का move अगर HTF के खिलाफ है तो trap होने के chances बहुत ज्यादा हैं।
User फ़ायदा (कैसे benefit लें?)
Scalping/trading में:
Quick trades के लिए छोटी HTF window (जैसे 15-30min) चुनें।
Swing/position trading में:
बड़ी window (1H, 4H, 1D) रखें—overall trend, major reversal & support/resistance zones का सही अंदाजा मिलेगा।
Beginner हो या Pro—HTF bias window के हिसाब से entry लें तो “trend के खिलाफ trade” ना के बराबर होंगे, result consistency बढ़ जाएगी।
HTF हमेशा direction/major move के पीछे की असली ताकत दिखाता है—choppy, sideways या reversal market में perfect filter की तरह काम करता है।
Example Practical Use:
Suppose आपने chart 5min का open किया है, पर HTF bias window 1H set किया—तो हर 5min move की असली दिशा hourly trend बताएगा, जिससे सिर्फ strong, genuine trend पर ही entry मिलेगी।
सारांश:
HTF Bias Window ऐसी setting है जो हर user को beginner से pro तक, market के बड़े structure के हिसाब से decision लेने की ताकत देती है—winning ratio और discipline दोनों full boost हो जाते हैं!
Adaptive Lookback (HTF) (lookback_sup)
क्या है?
Adaptive Lookback (HTF) वो setting है जिसमें user यह तय करता है कि higher time frame (HTF) analysis में सुपर इम्पॉर्टेंट data points—जैसे highest volume, biggest candle body, swing points आदि—calculate करने के लिए कितनी पिछली HTF candles को consider करना चाहिए।
यानी HTF में latest कितनी bars देखनी हैं ताकि extreme/high impact moves, zones, और levels का पता चले।
क्यों है?
बड़े moves या reversal अक्सर पिछले लंबे data history में बनती है — इसलिए adaptive lookback जरूरी है।
Short lookback से फटाफट बदलने वाले (quick, responsive) zones मिलेंगे; long lookback से ultra-reliable, rarely changing, big zones मिलेंगे।
हर symbol, strategy और time-frame के हिसाब से right lookback set करना ultra-important है — beginner के लिए भी और pro के लिए भी।
Intent (भावना/logic)
Market के real key levels, HTF trend strength और liquidity का असली context provide करना।
Trend exhaustion, real support/resistance shift, big volume pockets — सब detect हों, इसलिए adaptive tuning option देना।
Beginner को सिर्फ current देखने की गलती से बचाना और overall bias/history भी use करने का रास्ता मिलना।
User फ़ायदा (कैसे use करें/benefit)
छोटा lookback (10-15):
Fast market/volatile asset या intraday के लिए, ताकि indicator बदलती condition के हिसाब से तेजी से adapt करें।
Beginners जो टाइम-टू-टाइम active entries चाहते हैं, उन्हें short lookback से quick response मिलेगा।
बड़ा lookback (20-50+):
High TF पे, swing/positional users के लिए—ऐसे zones, जो बहुत rare और reliable हों। Real trend/fake out/trap से protection मिलेगी।
Pro traders, long-term portfolios में rarely shift होने वाले buy/sell levels automatic spot कर सकते हैं।
HTF के support/resistance, body high, volume high जैसी values निकालकर indicator हर signal को सिर्फ सच्चे big context में ही पास करेगा — accuracy, discipline और trust दोनों बनेगा।
Example:
मान लीजिए lookback_sup = 20; HTF पर, सबसे बड़े volume और candle body last 20 HTF bars से निकाले जाएँगे। अगर sudden spike/zone आता है, तो नया level बनेगा, वरना reliable old results चलेंगे।
निष्कर्ष:
Adaptive Lookback (HTF) आपको long/short trend context, big reversal, institution zones जैसी बड़ी info “ अपने time-frame/strategy के हिसाब से ही ” देता है—entry/exit के लिए ज्यादा भरोसेमंद और high-impact decision possible होता है!
Show Support/Resistance (showSR)
क्या है?
यह एक ON/OFF (True/False) setting है जिसके जरिए user decide करता है कि indicator chart पर automatically निकाले गए support और resistance levels को display करे या नहीं।
जब यह ON रहता है, तो सिस्टम खुद-ब-खुद सबसे ज़्यादा relevant support और resistance (S/R) levels को price chart पर label कर देता है।
क्यों है?
Beginners या even pro-traders भी कभी-कभी key S/R levels draw करने में गलती कर देते हैं या चीज़ें miss कर जाते हैं।
S/R levels trade entry, exit, stoploss और target decide करने का main scientific base होते हैं।
Manual S/R drawing में time भी लगता है और bias का risk भी रहता है—auto-detection हर trader का काम आसान कर देता है।
Intent (logic/लक्ष्य)
User को key market reversal/continuation zones instantly, chart पर real-time दिखाना।
Entry/exit decision-making को speed और confidence के साथ simple बनाना।
किसी भी strategy (price action, breakout, reversal etc.) में key level visualization on-the-fly मिले।
User फ़ायदा (कैसे use करें/benefit)
जैसे ही showSR ON करेंगे, सिस्टम चुपचाप adaptive logic से latest swing हाई/लो, उम्मीद के reversal/trap/continuation level labels chart पर दिखा देगा।
Entry के लिए—जब price support से bounce या resistance पर फंसे, तो action बहुत reliable होगा।
Stoploss/target planning ultra-simple—कोई भी level exact price पर देख सकते हैं।
Beginners को chart पढ़ना, risk management और candle structure analysis learning practically मिल जाता है—कोई guesswork या over-thinking नहीं।
Advanced user multi-timeframe chart्स पर cross-check के लिए instantly s/r देख सकते हैं।
Example:
Fast trading या market में फँसने वाले trade में, S/R ON कर देने से market की real “boundary” हर वक्त सामने रहेगी—best risk/reward और patience automatic आएगा।
निष्कर्ष:
Show Support/Resistance ON रखना हर trader को आत्मनिर्भर, confident और high-probability decision maker बना देता है—चाहे वह नया हो या प्रो।
Manual drawing, confusion या misplacement का risk एकदम vanish—chart always ready, always clear!Show Support/Resistance (showSR)
Show Liquidity Zones (showLIQ)
क्या है?
यह एक ON/OFF (True/False) टॉगल है—user decide करता है कि indicator chart पर हाई-वॉल्यूम वाले liquidity zones को highlight (दिखाए) करे या नहीं।
ON करने पर indicator intelligent logic से chart पर वही price area label करता है जहाँ सबसे ज़्यादा असली trade (liquidity) होती है—यानि जहाँ institutional, big-player activity या sudden big moves के आसार होते हैं।
क्यों है?
Market के बड़े moves या reversals अक्सर वहीं से शुरू होते हैं जहाँ बहुत high volume या liquidity जमा होती है; यही “trap” और “fake breakout” zone भी होते हैं।
Beginners liquidity zone को पचान नहीं पाते और असली move शुरू होने के समय उलट trade कर लेते हैं।
Automatic liquidity mapping से entry, exit या reversal का decision practical and pro-level हो जाता है।
Intent (logic/लक्ष्य)
User को real market power zones ekदम instantly chart पर दिखाना।
Beginners/pro दोनों को — कहाँ "smart money" छुपा है, कहाँ price trap या sudden reversal संभव है, उसका ready clue मिले।
Trade execution, stoploss placement और breakout management को safe, fast और systematic बनाना।
User फ़ायदा (कैसे use करें/benefit)
ON करने से chart पर वही zone highlight होंगे जहाँ price action सबसे ज्यादा meaning रखता है—entry का probability और risk management दोनों best रहेगा।
Beginners को समझ आएगा कि market में सिर्फ SR नहीं, liquidity zone भी important trend driver है।
Advanced user smart money follow करके trap से बचेगा और reversal या continuation पर strong एग्रेसिव entry ले सकेगा।
Panic moves, fake breakouts, और unusual volatility के समय यह zones maximize protection देते हैं।
Scalping, intraday, swing—हर strategy के लिए; liquidity zone का visualization फौरन available होगा।
Example:
Suppose price suddenly एक liquidity zone (high volume mark) के करीब आया—तो system आपको unconsciously alert करेगा कि या तो यह strong entry है या यहाँ से trend reversal मुमकिन है।
सारांश:
Show Liquidity Zones ON रखने से हर ट्रेडर instantly जान सकता है कि “market को सही मायने में कहाँ interest है”—entry timing sharp, big-player trap पहचानना आसान, और overall trading discipline ultra-confident रहेगा!
Manual guesswork पूरी तरह खत्म!
Show Trendlines (showTrend)
क्या है?
यह एक ON/OFF (True/False) setting है — user तय करता है कि indicator chart पर automatically adaptive trendlines plot करे या नहीं।
ON करने पर indicator current/higher time frame के हिसाब से latest price action trends (uptrend or downtrend) के relevant trendline सीधे chart पर draw कर देता है — साथ ही यह entry, breakout और reversal signal में instantly मदद करता है।
क्यों है?
Trendlines trading में price direction, entry/exit point, breakout या reversal zone, और overall price momentum visualize करने का सबसे बेसिक और सबसे भरोसेमंद तरीका हैं।
Beginners को manually trendline draw करना सीखना या perfect line लगाना बेहद tough लगता है — bias, error या miss होने का खतरा रहता है।
Auto-adaptive trendlines होने से market का असली structure बार-बार देखकर समझ में आता है — और signal confirmation भी आसानी से हो जाती है।
Intent (logic/लक्ष्य)
User को chart पर price action और trend का true angle instantly दिखाना।
Trend-following, breakout और reversal strategies को beginner level पर भी super easy बनाना।
No-bias charting experience — हर बार trendline reliable, adaptive और real-time दिखे।
User फ़ायदा (कैसे use करें/benefit)
Trend continuation/entry planning: जब price trendline के साथ/against react करे तो instant clarity मिलेगी — उपरी या निचली trendline के break होने पर entry/exit signal भी refined रहेगा।
Breakout trap या fake reversal से बचाव: Trendline हमेशा real price mood की side दिखाएगी — beginners कभी भी sideways market या false move में confused नहीं होंगे।
Chart minimal, practical और fast-acting रहेगा; चाहे swing tracing हो, scalping या long-term.
Advanced traders भी multiple timeframes/strategy के हिसाब से instant trendline reference के फायदा ले सकते हैं।
Pro-level visualization instantly बिना manual मेहनत के, confidence और patience अपने आप बढ़ेगी।
Example:
Suppose market uptrend में है, trendline chart पर auto-draw हो जायेगी; price जब भी support पर बने या break करे — system instant alert के साथ real trend जाने देगा।
निष्कर्ष:
Show Trendlines ON रखने से indicator entry/exit या reversal की direction instantly live दिखाता है — chart कभी blank, confusion या bias वाला नहीं रहता — beginners से लेकर expert तक, सभी को super-smooth price action discipline instantly मिल जाता है!
Manual drawing भूल जाएँ — chart हमेशा ready, always trustworthy!
S/R Lookback (Adaptive) (srLook)
क्या है?
यह setting यह डिफाइन करती है कि indicator adaptive support/resistance (S/R) levels निकालने के लिए पिछले कितनी bars (candles) का डेटा चेक करे।
यानी, हर बार जब indicator chart पर नया support या resistance label निकालता है, तो वह कितने पीछे जाकर swing high/low देखे — user खुद srLook से decide करता है।
Default value (जैसे 5 या उससे ऊपर)—पिछली 5 candles के lowest/highest को adaptive SR निकालने में इस्तेमाल करेगा।
क्यों है?
S/R calculation की reliability उस दौरान देखे गए data की width/size पर बहुत depend करती है।
कम lookback = तेजी से बदलने वाला support/resistance (quick trading/scalping)।
ज्यादा lookback = ज़्यादा stable, rarely changing, strong S/R (trend/swing position trading)।
हर strategy/trader और market structure के लिए सही lookback choose करना edge देता है।
Intent (लक्ष्य/logic)
User को control देना कि S/R detection कितना “responsive” हो या कितना “stable/reliable” हो।
Beginners को adaptive calculation logic और pro-traders को customizable S/R depth, दोनों देना।
Ultra clutter-free chart; chart भी साफ, levels भी logical।
User फ़ायदा (कैसे use करें/benefit)
Intraday/scalping के लिए:
कम srLook (5-7) — frequent, fast-reacting S/R; rapid moves के लिए बढ़िया।
Swing/positional trading के लिए:
ज्यादा srLook (10-20) — strong, rarely shifting S/R; false breakouts और noisy zones का risk बेहद कम।
Beginners खुद instantly देख सकते हैं कि chart पर कौन-सा level सबसे ज्यादा touch या respect हो रहा है — entry, stoploss, target super easy।
वैसे strategies में जहां price बहुत sideways है, srLook बढ़ाकर only real reversal zones को auto-pick कर सकते हैं।
Strategy-setup के हिसाब से experiment कर सकते हैं—result live देखेंगे।
Example:
अगर srLook = 7 है, तो indicator last 7 candles में सबसे lowest low को support और सबसे highest high को resistance मानकर chart पर adaptive डॉट या label लगा देगा — जैसे ही market S/R के पास आएगा system alert होगा।
निष्कर्ष:
S/R Lookback (Adaptive) user को अपने chart और trading style के हिसाब से best-fit support/resistance levels निकालने का फ्रीडम देता है—noise, guesswork और manual जानकारी की ज़रूरत खत्म, chart हमेशा practically trade-ready रहता है!
Liquidity Lookback (Adaptive) (liqLook)
क्या है?
Liquidity Lookback एक numerical setting है, जिससे user define करता है कि indicator liquidity (यानी unusual/high volume वाले zones) detect करने के लिए कितनी पिछली candles (bars) को average करें।
Default value (जैसे 20) - इसका मतलब है कि पिछले 20 bars का volume average लेकर ही liquidity zone set होगा।
क्यों है?
Liquidity trap, big volume breakout या absorption जैसे pro-level analysis सही तरीके से तभी identify होते हैं जब सही history देखी जाए।
कम lookback (छोटी window) से liquidity detection इतना fast हो जाता है कि हर छोटी volume spike भी ज़ोन बन जाती है (scalper/faster traders के लिए)।
बड़ी lookback (ज्यादा bars) से सिर्फ वे ही liquidity zones बनते हैं जो वास्तव में बहुत बार repeat हुए हों—ज्यादा reliable for swing/positional trading।
Intent (उद्देश्य/logic)
Chart पर liquidity detection को user strategy, asset type, और market behavior के हिसाब से customize करना।
Beginners को too many, irrelevant, या weak liquidity zones से बचाना और pro-users को rare yet powerful zone देने का विकल्प रखना।
System को practical, less noisy और adaptive बनाना।
User फ़ायदा (कैसे benefit लें?)
Fast/Scalping के लिए:
कम value रखें (5-10)—market में हर unusual volume पर liquidity zone दिखेगा, quick moves पकड़ पाएँगे।
Swing/Positional के लिए:
ज्यादा value रखें (20-30+)—सिर्फ high-impact, rarely changing, very important zone ही बनेगा, less noise!
Beginners simply experiment करके देख सकते हैं कि कौन सा value उसके chart और time-frame के लिए सबसे उपयोगी है।
Liquidity trap, fake breakout या panic entry का खतरा/liquidity drying zones आसानी से spot।
Pro-traders advanced tuning से ultra-specific zones बना सकते हैं।
Example:
अगर liqLook = 20, तो indicator पिछले 20 bars का volume average करेगा — और जब current volume उससे कहीं ऊपर जाएगा, तभी liquidity zone बनेगा।
छोटा देखना है तो कम value, बड़ी swing trade या safe zone चाहिए तो ज्यादा value।
निष्कर्ष:
Liquidity Lookback (Adaptive) हर user को अपने chart, trading style और strategy की जरूरत के अनुसार adaptive liquidity zones दिखाने का 100% control देता है — जिससे market trap, fake moves से बचना बहुत आसान हो जाता है और हर real move instantly identify होता है!
Liquidity Vol Multiplier (liqFactor)
क्या है?
यह एक float (जैसे—0.9, 1.2, 1.5 etc.) parameter है, जिससे user यह define करता है कि liquidity zone तब ही बनाना है जब current candle का volume, average liquidity volume (past liqLook bars का average) के कितने गुना से ज़्यादा हो।
यानी—market में unusual, real liquidity तभी highlight करनी है जब वो ordinary से काफी ऊपर हो।
क्यों है?
हर price action, reversal या breakout real volume पर ही बनता है—but, अगर हर छोटी volume spike को भी liquidity मान लें तो chart useless/overcrowded लगने लगेगा।
यह multiplier control देता है कि सिर्फ genuinely big money movement या rare event पर ही liquidity zone बने—regular/fake volume moves filter हो जाएँ।
Intent (logic/लक्ष्य)
System को noise-free, only big/true liquidity detect करना सिखाना, ताकि beginners बार-बार irrelevant signals से परेशान न हों।
Pro-users को smart-money वाली entries और true institutional action जल्दी और भरोसेमंद तरीके से दिखाना।
All-purpose—हर strategy, time-frame, asset type के हिसाब से practical tuning option देना।
User फ़ायदा (कैसे use करें/benefit)
Aggressive/Fast trades:
Liquidity vol multiplier कम रखें (0.8—1.0)—system छोटी-छोटी unusual moves को भी zones मानेगा (quick scalp या volatile moves के लिए)।
Conservative/Swing trades:
High value (1.2—2.0)—liquidity zone तभी बनेगा जब market में वाकई बड़ा order या participants move करें; गलती से fake zones आ ही नहीं सकते।
Beginners—अगर chart पर बहुत ज़्यादा liquidity zones दिख रहे हो तो value बढ़ा दें, कम दिख रहे हैं तो घटा दें।
Real power/trap zones हमेशा instantly मिलेंगे—entry, stoploss, या reversal सब safe, reliable और high-probability बन जाएगा।
Helps to avoid “false liquidity”—यानी normal या weak volume को ignore करके सिर्फ real/big action point दिखाएगा।
Example:
अगर liqFactor = 0.9 है, और avg liquidity 1L volume है—तो current volume 90,000 या उससे ज़्यादा होने पर ही liquidity zone बनेगा।
अगर liqFactor = 1.5 है—तो 1.5L से ऊपर volume हो तो ही zone बनेगा—system simply ignore कर देगा सब ordinary or dull market move।
निष्कर्ष:
Liquidity Vol Multiplier से liquidity detection real और practical रहता है—market के हर user के लिए chart साफ, entry high quality, और real risk management full control में।
Manual tuning करके ultra-personalized trading edge लेना super easy!
बिल्कुल! अब हम Dashboard के हर section को detailing में लेंगे—
हर parameter/intent की theory (ट्रेडर के लिए क्या फायदा?) और उसके नीचे LIVE code में logic कैसे काम कर रहा है दोनों बताएँगे, ताकि beginner और pro-trader दोनों को pure practical clarity मिले।
Dashboard Section: Intent HTF (dashboardIntent)
User Parameter / Intent क्या है?
Intent HTF बताता है कि higher time frame (HTF)—जैसे 1H, 4H, daily, जो भी आपने select किया—उस पर market का असली, पक्का bias क्या है:
BULLISH INTENT (HTF) — buyers overall control में हैं: उपर जाने की संभावना strongest है।
BEARISH INTENT (HTF) — sellers control में हैं: नीचे जाने/गिरावट की संभावना ज्यादा।
NO CLEAR INTENT — market sideways, indecisive या trend/fluctuation साफ नहीं है…entry करना risky हो सकता है।
यह Indicator कैसे Decide करता है? (आसान practical भाषा में)
बड़े Time Frame की Candle को Observe करना:
Indicator selected HTF पर candle का open, close, high, low, और volume देखता है (main chart time-frame से अलग window_tf setting के हिसाब से).
Biggest Volume & Move Compare करना:
पीछे lookback_sup जितनी candles में से, biggest candle body, biggest volume और percentage body निकालता है।
फिर percentile logic (जैसे top 80% percentile) देखता है—मतलब क्या current move उस historical data के comparison में वाकई unusual है?
Strict Signal Check:
अगर:
Candle का close उसके open से ऊपर है (for Bullish) और वह पिछले swing/high को भी cross कर रही है,
और volume/body/apni percentile threshold को beat कर रही है
…तभी intent बनेगा “HTF BULLISH”।
Vice versa अगर close नीचे, swing low से भी नीचे, और बाकी signals pass हो—तो “HTF BEARISH”।
अगर कोई भी strict condition fulfill नहीं होती, intent रहेगा “NO CLEAR INTENT”—यानि sideways/chop.
Persistent logic:
Intent बार-बार तड़ातड़ बदलता नहीं—एक बार बनी bias सिर्फ तभी change होगी, जब साफ-साफ opposite पक्का signal मिले।
इससे chart bar-bar flip नहीं करता—trader discipline और confidence में रहता है।
Trader को क्या Practical Benefit है?
Beginner — अब confuse नहीं होगा क्योंकी “market का real trend क्या है” सीधे dashboard पर लिखकर मिलेगा; कोई guess-work नहीं।
Pro-trader — directional bias के खिलाफ trade नहीं करेगा, risk-reward हमेशा optimal बनेगा।
Market sideways हो तो NO CLEAR INTENT दिखेगा, यानि extra discipline—trade avoid या wait करना easy लगेगा।
Example:
आपने 1H window चुनी। पिछली बार trend strong buyers वाला था, आज candle open से ऊपर, unusual volume, previous high breakout—system बोलेगा: BULLISH INTENT (HTF)
Market टेढ़ी, unclear—system NO CLEAR INTENT बोलेगा: avoid करो, या छोटी quantity में patience रखो।
नोट:
Intent HTF आपको winning side पर बने रहने, trap से बचने और हर big move के पहले reliable confirmation लेने की power देता है—कोई भी loss, overtrading और panic यहां से control में आ जाता है!
HTF Bias (persistentBiasMsg, htfBiasMsg)
क्या है - User की भाषा में:
“HTF Bias” ये बताता है कि बड़े time-frame (जैसे 1 घंटे, 4 घंटे, 1 दिन) पर market का असली माहौल क्या है — buyers के favor में (Bullish), sellers के favor में (Bearish), या market undecided/sideways (Chop) है।
Dashboard के बॉक्स में हमेशा updated रहता है — जिससे कोई भी trader instantly पहचान ले कि बड़े players का mood किस तरफ है।
Indicator इसका bias कैसे निकालता है—आसान भाषा में Logic:
HTF की Big Candle और Volume देखना:
Indicator main chart से ऊपर, एक और बड़े time-frame (जैसे 1H, 4H, 1D) पर market की बड़ी candle (उसका open, close, high, low) और उसका volume बहार ले आता है.
Historical Data से सबसे तेज़, शार्प move पकड़ना:
अब वह पीछे कुछ चुनी हुई बड़ी candles देखता है (user की lookback setting जितनी), और उनमें से सबसे बड़ी candle body, सबसे बड़ी volume, और सबसे बड़ा percentage body (size/length) निकालता है.
फिर इन values का percentile अप्लाई करता है (जैसे top 80% वाली candles).
Decision Point बनाना:
अब Indicator ये judge करता है:
क्या current HTF candle का close ज्यादा है open से?
क्या उसने पिछले swing/high को break किया?
क्या volume और candle का size उस बाकी historical data में सबसे बड़ा (या percentile के हिसाब से high) है?
अगर हां — तो यह मालूम होता है कि buyers/sellers ने बड़े time-frame पर सच्चा control दिखाया!
Bias assign करना (Bullish/Bearish/Chop):
अगर सब signal मिल जाएं और price ऊपर बंद हो, volume/body पुरानों से बड़ा हो तो — “HTF: Bullish”
अगर सब signal, पर price नीचे बंद हो, volume/body बड़े हों तो — “HTF: Bearish”
अगर signal clear नहीं है (कोई strong move या unusual volume/size नहीं) — “HTF: Chop” (मतलब न खरीदो न बेचो)
Bias Stable रखने का System:
Indicator bias को बार-बार flashy तरीके से नहीं बदलता!
जब तक clear और पक्की opposite signal ना मिले, bias पुराने वाले पर ही रहता है — जिससे हर बार का mood trustworthy और panic-free feel होता है.
Trader के लिए Practical Result:
आपको chart देखते ही जल्दी पता चल जायेगा — आज, इस time-frame पर market का बाप कौन है: buyers, sellers, या कोई भी नहीं!
आप बिना किसी doubt या panic के entry/exit plan कर सकते हैं — बस bias check करें और उसी direction की trade पर ज़ोर दें.
Beginners मार्केट के छोटे trap/fake-out से बच सकते हैं, Pro-trader कई time-frame strategies safe बना सकते हैं.
Simple Example:
मान लीजिए आप 15min chart देख रहे हैं, पर dashboard में “HTF Bias: Bullish” दिख रहा है (window_tf = 1H):
इसका मतलब hourly chart पर buyers की पकड़ है.
आप शांत mind से shorter chart पर buy setup में ही focus करेंगे!
जब तक bias flip न हो — only buy-side priority. Market sideways हो तो trade बचें.
Dashboard Section: Chart Action (chartAction)
User Parameter / Intent क्या है?
Chart Action यह डिसाइड करता है कि अभी main chart time-frame पर user को क्या action लेना चाहिए—BUY (खरीदें), SELL (बेचें), या WAIT (रुकें, कोई trade मत लें).
यह signal पूरा system के सारे rules, filters, trend strengths और user-selected options के साथ निकलता है—ताकि हर trade disciplined, practical और प्रूफ वाला हो.
Logic – Chart Action कैसे निकाला जाता है? (आसान words में)
System दो तरफ के इशारे देखता है:
Strong Trend:
System चेक करता है कि recent candles में majority bars एक ही साइड हैं (जैसे ज्यादातर green/bullish या red/bearish), और price moving average (trendBarCount वाली SMA) के ऊपर (long) या नीचे (short) है।
User Intent (Special Price Action Signals):
खास events जैसे wick analysis, absorption, unusual breakout, range expansion—इनमें से कोई strong signal active है या नहीं।
Rules – Signal किस logic से मिलते हैं:
BUY:
अगर strong trend long active हो (कई candles लगातार आगे),
या कोई भी user-intent वाली bullish signal ON हो (जैसे wick reversal, unusual breakout आदि)
=> तब “BUY”
SELL:
अगर strong trend short active हो (कई candles लगातार नीचे),
या bearish price action signal मिले
=> तब “SELL”
WAIT:
ऊपर में से कोई condition पूरी नहीं हो रही
=> कोई trade नहीं—“WAIT”
Why so strict?
System में दोनों—Trend & User Intent logics लें—ताकि fake move, sideways/trap से बचाव हो।
Signal तभी मिले जब सच्चा momentum या clear signal हो—false entry से बचाव!
Trader को Practical Result क्या मिलेगा?
Dashboard पर एकदम clear दिखेगा—“BUY” (green), “SELL” (red), या “WAIT” (yellow)
Beginners को कभी overtrade या बिना logic entry नहीं मिलेगी; chart action सिर्फ real, filters पास करने वाले मौके पर ही देगा।
Pro-Trader को signal-triggering full transparency और quick action—सिर्फ actionable मौके, कोई guess, कोई overconfidence नहीं।
WAIT की हालत में trader खुद-ब-खुद discipline में रहेगा और नो-ट्रेड का मज़ा समझेगा (best protection!)।
यह Logic background में कैसे चलता है? (सरल शब्दों में)
Indicator हर candle पर पूरी logic चेक करता है—trend score, price SMA, user enabled filters और price action triggers।
जैसे ही कोई strong buy या sell signal confidencely बनेगा—dashboard में action update हो जाएगा।
System कभी force entry नहीं देगा—अपने आप “WAIT” if कोई condition ना मिले.
Simple Example:
लगातार कई green bar, price average से ऊपर—system तरह का एक strong trend देखता है—फिर sudden unusual breakout candle (with big volume) आ गई—chart action: BUY।
Market अजीब/sideways—ना trend score पूरा, ना कोई action trigger—chart action: WAIT।
Strong red trend चला और sudden downside expansion candle—chart action: SELL।
Dashboard Section: TrendScore Long/Short
User Parameter / Intent क्या है?
यह cell आपको एक ही नजर में दिखाता है कि पिछली X candles (जितना “Trend Bar Lookback” set किया है) में कितनी candles बिना किसी confusion एकदम bullish direction में हैं—और कितनी bearish.
Format हमेशा — LongCount / ShortCount
जैसे: 5/2 का मतलब: 5 bullish, 2 bearish bar (trendBarCount=7).
Logic – यह TrendScore कैसे निकलता है?
Recent Candle Analysis:
Indicator अपनी selected window (e.g. पिछले 7 candles) में हर bar check करता है:
अगर bar का close, open से ज्यादा है: उसे bullish मानता है (LongCount +1)
अगर bar का close, open से कम है: उसे bearish मानता है (ShortCount +1)
Neutral candles (close = open) को ignore किया जा सकता है.
Count Store करा जाता है:
LongCount और ShortCount दोनों अलग-अलग number में store होते हैं.
Result Dashboard पर Show होता है:
यानि जैसे जैसे market direction बदलती है, trendScore dynamicaly update होता है.
Table cell में यह pair — “LongCount/ShortCount” — दिखता है.
Trader को Practical Benefit:
Quick Read:
एक हिस्से में कितने bars buyers ने control किया, कितने sellers ने—instantly दिख जाता है.
Market Mood:
अगर Long/Short count बराबर या ज्यादा short है तो समझ जाएं कि trend weak है—WAIT, no trade!
अगर Long बहुत ज्यादा है, short कम—Strong bullish momentum, safe entry; vice-versa bearish.
Beginner Friendly:
खुद manually candle गिनने की जरूरत नहीं—trendScore से हर beginner/confused trader direction clarity पा सकता है.
Strategy Tuning:
Swing, scalping या positional—हर setup के लिए lookback adjust कर सकते हैं, trendScore से फुर्तीला या slow trend देख सकते हैं.
Example:
Suppose आपने trendBarCount = 7,
पिछले 7 bars में 6 bullish, 1 bearish — TrendScore: 6/1 (Strong uptrend!)
अगर 2 long, 5 short — 2/5 (Strong downtrend!)
अगर 3/4, 4/3 — मतलब trend बराबर/sideways — Avoid rash trading.
Dashboard Section: Reason (WHY)
User Parameter / Intent क्या है?
Reason (WHY) user को बिलकुल साफ-साफ बताता है कि अभी dashboard जो trade action बता रहा है (BUY/SELL/WAIT), उसका सबसे बड़ा, सबसे मजबूत कारण क्या है।
यानी — system मुझे entry क्यों दे रहा है? किस filter या logic से ये action निकला?
Logic – Reason कैसे निकलता है? (Simple, Practical Explanation)
सब Active Price Action और Trend दाखिल पढ़ना:
Indicator हर candle पर यह देखता है कि कौन सा signal या filter सबसे ज्यादा powerful काम कर रहा है।
जैसे: unusual breakout (बड़ा range + volume), wick reversal (lower/upper wick extra बड़ा signal), absorption (high vol + special close), strong trend, या expansion candle आदि।
Priority/Order of Reasons:
Code एक-एक करके सबसे potent (ज्यादा weight वाला) reason को check करता है—
सबसे पहले unusual breakout है? तो वही reason।
नहीं, तो wick analysis—वह है तो वही।
ऐसे ही absorption, expansion, strong trend—जैसे जैसे logic pass करता है, first one को ही reason दिखा देता है।
अगर कोई भी खास signal active नहीं, ना trend-score, ना price-action —
Reason: “Wait/No Clear Signal”
Live Reason in Dashboard:
जैसे ही कोई नई candle बनेगी, reason bar/bar auto-update होता है, ताकि हर trade से पहले user को एक line में solid justification मिले।
Trader को Practical Benefit:
Complete Clarity:
आपको instantly पता चल जाएगा —entry मिली तो वह किस price action या trend signal से मिली।
No Blind Trust:
FAITH से नहीं—logic समझ के entry/exit लें।
Beginner या advanced trader—reason भटकेगा नहीं!
System Debug & Learn:
अगर बार-बार रीजन "Wait/No Clear Signal" दिखाए — patience रखें!
और जो भी signal आता है, उसकी price pattern instant chart पर match कर सकते हैं—pattern पहचानना आसान।
Transparency:
System कभी भी hidden logic पे trade फँसाएगा नहीं—सामने reason मिलेगा।
नोट:
Reason (WHY) cell हर trader को ultra-confidence देता है—signal का base, reasoning, और validation हर entry से पहले always ready!
Dashboard के बाकी logic भी चाहिए हों तो बताइए!Dashboard Section: Reason (WHY)
User Parameter / Intent क्या है?
“Reason (WHY)” dashboard cell आपको live बताता है:
इस candle पर trade का जो सिग्नल मिला (BUY/SELL/WAIT), उसका सबसे बड़ा कारण क्या था?
आपको पता चलता है, सिग्नल trend से आया, unusual breakout से, wick analysis से, दबाव या absorption से — या कोई reason ही नहीं, इसलिए WAIT signal।
Logic – कैसे Decide होता है? (आम भाषा में):
सारी Filters और Signals को Check करना:
हर बार system सारे price action filters एक-एक करके देखता है, जैसे:
क्या unusual breakout हुआ? (बहुत बड़ा range और volume)
क्या wick analysis से बार reversal signal मिला?
क्या volumetric absorption signal दिखी?
क्या expansion candle बना?
क्या strong trend pattern मिला?
इन सब signals में जिसे सबसे strong priority मिली है, वही as main reason चुनी जाएगी।
Order of Importance (Priority):
सबसे पहले unusual breakout trigger है? — तो वही.
फिर wick analysis — signal है तो वही.
ऐसे ही absorption, expansion, trend—जिसको पहले logic trigger हुआ उसे reason बना देंगे।
अगर कोई खास signal नहीं तो — “Wait/No Clear Signal”.
Reason Dashboard पर instant update होता है:
जैसे ही candle बनेगी, reason field auto-update — जिससे entry से पहले पता चले “सिग्नल का असली आधार क्या है?”।
Trader को फायदा:
कभी भी “blind trust” या confusion नहीं—हर action का open मनाव “सबूत” मिलता है।
सीखने के लिए — हर signal पर उस price pattern/logic को खुद तुरंत सीख सकेंगे।
प्रो और beginner दोनों — reason देख कर समझ सकते हैं कि कितना weighty/trusted signal मिला है।
अगर बार-बार “Wait/No Clear Signal” दिखे—entry से बचें, patience रखें।
Dashboard Section: TrendScore Long/Short
User Parameter / Intent क्या है?
यह section सीधा-सीधा आपको बताता है कि पिछली X candles (जितनी आपने “Trend Bar Lookback” सेट की है, जैसे 7) में से कितनी bullish बनीं (Long score), और कितनी bearish (Short score)।
फॉर्मैट: LongCount / ShortCount
जैसे: 5 / 2
मतलब: 7 में से 5 bars buyers के हाथ में, 2 bars sellers के।
Logic—कैसे निकलता है? (आसान भाषा में)
Candle-by-Candle Count:
Indicator, कहिए की एक छोटा सा loop चलाता है — पिछली जितनी candles आपने “trendBarCount” में select की उतनी।
हर candle की direction check करता है:
अगर close > open (green) → Long score +1
अगर close < open (red) → Short score +1
Result Store:
जितनी bullish bars मिलीं, उतना “Long”; bearish bars, उतना “Short”।
Table में यह pair साथ में show होता है — जैसे 5/2 या 3/4।
Live Auto-Update:
जैसी नई candle बनेगी, TrendScore update हो जाएगा — market का latest mood instantly दिख जाएगा।
Trader को Practical Benefit:
Instant Trend Strength:
Momentum देखना easy—buyers का domination है या sellers का, या बराबरी।
Trap/Fake Trend से Protection:
अगर Long और Short score करीब-करीब बराबर—market sideways या uncertain, entry avoid कर सकते हैं।
अगर Long बहुत ज्यादा—strong bullish trend (buying signal रिजि्ड बना रहेगा), vice versa short के लिए।
No Manual Count:
Beginner को बिना count किए candles का trend पता चलेगा—झंझट खत्म।
Strategy Tuning:
Aggressive trader small lookback/fast trend tune करें; conservative बड़ा lookback सेट करें—पूरा control!
Examples:
6/1: यानी पिछले 7 bars में 6 बार buyers ने win किया—momentum बहुत strong है!
3/4: दोनों almost same—trend weak या reversal zone, caution रखो।
0/7: केवल sellers, अतिवादी bearish—discipline maintain।
Summary:
TrendScore आपको instantly market के side का “real” हाल बताता है—entry से पहले intuition नहीं, clear number देखकर disciplined decision लो!
क्या है?
ये आपको दिखाता है कि “पिछली जितनी candles आप सेट करोगे” (जैसे 7), उनमें से कितनी bars bullish थीं (long score), कितनी bearish (short score)।
Logic कैसे चलता है?
Indicator हर बार पिछली X candles को देखता है।
अगर कोई bar की closing ऊपर (open से ऊपर) है — उसे bullish मानेगा (long score +1)
अगर नीचे — bearish (short score +1)
सबकी गिनती हो गई —
तो Dashboard में दिख जाएगा,
Example:
6/1 → 6 bullish, 1 bearish (strong uptrend)
2/5 → 2 bullish, 5 bearish (downtrend)
3/4 → बराबर – trend कमजोर है
जैसे-जैसे नई candle बनेगी, यह score भी auto-update रहेगा।
Trader को क्या फायदा?
बिना manually गिने, trend का सही हाल instantly पता लगेगा।
अगर दोनों तरफ का score नज़दीक है (3/4 या 4/3), तो समझो market चक्कर में है—cautious रहो, फंसने का chance।
एक साइड बहुत ज्यादा है (6/1, 7/0)—तो confidence से उसी तरफ entry/की planning करो।
निष्कर्ष:
TrendScore आपका सबसे तेज़, simplest “market mood thermometer” है—trend strong है, weak है या confusing—बस एक cell में दिख जाएगा!
Dashboard Section: Strong Trend (Long/Short)
User Parameter / Intent क्या है?
यह cell आपको तुरंत बताता है कि “अभी market में trend कितना पक्का, मजबूत और reliable है”—
YES (long) /
YES (short)
एक या दोनों side में।
यानी—क्या अभी buyers/sellers का जोर इतना है कि system उसे strong trend माने?
Logic—कैसे Decide होता है? (आसान/practical explaination)
TrendScore Threshold Check:
System सबसे पहले देखता है:
आपके चुने गए window (जैसे trendBarCount = 7) में, bullish या bearish bars का total score trendScoreMin से ज्यादा है या नहीं?
(जैसे min = 5, तो 7 में कम से कम 5 बार एक ही साइड हों।)
Price Position:
सिर्फ count काफी नहीं — check करता है कि अभी price अपनी average से ऊपर (long) या नीचे (short) भी है या नहीं।
Bulls के लिए: closing average से ऊपर
Bears के लिए: closing average से नीचे
Result Assign:
अगर दोनों conditions pass हों (count + average)—
तो “Strong Trend Long” (YES)
या “Strong Trend Short” (YES)
बाकी case में blank/empty यानी कोई strong trend नहीं।
Dashboard Cell:
Display:
अगर दोनों side strong हों: YES/YES
बस long: YES/
बस short: /YES
दोनों empty: /
Trader को Practical Benefit:
Fake move/trap से बचाव:
अगर strong trend नहीं दिखता है तो avoid करें—सिर्फ real momentum पर ही trade करो!
Entry confirmation:
Pro trader इस cell के YES आने पर ही aggressive setup लेता है—otherwise patience/avoid.
Quick Crosscheck:
Beginner को instantly समझ आ जाएगा—buy-side entry only तब लूँ जब YES (long), sell-side तब जब YES (short)
No guess, only discipline:
Trend कमजोर है—धैर्य रखो, system खुद बताएगा कब confident हो!
Examples:
**YES/ ** (Long side full strong trend, short weak)
** /YES** (Short side strong trend, long weak)
YES/YES (Very rare, usually trend reversal moment)
** /** (No strong trend, high risk, wait!)
निष्कर्ष:
Strong Trend cell सिर्फ high-probability, high-momentum setups के लिए GREEN/SIGNAL देता है—बाकी time patience सिखाता है। Trade हमेशा safest, trap से दूर!
Dashboard Section: HTF Vol/Body
User Parameter / Intent क्या है?
यह cell आपको higher time frame (HTF) पे दो चीजें real-time में दिखाता है:
V: (Volume) बड़ी candle पर आया actual volume कितना है
B: (Body %) उस HTF की candle का body percentage कितना है
यानी—market के बड़े trend या reversal के समय unusual volume और candle body size देखकर आप instantly समझ सकते हैं कि कितना मजबूत momentum या move आया।
Logic—कैसे Calculate होता है? (आसान/practical language)
HTF का डेटा उठाओ:
Indicator आपकी chosen विंडो (जैसे 1H, 4H) की candle को देखता है—उसका volume (V), open, close, high, low values।
Volume Calculation (V):
V: सिर्फ current HTF candle का volume ही नहीं दिखाता,
बल्कि पताि लेता है percentile logic के हिसाब से unusual/highest volume का adaptive average क्या है।
Compare भी करता है: क्या अभी volume “normal से बहुत बड़ा” है (यानी big move possible)?
Body Percentage (B):
B: Candle body (open-close) को पूरे candle ke range (high-low) से percentage में निकालता है:
जितना यह % ज्यादा, उतना momentum मांगा जाता है!
यानी, छोटी body = indecisive, बड़ी body = strong trend bar.
Dashboard Cell:
Show करता है:
“V: actual-vol / B: actual-body%”
Live auto-update होता है हर नई candle पे।
Trader को Practical Benefit:
Big Players का Action Quickly देखना:
अगर किसी HTF candle पे असामान्य volume या बड़ी body% दिखे, आप तुरंत समझ सकते हैं—market में institutions, big money एक्टिव है, breakout/trend reversal का chance ज्यादा है।
Trap & Fakeout Avoidance:
Low volume or low body% = sideways या fake move, entry avoid करें।
बहुत high volume + big body% = real break, momentum, safe entry!
Strategy Adaptation:
Swing, positional, or multiday trades के लिए, high volume/body% वाले candle का इंतजार ही आपके setup को next-level safe बना देगा।
Examples:
V: 152000 / B: 85.4 → HTF पे high unusual volume और body भी strong (great signal for big move)
V: 34000 / B: 12 → Volume low, body% छोटा (avoid, sideways/trap move possible)
V: 90000 / B: 35 → Normal volume, average trend; no urgent action
Summary:
HTF Vol/Body आपको instantly बताता है कि market में real action हो रहा है या noise; entry, exit या wait—all decision one glance में तय!

Stocks Multi-Indicator Alerts (cryptodaddy)//@version=6
// Multi-Indicator Alerts
// --------------------------------------------
// This script combines technical indicators and basic analyst data
// to produce composite buy and sell signals. Each block is heavily
// commented so future modifications are straightforward.
indicator("Multi-Indicator Alerts", overlay=true, max_labels_count=500)
//// === Daily momentum indicators ===
// Relative Strength Index measures price momentum.
rsiLength = input.int(14, "RSI Length")
rsi = ta.rsi(close, rsiLength)
// Money Flow Index incorporates volume to track capital movement.
// In Pine Script v6 the function only requires a price source and length;
// volume is taken from the built-in `volume` series automatically.
mfLength = input.int(14, "Money Flow Length")
mf = ta.mfi(hlc3, mfLength)
// `mfUp`/`mfDown` flag a turn in money flow over the last two bars.
mfUp = ta.rising(mf, 2)
mfDown = ta.falling(mf, 2)
//// === WaveTrend oscillator ===
// A simplified WaveTrend model produces "dots" indicating potential
// exhaustion points. Values beyond +/-53 are treated as oversold/overbought.
n1 = input.int(10, "WT Channel Length")
n2 = input.int(21, "WT Average Length")
ap = hlc3 // typical price
esa = ta.ema(ap, n1) // smoothed price
d = ta.ema(math.abs(ap - esa), n1) // smoothed deviation
ci = (ap - esa) / (0.015 * d) // channel index
tci = ta.ema(ci, n2) // trend channel index
wt1 = tci // main line
wt2 = ta.sma(wt1, 4) // signal line
greenDot = ta.crossover(wt1, wt2) and wt1 < -53
redDot = ta.crossunder(wt1, wt2) and wt1 > 53
plotshape(greenDot, title="Green Dot", style=shape.circle, color=color.green, location=location.belowbar, size=size.tiny)
plotshape(redDot, title="Red Dot", style=shape.circle, color=color.red, location=location.abovebar, size=size.tiny)
//// === Analyst fundamentals ===
// Fundamental values from TradingView's database. If a ticker lacks data
// these will return `na` and the related conditions simply evaluate false.
rating = request.financial(syminfo.tickerid, "rating", period="FY")
targetHigh = request.financial(syminfo.tickerid, "target_high_price", period="FY")
targetLow = request.financial(syminfo.tickerid, "target_low_price", period="FY")
upsidePct = (targetHigh - close) / close * 100
downsidePct = (close - targetLow) / close * 100
// `rating` comes back as a numeric value (1 strong sell -> 5 strong buy). Use
// thresholds instead of string comparisons so the script compiles even when
// the broker only supplies numeric ratings.
ratingBuy = rating >= 4 // buy or strong buy
ratingNeutralOrBuy = rating >= 3 // neutral or better
upsideCondition = upsidePct >= 2 * downsidePct // upside at least twice downside
downsideCondition = downsidePct >= upsidePct // downside greater or equal
//// === Daily moving-average context ===
// 50 EMA represents short-term trend; 200 EMA long-term bias.
ema50 = ta.ema(close, 50)
ema200 = ta.ema(close, 200)
longBias = close > ema200 // price above 200-day = long bias
momentumFavorable = close > ema50 // price above 50-day = positive momentum
//// === Weekly trend filter ===
// Higher timeframe confirmation to reduce noise.
weeklyClose = request.security(syminfo.tickerid, "W", close)
weeklyEMA20 = request.security(syminfo.tickerid, "W", ta.ema(close, 20))
weeklyRSI = request.security(syminfo.tickerid, "W", ta.rsi(close, rsiLength))
// Weekly Money Flow uses the same two-argument `ta.mfi()` inside `request.security`.
weeklyMF = request.security(syminfo.tickerid, "W", ta.mfi(hlc3, mfLength))
weeklyFilter = weeklyClose > weeklyEMA20
//// === Buy evaluation ===
// Each true condition contributes one point to `buyScore`.
c1_buy = rsi < 50 // RSI below midpoint
c2_buy = mfUp // Money Flow turning up
c3_buy = greenDot // WaveTrend oversold bounce
c4_buy = ratingBuy // Analyst rating Buy/Strong Buy
c5_buy = upsideCondition // Forecast upside twice downside
buyScore = (c1_buy?1:0) + (c2_buy?1:0) + (c3_buy?1:0) + (c4_buy?1:0) + (c5_buy?1:0)
// Require all five conditions plus trend filters and persistence for two bars.
buyCond = c1_buy and c2_buy and c3_buy and c4_buy and c5_buy and longBias and momentumFavorable and weeklyFilter and weeklyRSI > 50 and weeklyMF > 50
buySignal = buyCond and buyCond
//// === Sell evaluation ===
// Similar logic as buy side but inverted.
c1_sell = rsi > 70 // RSI above overbought threshold
c2_sell = mfDown // Money Flow turning down
c3_sell = redDot // WaveTrend overbought reversal
c4_sell = ratingNeutralOrBuy // Analysts neutral or still buy
c5_sell = downsideCondition // Downside at least equal to upside
sellScore = (c1_sell?1:0) + (c2_sell?1:0) + (c3_sell?1:0) + (c4_sell?1:0) + (c5_sell?1:0)
// For exits require weekly filters to fail or long bias lost.
sellCond = c1_sell and c2_sell and c3_sell and c4_sell and c5_sell and (not longBias or not weeklyFilter or weeklyRSI < 50)
sellSignal = sellCond and sellCond
// Plot composite scores for quick reference.
plot(buyScore, "Buy Score", color=color.green)
plot(sellScore, "Sell Score", color=color.red)
//// === Confidence table ===
// Shows which of the five buy/sell checks are currently met.
var table status = table.new(position.top_right, 5, 2, border_width=1)
if barstate.islast
table.cell(status, 0, 0, "RSI", bgcolor=c1_buy?color.new(color.green,0):color.new(color.red,0))
table.cell(status, 1, 0, "MF", bgcolor=c2_buy?color.new(color.green,0):color.new(color.red,0))
table.cell(status, 2, 0, "Dot", bgcolor=c3_buy?color.new(color.green,0):color.new(color.red,0))
table.cell(status, 3, 0, "Rating", bgcolor=c4_buy?color.new(color.green,0):color.new(color.red,0))
table.cell(status, 4, 0, "Target", bgcolor=c5_buy?color.new(color.green,0):color.new(color.red,0))
table.cell(status, 0, 1, "RSI>70", bgcolor=c1_sell?color.new(color.red,0):color.new(color.green,0))
table.cell(status, 1, 1, "MF down",bgcolor=c2_sell?color.new(color.red,0):color.new(color.green,0))
table.cell(status, 2, 1, "Red dot", bgcolor=c3_sell?color.new(color.red,0):color.new(color.green,0))
table.cell(status, 3, 1, "Rating", bgcolor=c4_sell?color.new(color.red,0):color.new(color.green,0))
table.cell(status, 4, 1, "Target", bgcolor=c5_sell?color.new(color.red,0):color.new(color.green,0))
//// === Alert text ===
// Include key metrics in alerts so the chart doesn't need to be opened.
buyMsg = "BUY: RSI " + str.tostring(rsi, "#.##") +
", MF " + str.tostring(mf, "#.##") +
", Upside " + str.tostring(upsidePct, "#.##") + "%" +
", Downside " + str.tostring(downsidePct, "#.##") + "%" +
", Rating " + str.tostring(rating, "#.##")
sellMsg = "SELL: RSI " + str.tostring(rsi, "#.##") +
", MF " + str.tostring(mf, "#.##") +
", Upside " + str.tostring(upsidePct, "#.##") + "%" +
", Downside " + str.tostring(downsidePct, "#.##") + "%" +
", Rating " + str.tostring(rating, "#.##")
// Alert conditions use static messages; dynamic data is sent via `alert()`
alertcondition(buySignal, title="Buy Signal", message="Buy conditions met")
alertcondition(sellSignal, title="Sell Signal", message="Sell conditions met")
if buySignal
alert(buyMsg, alert.freq_once_per_bar_close)
if sellSignal
alert(sellMsg, alert.freq_once_per_bar_close)
//// === Watch-out flags ===
// Gentle warnings when trends weaken but before full sell signals.
warnRSI = rsi > 65 and rsi <= 65
warnAnalyst = upsidePct < 2 * downsidePct and upsidePct > downsidePct
alertcondition(warnRSI, title="RSI Watch", message="RSI creeping above 65")
alertcondition(warnAnalyst, title="Analyst Watch", message="Analyst upside shrinking")
if warnRSI
alert("RSI creeping above 65: " + str.tostring(rsi, "#.##"), alert.freq_once_per_bar_close)
if warnAnalyst
alert("Analyst upside shrinking: up " + str.tostring(upsidePct, "#.##") + "% vs down " + str.tostring(downsidePct, "#.##") + "%", alert.freq_once_per_bar_close)
//// === Plot bias moving averages ===
plot(ema50, color=color.orange, title="EMA50")
plot(ema200, color=color.blue, title="EMA200")
//// === Cross alerts for context ===
goldenCross = ta.crossover(ema50, ema200)
deathCross = ta.crossunder(ema50, ema200)
alertcondition(goldenCross, title="Golden Cross", message="50 EMA crossed above 200 EMA")
alertcondition(deathCross, title="Death Cross", message="50 EMA crossed below 200 EMA")