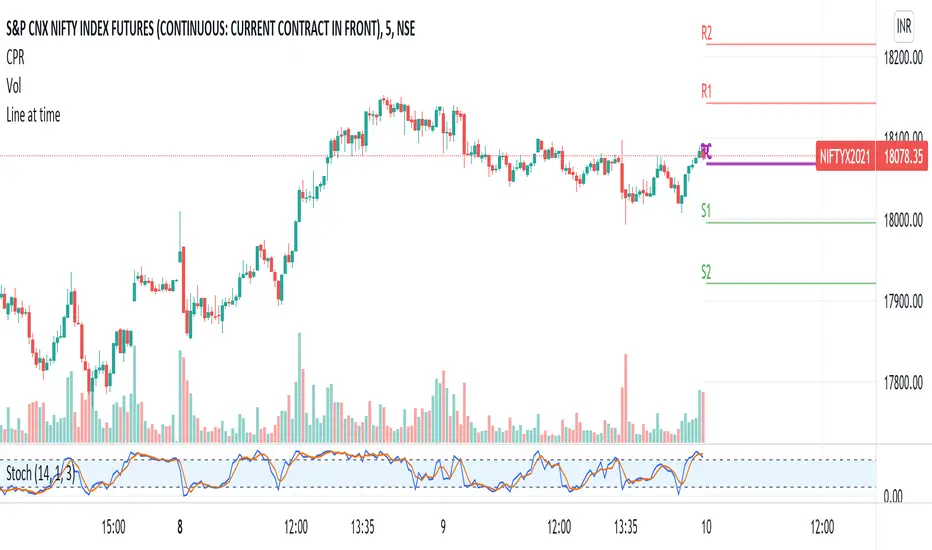
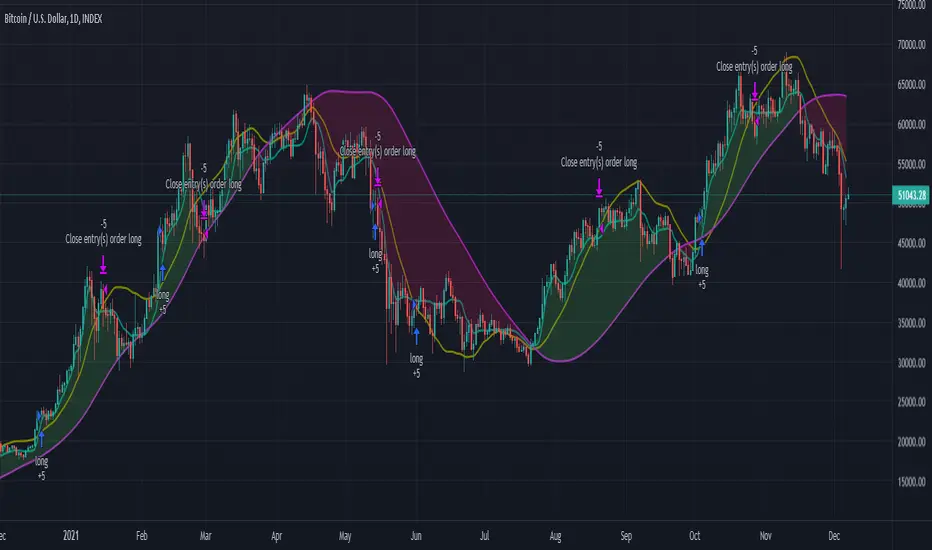
SAR+RSI+EMAs SignalsNOTE:
Indicator based strategies may expire and begin to work again. There are various ways to check the expiration of these strategies but I suggest equity curve trading (EC trading) as the best one.
Please check every single indicator based strategy to see if it’s still profitable or it has been expired to avoid losses.
Principles:
I personally believe every profitable indicator-based setup need 3 factors. Actually I analyze indicator-based set up in this way!
1- Trend detector: a tool that detect the “trend”.
2- Oscillators (Discount finder): a tool that detects “discounts” in the direction of the trend.
3- Stimulus: A tool that indicates the Initiation of a movement.
There may be profitable strategies that do not use all three, because other factors are strong enough to lead us to profit, but they are rare and sometimes they hide the other forgotten factor in the main two ones.
Elements:
(Since most of traders here, are familiar with these famous indicators I will not take your time to write about their uses and formula)
SAR: As a Trend detector, regarding position of close and SAR
EMA 7 and EMA 21: As trend detectors, regarding position of EMA 7 as fast “moving average” and EMA 21 as slow one. Also we need another confirmation for trend regarding EMA 7 and closing price of the signal candle.
RSI: In this strategy RSI is used both as a discount finder and a stimulus.
For RSI being over/under 50, regarding the trend, a possible discount may have been occurred. Imagine these conditions: close>EMA7, EMA7>EMA21, close>SAR and simultaneously RSI being under 50 is really a sign of powerful uptrend which it’s RSI decreasing might be a sign of corrective move, which will be following a bullish impulsive move.
The other use of RSI is to stimulate a buy signal by “crossing” over 50 or 30 (50 as balanced point of momentum and 30 as a sign of ending an oversold) or stimulate a sell signal by “crossing” under 50 or 70 (50 as balanced point of momentum and 70 as a sign of ending an overbought).
Entry point: you can use one of the followings.
1- Open of the next candle
2- EMA 7
3- Open of the signal candle
(Totally optional but “open of the next candle” is suggested by me.)
SL: Use one of the followings.
1- SAR or some pips (regarding ATR Or your experience of this trading instrument’s fluctuations in this time frame) below the SAR
2- Fixed amount (regarding ATR Or your experience of this trading instrument’s fluctuations in this time frame)
3- Use EMA21 as dynamic SL (if a candle far enough from the initiative candle close over (for sell) below ( for buy)
Again number 1 is suggested by me.
TP: Use one of the followings.
1- Use static levels or zones of support and resistance as TP.
2- Use dynamic levels for instance band of BB or moving averages (Moving the SL is possible).
3- Use fixed R to R
And I believe static zones of support and resistance work better.
Examples:
I indicate a buy signal on the chart!
Using local level as TP worked just good.
Using EMA was better in this case.
And using a riskier level or a fixed R to R is obvious in the chart!
Since in the range markets, this strategy may not work well and at the same time, TP to SL might be too small to be worth the risk, I prefer to use levels to filter range market conditions!
I convert all those circumstances to a simple buy and sell signs on the chart!
EMA21 and SAR are still visible because it is possible that traders use them for their TP and SL.
This is how it look without EMA21 and SAR!
Another screenshot of this strategy!
I also add a check box to filter signals by another trend detector. MATD created by me to help traders detect trend!
As it’s visible, some profitable signals filtered too, but using a longer-term trend detector as an additional one, alongside the double EMAs is very useful for this strategy.
The other box “use high&low instead of close for fast EMA” makes the “EMA7 and close” trend detector an easygoing one!
Almost everything is editable here!
*** I did not invent this strategy, you can find it for free on net ***
I'll change it to a "strategy" instead of an indicator if reader like to!
Search in scripts for "curve"

MS Market Timing ModelThis script uses subtle sentiment analysis to try to reduce the risk of positioning in assets. By "assets" I mean: the QQQ ETF as a synonym for positioning in Nasdaq-100 stocks and the TLT ETF as a placeholder for US government bonds with very long maturity and that as a risk-averse alternative. The coloring of the pseudo capital curve means:
* green = 100% QQQ
* red = 100% TLT
* yellow = 50% QQQ/50% TLT

statisticsLibrary "statistics"
General statistics library.
erf(x) The "error function" encountered in integrating the normal
distribution (which is a normalized form of the Gaussian function).
Parameters:
x : The input series.
Returns: The Error Function evaluated for each element of x.
erfc(x)
Parameters:
x : The input series
Returns: The Complementary Error Function evaluated for each alement of x.
sumOfReciprocals(src, len) Calculates the sum of the reciprocals of the series.
For each element 'elem' in the series:
sum += 1/elem
Should the element be 0, the reciprocal value of 0 is used instead
of NA.
Parameters:
src : The input series.
len : The length for the sum.
Returns: The sum of the resciprocals of 'src' for 'len' bars back.
mean(src, len) The mean of the series.
(wrapper around ta.sma).
Parameters:
src : The input series.
len : The length for the mean.
Returns: The mean of 'src' for 'len' bars back.
average(src, len) The mean of the series.
(wrapper around ta.sma).
Parameters:
src : The input series.
len : The length for the average.
Returns: The average of 'src' for 'len' bars back.
geometricMean(src, len) The Geometric Mean of the series.
The geometric mean is most important when using data representing
percentages, ratios, or rates of change. It cannot be used for
negative numbers
Since the pure mathematical implementation generates a very large
intermediate result, we performed the calculation in log space.
Parameters:
src : The input series.
len : The length for the geometricMean.
Returns: The geometric mean of 'src' for 'len' bars back.
harmonicMean(src, len) The Harmonic Mean of the series.
The harmonic mean is most applicable to time changes and, along
with the geometric mean, has been used in economics for price
analysis. It is more difficult to calculate; therefore, it is less
popular than eiter of the other averages.
0 values are ignored in the calculation.
Parameters:
src : The input series.
len : The length for the harmonicMean.
Returns: The harmonic mean of 'src' for 'len' bars back.
median(src, len) The median of the series.
(a wrapper around ta.median)
Parameters:
src : The input series.
len : The length for the median.
Returns: The median of 'src' for 'len' bars back.
variance(src, len, biased) The variance of the series.
Parameters:
src : The input series.
len : The length for the variance.
biased : Wether to use the biased calculation (for a population), or the
unbiased calculation (for a sample set). .
Returns: The variance of 'src' for 'len' bars back.
stdev(src, len, biased) The standard deviation of the series.
Parameters:
src : The input series.
len : The length for the stdev.
biased : Wether to use the biased calculation (for a population), or the
unbiased calculation (for a sample set). .
Returns: The standard deviation of 'src' for 'len' bars back.
skewness(src, len) The skew of the series.
Skewness measures the amount of distortion from a symmetric
distribution, making the curve appear to be short on the left
(lower prices) and extended to the right (higher prices). The
extended side, either left or right is called the tail, and a
longer tail to the right is called positive skewness. Negative
skewness has the tail extending towards the left.
Parameters:
src : The input series.
len : The length for the skewness.
Returns: The skewness of 'src' for 'len' bars back.
kurtosis(src, len) The kurtosis of the series.
Kurtosis describes the peakedness or flatness of a distribution.
This can be used as an unbiased assessment of whether prices are
trending or moving sideways. Trending prices will ocver a wider
range and thus a flatter distribution (kurtosis < 3; negative
kurtosis). If prices are range-bound, there will be a clustering
around the mean and we have positive kurtosis (kurtosis > 3)
Parameters:
src : The input series.
len : The length for the kurtosis.
Returns: The kurtosis of 'src' for 'len' bars back.
excessKurtosis(src, len) The normalized kurtosis of the series.
kurtosis > 0 --> positive kurtosis --> trending
kurtosis < 0 --> negative krutosis --> range-bound
Parameters:
src : The input series.
len : The length for the excessKurtosis.
Returns: The excessKurtosis of 'src' for 'len' bars back.
normDist(src, len, value) Calculates the probability mass for the value according to the
src and length. It calculates the probability for value to be
present in the normal distribution calculated for src and length.
Parameters:
src : The input series.
len : The length for the normDist.
value : The series of values to calculate the normal distance for
Returns: The normal distance of 'value' to 'src' for 'len' bars back.
normDistCumulative(src, len, value) Calculates the cumulative probability mass for the value according
to the src and length. It calculates the cumulative probability for
value to be present in the normal distribution calculated for src
and length.
Parameters:
src : The input series.
len : The length for the normDistCumulative.
value : The series of values to calculate the cumulative normal distance
for
Returns: The cumulative normal distance of 'value' to 'src' for 'len' bars
back.
zScore(src, len, value) Returns then z-score of objective to the series src.
It returns the number of stdev's the objective is away from the
mean(src, len)
Parameters:
src : The input series.
len : The length for the zScore.
value : The series of values to calculate the cumulative normal distance
for
Returns: The z-score of objectiv with respect to src and len.
er(src, len) Calculates the efficiency ratio of the series.
It measures the noise of the series. The lower the number, the
higher the noise.
Parameters:
src : The input series.
len : The length for the efficiency ratio.
Returns: The efficiency ratio of 'src' for 'len' bars back.
efficiencyRatio(src, len) Calculates the efficiency ratio of the series.
It measures the noise of the series. The lower the number, the
higher the noise.
Parameters:
src : The input series.
len : The length for the efficiency ratio.
Returns: The efficiency ratio of 'src' for 'len' bars back.
fractalEfficiency(src, len) Calculates the efficiency ratio of the series.
It measures the noise of the series. The lower the number, the
higher the noise.
Parameters:
src : The input series.
len : The length for the efficiency ratio.
Returns: The efficiency ratio of 'src' for 'len' bars back.
mse(src, len) Calculates the Mean Squared Error of the series.
Parameters:
src : The input series.
len : The length for the mean squared error.
Returns: The mean squared error of 'src' for 'len' bars back.
meanSquaredError(src, len) Calculates the Mean Squared Error of the series.
Parameters:
src : The input series.
len : The length for the mean squared error.
Returns: The mean squared error of 'src' for 'len' bars back.
rmse(src, len) Calculates the Root Mean Squared Error of the series.
Parameters:
src : The input series.
len : The length for the root mean squared error.
Returns: The root mean squared error of 'src' for 'len' bars back.
rootMeanSquaredError(src, len) Calculates the Root Mean Squared Error of the series.
Parameters:
src : The input series.
len : The length for the root mean squared error.
Returns: The root mean squared error of 'src' for 'len' bars back.
mae(src, len) Calculates the Mean Absolute Error of the series.
Parameters:
src : The input series.
len : The length for the mean absolute error.
Returns: The mean absolute error of 'src' for 'len' bars back.
meanAbsoluteError(src, len) Calculates the Mean Absolute Error of the series.
Parameters:
src : The input series.
len : The length for the mean absolute error.
Returns: The mean absolute error of 'src' for 'len' bars back.

Volume Zone Oscillator (VZO)My interpretation of Walid Khalil's Volume Zone Oscillator (VZO) as published in the 2009 International Federation of Technical Analysis Journal.
This VZO indicator is also the same as Danielle Shay's popular Simpler Trading TurboVZO indicator.
ABOUT:
The oscillator breaks up volume activity into positive and negative categories. It is positive when the current closing price is greater than the prior closing price and negative when it's lower than the prior closing price. The resulting curve plots through relative percentage levels that yield a series of buy and sell signals, depending on level and indicator direction.
HOW TO USE THE INDICATOR:
The default period is 14 but can be adjusted after backtesting.
The VZO points to a positive trend when it rises above and maintains the 5% level, and a negative trend when it falls below the 5% level and fails to turn higher. Oscillations between the 5% and 40% levels mark a bullish trend zone, while oscillations between -40% and 5% mark a bearish trend zone. Meanwhile, readings above 40% signal an overbought condition, while readings above 60% signal an extremely overbought condition. Alternatively, readings below -40% indicate an oversold condition, which becomes extremely oversold below -60%.
Kahlil recommends confirming VZO signals with a 14-period average directional index (ADX), with values greater than 18 pointing to a trending market - search Tradingview's built-in indicators for the Directional Movement Index (DMI).
INTRADAY SCALPING:
Whilst the VZO is already smoothed with an exponential moving average, the indicator settings include an additional 'smoothing' function to remove any excess 'noise' in the plots for intraday use.

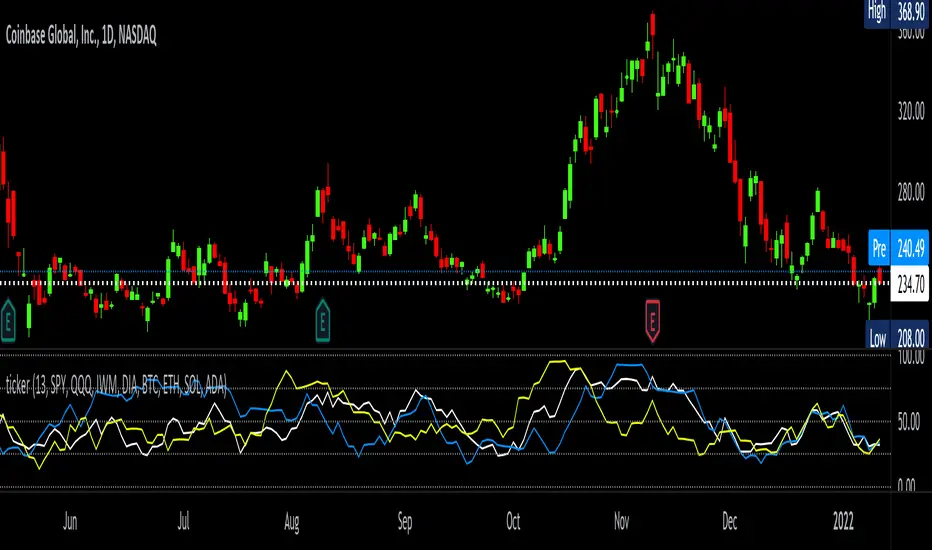
tickerTracker MFI OscillatorDid you ever want to have a neat indicator window in line with your chart showing a different ticker? tickerTracker is a Money Flow Index (MFI) oscillator. The Money Flow Index (MFI) is a technical oscillator that uses price and volume for identifying overbought or oversold conditions in an asset. More or less, everything is connected in the market. The tickerTracker lets you see what is happening with another ticker that you have connected a correlation between them. For my example here, I'm using COIN in the main chart with the tickerTracker displaying BTC, QQQ and COIN Money Flow Index (MFI) in its window. As the end user, you can customize the colors, the length input and the ticker. Like any other indicator, the shorter length input, the more quickly responsive and the longer the length input, the smoother curve print.
Default Values:
MFI Length = 13
Chart ticker = white
SPY = white
QQQ = blue
IWM = yellow
DIA = orange
BTC/USD = yellow
ETH/USD = green
SOL/USD = purple
ADA/USD = red
Do your own due diligence, your risk is 100% your responsibility. This is for educational and entertainment purposes only. You win some or you learn some. Consider being charitable with some of your profit to help humankind. Good luck and happy trading friends...
*3x lucky 7s of trading*
7pt Trading compass:
Price action, entry/exit
Volume average/direction
Trend, patterns, momentum
Newsworthy current events
Revenue
Earnings
Balance sheet
7 Common mistakes:
+5% portfolio trades, capital risk management
Beware of analyst's motives
Emotions & Opinions
FOMO : bad timing, the market is ruthless, be shrewd
Lack of planning & discipline
Forgetting restraint
Obdurate repetitive errors, no adaptation
7 Important tools:
Trading View app!, Brokerage UI
Accurate indicators & settings
Wide screen monitor/s
Trading log (pencil & graph paper)
Big, organized desk
Reading books, playing chess
Sorted watch-list
Checkout my indicators:
Fibonacci VIP - volume
Fibonacci MA7 - price
pi RSI - trend momentum
TTC - trend channel
AlertiT - notification
tickerTracker - MFI Oscillator
www.tradingview.com
TFS Volume Oscillator Noise FilteredINTRODUCTION
This indicator is inspired from " HPotter’s TFS: Volume Oscillator " but I have used Heiken Ashi and Hull Moving Average in calculations in order to reduce noise for better trades.
The concept is similar to that of On-Balance Volume indicator (OBV). It is calculated according to these rules:
If Heiken Ashi Close > Heiken Ashi Open, Volume is positive
If Heiken Ashi Close < Heiken Ashi Open, Volume is negative
If Heiken Ashi Close = Heiken Ashi Open, Volume is neutral
BAR COLORS
Green Color:
Strong Uptrend with good volume supported momentum.
Faded Green Color:
Volume is relatively weakening.
Red Color:
Strong Downtrend with volume support.
Gray Color:
Downtrend negative volume is relatively weakening.
DEFAULTS SETTINGS
Volume length is 30 (Better for timeframes higher than 1H)
Hull Moving Average length is 14 but Linear Regression Curve can be selected with same length

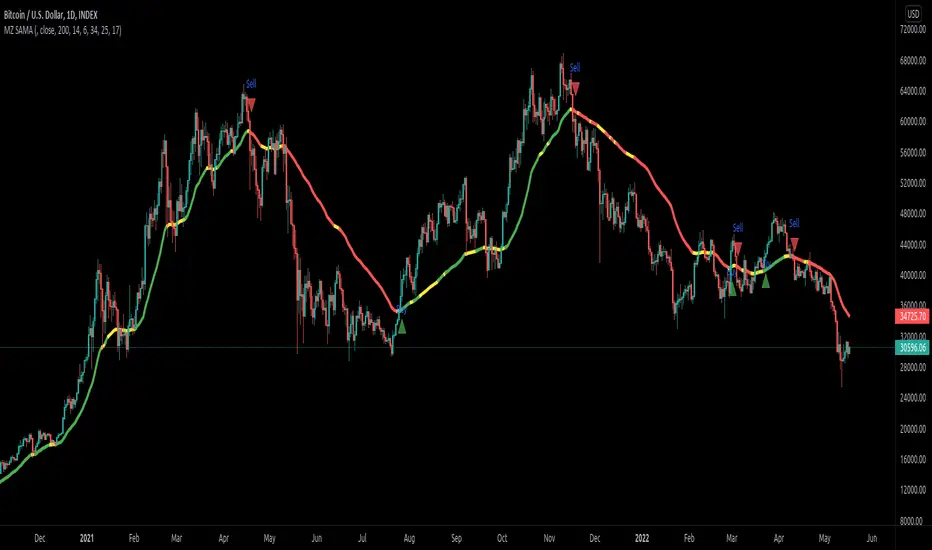
Slope Adaptive Moving Average (MZ SAMA)INTRODUCTION
This script is inspired from "Vitali Apirine (Stocks & Commodities V.36:5: Adaptive Moving Averages)" and a correction to Dynamic Volume Adaptive Moving Average (MZ DVAMA) . I have used slope filtering in order to adapt trends more precisely for better trades.
Slope adaption makes it better for adaptive moving average to detect trend health; making it easier to make decisions based on market strong price momentums, consolidations or breakouts. This isn’t possible with only using simply Adaptive Moving Averages .
Adaptive Moving Averages curve doesn’t change its length based on Slope but it uses slope adaptive color for trend strength detection.
TREND DETECTION
Green Color:
Strong Uptrend with good price momentum.
Red Color:
Strong Downtrend.
Yellow Color:
Market is either choppy, sideways or consolidating. Better to avoid taking new positions and if trade is running then its good to carry it on.
DEFAULTS SETTINGS
AMA length is 200 (Better for timeframes higher than 1H)
Minor length is 6
Major length is 14
Slope period is set to 34 with 25 of initial range. Consolidation is always below 17.
ALERTS
Buy/Sell Alerts will follow on when slope is out of consolidation/choppiness area. Best entry is at absolute alerts timing but other trades can be started midway based on trend condition.
pandas_taLibrary "pandas_ta"
Level: 3
Background
Today is the first day of 2022 and happy new year every tradingviewers! May health and wealth go along with you all the time. I use this chance to publish my 1st PINE v5 lib : pandas_ta
This is not a piece of cake like thing, which cost me a lot of time and efforts to build this lib. Beyond 300 versions of this script was iterated in draft.
Function
Library "pandas_ta"
PINE v5 Counterpart of Pandas TA - A Technical Analysis Library in Python 3 at github.com
The Original Pandas Technical Analysis (Pandas TA) is an easy to use library that leverages the Pandas package with more than 130 Indicators and Utility functions and more than 60 TA Lib Candlestick Patterns.
I realized most of indicators except Candlestick Patterns because tradingview built-in Candlestick Patterns are even more powerful!
I use this to verify pandas_ta python version indicators for myself, but I realize that maybe many may need similar lib for pine v5 as well.
Function Brief Descriptions (Pls find details in script comments)
bton --> Binary to number
wcp --> Weighted Closing Price (WCP)
counter --> Condition counter
xbt --> Between
ebsw --> Even Better SineWave (EBSW)
ao --> Awesome Oscillator (AO)
apo --> Absolute Price Oscillator (APO)
xrf --> Dynamic shifted values
bias --> Bias (BIAS)
bop --> Balance of Power (BOP)
brar --> BRAR (BRAR)
cci --> Commodity Channel Index (CCI)
cfo --> Chande Forcast Oscillator (CFO)
cg --> Center of Gravity (CG)
cmo --> Chande Momentum Oscillator (CMO)
coppock --> Coppock Curve (COPC)
cti --> Correlation Trend Indicator (CTI)
dmi --> Directional Movement Index(DMI)
er --> Efficiency Ratio (ER)
eri --> Elder Ray Index (ERI)
fisher --> Fisher Transform (FISHT)
inertia --> Inertia (INERTIA)
kdj --> KDJ (KDJ)
kst --> 'Know Sure Thing' (KST)
macd --> Moving Average Convergence Divergence (MACD)
mom --> Momentum (MOM)
pgo --> Pretty Good Oscillator (PGO)
ppo --> Percentage Price Oscillator (PPO)
psl --> Psychological Line (PSL)
pvo --> Percentage Volume Oscillator (PVO)
qqe --> Quantitative Qualitative Estimation (QQE)
roc --> Rate of Change (ROC)
rsi --> Relative Strength Index (RSI)
rsx --> Relative Strength Xtra (rsx)
rvgi --> Relative Vigor Index (RVGI)
slope --> Slope
smi --> SMI Ergodic Indicator (SMI)
sqz* --> Squeeze (SQZ) * NOTE: code sufferred from very strange error, code was commented.
sqz_pro --> Squeeze PRO(SQZPRO)
xfl --> Condition filter
stc --> Schaff Trend Cycle (STC)
stoch --> Stochastic (STOCH)
stochrsi --> Stochastic RSI (STOCH RSI)
trix --> Trix (TRIX)
tsi --> True Strength Index (TSI)
uo --> Ultimate Oscillator (UO)
willr --> William's Percent R (WILLR)
alma --> Arnaud Legoux Moving Average (ALMA)
xll --> Dynamic rolling lowest values
dema --> Double Exponential Moving Average (DEMA)
ema --> Exponential Moving Average (EMA)
fwma --> Fibonacci's Weighted Moving Average (FWMA)
hilo --> Gann HiLo Activator(HiLo)
hma --> Hull Moving Average (HMA)
hwma --> HWMA (Holt-Winter Moving Average)
ichimoku --> Ichimoku Kinkō Hyō (ichimoku)
jma --> Jurik Moving Average Average (JMA)
kama --> Kaufman's Adaptive Moving Average (KAMA)
linreg --> Linear Regression Moving Average (linreg)
mgcd --> McGinley Dynamic Indicator
rma --> wildeR's Moving Average (RMA)
sinwma --> Sine Weighted Moving Average (SWMA)
ssf --> Ehler's Super Smoother Filter (SSF) © 2013
supertrend --> Supertrend (supertrend)
xsa --> X simple moving average
swma --> Symmetric Weighted Moving Average (SWMA)
t3 --> Tim Tillson's T3 Moving Average (T3)
tema --> Triple Exponential Moving Average (TEMA)
trima --> Triangular Moving Average (TRIMA)
vidya --> Variable Index Dynamic Average (VIDYA)
vwap --> Volume Weighted Average Price (VWAP)
vwma --> Volume Weighted Moving Average (VWMA)
wma --> Weighted Moving Average (WMA)
zlma --> Zero Lag Moving Average (ZLMA)
entropy --> Entropy (ENTP)
kurtosis --> Rolling Kurtosis
skew --> Rolling Skew
xev --> Condition all
zscore --> Rolling Z Score
adx --> Average Directional Movement (ADX)
aroon --> Aroon & Aroon Oscillator (AROON)
chop --> Choppiness Index (CHOP)
xex --> Condition any
cksp --> Chande Kroll Stop (CKSP)
dpo --> Detrend Price Oscillator (DPO)
long_run --> Long Run
psar --> Parabolic Stop and Reverse (psar)
short_run --> Short Run
vhf --> Vertical Horizontal Filter (VHF)
vortex --> Vortex
accbands --> Acceleration Bands (ACCBANDS)
atr --> Average True Range (ATR)
bbands --> Bollinger Bands (BBANDS)
donchian --> Donchian Channels (DC)
kc --> Keltner Channels (KC)
massi --> Mass Index (MASSI)
natr --> Normalized Average True Range (NATR)
pdist --> Price Distance (PDIST)
rvi --> Relative Volatility Index (RVI)
thermo --> Elders Thermometer (THERMO)
ui --> Ulcer Index (UI)
ad --> Accumulation/Distribution (AD)
cmf --> Chaikin Money Flow (CMF)
efi --> Elder's Force Index (EFI)
ecm --> Ease of Movement (EOM)
kvo --> Klinger Volume Oscillator (KVO)
mfi --> Money Flow Index (MFI)
nvi --> Negative Volume Index (NVI)
obv --> On Balance Volume (OBV)
pvi --> Positive Volume Index (PVI)
dvdi --> Dual Volume Divergence Index (DVDI)
xhh --> Dynamic rolling highest values
pvt --> Price-Volume Trend (PVT)
Remarks
I also incorporated func descriptions and func test script in commented mode, you can test the functino with the embedded test script and modify them as you wish.
This is a Level 3 free and open source indicator library.
Feedbacks are appreciated.
This is not the end of pandas_ta lib publication, but it is start point with pine v5 lib function and I will add more and more funcs into this lib for my own indicators.
Function Name List:
bton()
wcp()
count()
xbt()
ebsw()
ao()
apo()
xrf()
bias()
bop()
brar()
cci()
cfo()
cg()
cmo()
coppock()
cti()
dmi()
er()
eri()
fisher()
inertia()
kdj()
kst()
macd()
mom()
pgo()
ppo()
psl()
pvo()
qqe()
roc()
rsi()
rsx()
rvgi()
slope()
smi()
sqz_pro()
xfl()
stc()
stoch()
stochrsi()
trix()
tsi()
uo()
willr()
alma()
wcx()
xll()
dema()
ema()
fwma()
hilo()
hma()
hwma()
ichimoku()
jma()
kama()
linreg()
mgcd()
rma()
sinwma()
ssf()
supertrend()
xsa()
swma()
t3()
tema()
trima()
vidya()
vwap()
vwma()
wma()
zlma()
entropy()
kurtosis()
skew()
xev()
zscore()
adx()
aroon()
chop()
xex()
cksp()
dpo()
long_run()
psar()
short_run()
vhf()
vortex()
accbands()
atr()
bbands()
donchian()
kc()
massi()
natr()
pdist()
rvi()
thermo()
ui()
ad()
cmf()
efi()
ecm()
kvo()
mfi()
nvi()
obv()
pvi()
dvdi()
xhh()
pvt()

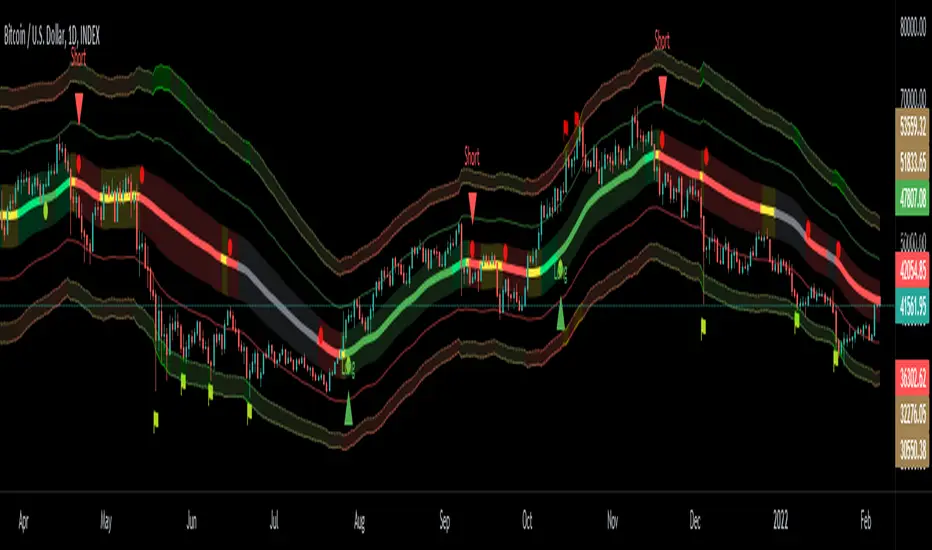
Dynamic Volume Adaptive Moving Average (MZ DVAMA)INTRODUCTION
This indicator is inspired from "Vitali Apirine (Stocks & Commodities V.36:5: Adaptive Moving Averages)" but I have used Volume filtering to in order to adapt trends more precisely for better trades.
Volume adaption makes it better for adaptive moving average to detect trend health; making it easier to make decisions based on market strong momentums, consolidations or breakouts. This isn’t possible with only using simply Adaptive Moving Averages .
Adaptive Moving Averages curve doesn’t change its length based on Volume but it uses dynamic volume adaptive color for trend strength detection.
TREND DETECTION
Green Color:
Strong Uptrend with good volume supported momentum.
Lime Color:
Uptrend is relatively weak but still good enough to follow.
Red Color:
Strong Downtrend with volume support.
Gray Color:
Downtrend is relatively weak but still good enough to follow.
Yellow Color:
Market is either choppy, sideways or consolidating. Better to avoid taking new positions and if trade is running then its good to carry it on.
DEFAULTS SETTINGS
AMA length is 200 (Better for timeframes higher than 1H)
Minor length is 6
Major length is 14
Volume RSI period is considered to be 200 with 50 period for its Hull Moving Average
ALERTS
Buy/Sell Alerts will follow on when volume is breaking up above provided value. Best entry is at absolute alerts timing but other trades can be started midway based on trend condition.
ROC PercentileRate Of Change Percentile calculates the current ROC (user defined length) as a percentile rank.
We use 2 separate arrays, one for all positive ROC values and one for all negative values within a defined lookback period. Then the current ROC value is compared to those arrays to find it's percentile ranking.
For example, a ranking of 75 means the ROC is in the 75th percentile of all POSITIVE ROC values over the lookback period.
A ranking of -80 is in the 80th percentile of all NEGATIVE ROC values over the lookback period.
Most ROC scripts use raw ROC values (or smoothed or otherwise altered), or have stochastic formula applied to them, I've not seen one that displays ROC as percentile ranking of previous positive/negative values.
What is the advantage?
Raw ROC data only gives half the picture. What we want to do is compare the ROC to previous ROC values, to give a sense of scale. Raw ROC values don't give you that context and you can only compare visually, usually limited to the number of bars you can see on your screen.
Using a percentile ranking gives us the context of current Rate of Change relative to the previous Rate of Change over a large lookback period, and not just visually but mathematically.
Why not using a long stochastic ROC? The problem with stochastics in general is that an outlier data point can ruin the data for the rest of the lookback period.
For example, imagine a huge outlier 8% ROC. The 2nd largest ROC is 4% and the 3rd largest is 2%, with all other values below this.
In this example, a stochastic ROC would display the 8% outlier as 100, the 4% as 50, the 2% as 25 and all other data would be squeezed down between 0-25.
Additionally, a value of 60 may have vastly different meaning depending on whether the lookback period contains a large outlier or not.
With a percentile ranking, that 8% outlier would still have a value of 100. But the 4% and 2% would be 99 and 98 respectively (this assumes 100 data points in the series, in reality values will usually be decimals).
This effectively flattens the curve and gives a more consistent and dependable experience, allowing you to more accurately assess the relative importance of the current ROC.
The line of circles is set at the 50 and -50 values for quick comparison.
Values > 50 represent ROC greater than 50% of previous positive ROC values.
Values < -50 represent ROC greater than 50% of previous negative ROC values.

BTC Golden Bottom with Adaptive Moving AverageIntroduction:
This study uses Adaptive Moving Average with 1 year of length to plot on all time history Index Calculated by Tradingview . All previous $BTC bear runs bottomed on this curve which makes it important enough. Use this only on " "
Default Values:
AMA length is 1 year
Minor length is 50
Major length is 100

MA MTF Cross StrategyStrategy Introduction
This multi-timeframe strategy generates buy and sell entries based on two Moving Averages’ cross with an option to turn on trend direction confirmation through 3rd Moving Average selection. While all three moving averages can be selected from the following list:
SMA
EMA
DEMA
TEMA
LRC
WMA
MF
VAMA
TMA
HMA
JMA
Kijun v2
EDSMA
McGinley
Only long trades are enabled currently
Default Settings
I've set the default selection to the perfect options for 1D timeframe. You can modify all MAs selections and their lengths according to your selected timeframes.
Following default settings are used:
Heiken Ashi Candles are selected by default as source
1st Moving Average selection is set to LRC (Linear Regression Curve)
Length of 1st Moving Average is set to 50
2nd Moving Average is set to EDSMA (Ehlers Deviation-Scaled Moving Average)
Length of 2nd Moving Average is set to 30
3rd Moving Average is set to HMA (Hull Moving Average)
Length of 3rd Moving Average is set to 200
Uptrend direction confirmation through 3rd Moving Average is set to false by default
Start date is set to start from 2013
Backtesting can also be done selecting %age of equity
Suggestions for Usage
Mostly winning trades by set defaults have no prominent drawdown so losing trades can be abolished with Stoploss. Would soon add Stoploss and Takeprofit options in next version. Also, if you want an alerts version of it then just comment below and would publish it later. I’ve found this strategy useful on 1D timeframe with described default settings but multiple Mas selections can be explored further.
MZ SRSI Strategy V1.0Strategy Introduction
This strategy starts from selection of 1st Moving Average from one of following:
SMA
EMA
DEMA
TEMA
LRC
WMA
MF
VAMA
TMA
HMA
JMA
Kijun v2
EDSMA
McGinley
Then it calculates the RSI of selected 1st Moving Average
In the end it calculates Moving Average of previously calculated RSI and for this purpose 2nd Moving Average is also selected from above list.
Cross of RSI and its Moving Average generates Strategy Alerts
Only long trades are enabled currently
Default Settings
I've set the default selection to the perfect options for 1D and 4h timeframes. You can modify both MAs selection and their length according to your selected timeframe.
Following default settings are used:
Heiken Ashi Candles are selected by default as source
1st Moving Average selection is set to LRC (Linear Regression Curve)
Length of 1st Moving Average is set to 50
RSI length is set to 2 because it is supposed to be fast
2nd Moving Average of RSI is set to TMA (Triangular Moving Average)
Length of 1st Moving Average is set to 5
Start date is set to 2011
Backtesting can also be done selecting %age of equity
Suggestions for Usage
Mostly winning trades have no prominent drawdown so losing trades can be abolished with Stoploss. Would soon add Stoploss, MTF and Takeprofit options in next version. Also if you want an alerts version of it then just comment below and would publish it later. I’ve found this strategy useful on 1D and 4h timeframes with described default settings.

Strength Momentum IndicatorThis indicator is a fork of . It takes it a step further by including RSI and ADX information, which are represented in this indicator as follows:
MOM: The histogram itself is a linear regression curve, by default for the study period the Fibonacci series and exponential moving average were used. You can adjust the settings to your liking.
RSI: Whenever the RSI is outside the normal ranges (which you can adjust in the settings), the bar in the histogram will turn amber to warn you.
ADX: Crosses are drawn along the 0 line to indicate the ADX . Blue means that the ADX is below the trend level (adjustable in the settings), and orange means that it is above that level. Darker colors indicate that the ADX has risen from the previous bar, while lighter colors indicate that it has fallen.
Almost all of the normally adjustable values can be adjusted in the settings for each of the base indicators. Also adjustable:
The RSI alert levels (30 and 70 by default).
The ADX crossover, i.e. the point at which the ADX value is considered to indicate a strong trend (25 by default).
All colors, naturally.
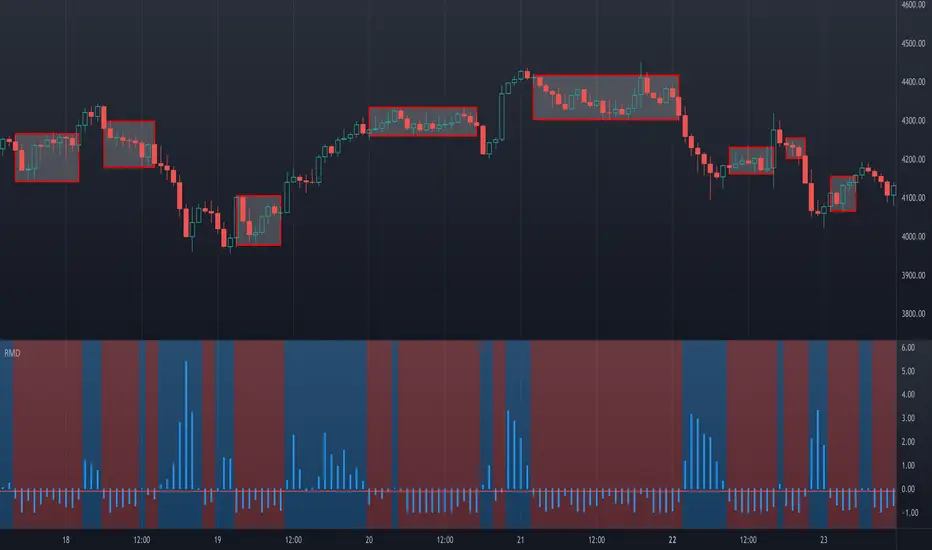
Ranging Market Detector [AstrideUnicorn]Determining if the market is in a trend or a range regime is a very complex problem. And knowing the answer can be, in some situations, the real holy grail. If the trader knows when the market is in a range regime, they can avoid overtrading and make moving average crossover strategies more profitable. A regime switch from a trend to a range can be a signal to close open positions. It can also be helpful when trading such instruments as short-term binary options. When the market is ranging directional moves are not expected, and the trader should be careful as opening a position in such conditions is, by some degree, a random outcome game. Range breakouts trading is one more example when knowing the market regime is critical.
We have created an indicator that predicts the current market regime. It smooths the price using the Kalman filter and analyzes the curve's slope. If the absolute value of the slope is low, then the market is in range mode and vice versa. To distinguish between the two regimes, the algorithm compares the absolute value of the slope with its long-term average.
HOW TO USE
The indicator shows the difference between the absolute slope value and its long-term average as a histogram. When a bar of the histogram is higher than the threshold level presented by the red line, the market is in a trending regime. In this regime, the background of the indicator is blue. When the market is in a range regime, the indicator background turns red.
The threshold level helps to control the lag. The greater it is, the more lagging the indicator will be. By default, this value is set to a negative value. It means that the indicator switches from range to trend a little bit earlier than the slope gets higher than the average slope. You can use the value of zero or low negative values to find the optimal tradeoff between the strength of the signals and their lag.
SETTINGS
The indicator has one input parameter called Threshold. It sets the threshold level described above. Its value should be close to zero. The less the value is, the less is the indicator's lag, but at the same time, the less confirmed the regime-switching signals are.
The use cases can be very different. And as the code is open, you can also use the indicator as a building block for your custom trading strategies.
Let us know your thoughts and suggestions!
VertLine on Moonhe sixth Mount type is the Lunarian, so named from the fact that the portion of the hand by which they are identified is the Mount of Luna or, as it is more commonly designated, the Mount of the Moon.
As single signs or in combination, the star, triangle, circle, single vertical line, square, or trident strengthen the Mount of the Moon.
Grilles, crosses, cross-bars, islands, dots, or badly formed stars indicate defects of the Mount, either of health or character.
Color, nails, and other matters detailed in the course of this chapter will determine which (119). The mount of the Moon must be judged both by the strength of its curve outwardly on the percussion of the hand and by the size of the pad it forms on the inside of the palm. If it is seen forming a decided bulge outwardly, call it a well developed Mount (120); if in addition it is exceedingly thick, forming a large pad on the inside of the hand, it must be regarded as a very strong Mount (121); and it the outward protuberance and the thick pad are both unusually large, you have an excessive Lunarian subject (122). In this type vertical lines on the Mount add strength to it and cross lines show defects. If you see a strong vertical line extending the length or nearly so of the Mount, it will indicate and added strength, and a number of vertical lines if lying close together will also increase its power. These lines on a Mount developed at the side, but flat in the palm, will be nearly as powerful as if the Mount showed a medium development inside the palm. If the outward development and the large pad in the palm is seen, which has also a deep, well-cut vertical line or lines, it will show an excessively developed Lunarian reaching to the danger-point of the type.