Binary Options Fast Scalping [TradingFinder] M1 & M5 Signals🔵 Introduction
In the structure of financial markets, spiky moments and sudden price movements play a key role in Liquidity Grabs and Market Structure Resets. These movements usually occur after the accumulation of orders in Buy Side or Sell Side Liquidity zones and are accompanied by rapid breaks in the form of Break of Structure (BoS) or Change of Character (CHoCH).
At this stage, the market temporarily moves in the direction of liquidity to trigger counter orders and then enters a Retracement or Pullback phase, a point where professional traders using the Smart Money Concept (SMC) look for candle confirmation to enter with precision.
This strategy is built upon the same logic : an initial spiky move as a signal of institutional or liquidity driven algorithms, followed by a controlled pullback toward areas such as the Order Block, Fair Value Gap (FVG), or Imbalance Zone, and finally an entry based on a strong confirmation candle (Engulf, Rejection, Breaker) that defines the true direction of order flow.
This combination of price behavior, especially on lower timeframes such as M1 or M5, provides an ideal setup for fast Scalping, Micro Structure Trading, and even short term directional prediction in Binary Options Trading.
Since the main focus of this method is on identifying liquidity phases, structural confirmations, and momentum confirmation candles, the trader can design entries with high probability and logical stop loss placement using the concepts of Fractal Market Structure and Multi Timeframe Confirmation.
In the scalping version, the main objective is to capture the move toward the next liquidity pool or opposite demand and supply zone, while in the binary version, only the prediction of the next candle’s direction matters. This strategy inherently operates based on Smart Money Behavior, Liquidity Engineering, and Order Flow Dynamics, allowing the extraction of fast and profitable moves from the internal logic of market structure.
🔵 How to Use
The operational logic of this strategy is based on Liquidity Sweep, Pullback, and Confirmation Candle. The trader should first identify the initial Impulse Move, which is often accompanied by liquidity absorption around Buy Side or Sell Side Liquidity areas. After that, the market enters the Retracement phase and returns to structural zones such as the Order Block or the Fair Value Gap (FVG).
At this point, a position is taken only when a confirmation candle (Engulf, Breaker, or Rejection Candle) closes in the direction of continuation and aligns with the new structure (BOS or CHoCH). Applying this model on lower timeframes offers the highest precision for fast Scalping or for predicting the next candle’s direction in Binary Option trading.
🟣 Bullish Setup
In the bullish setup, the market first forms a spiky upward move with a sudden increase in momentum, indicating the activation of liquidity flow in the Buy Side Liquidity zone. This movement is usually accompanied by a Break of Structure (BOS) to the upside and marks the beginning of the Impulse Move phase. After this move, the price enters the Pullback phase and returns to structural areas such as the Bullish Order Block, Fair Value Gap (FVG), or Mitigation zone.
At this stage, the trader waits for a bullish confirmation candle (Bullish Engulf or Breaker Candle) to validate the end of the retracement. Entry is made at the close of the confirmation candle or on a minor pullback, with the stop loss placed below the Swing Low or below the pullback zone. The target is set at the next Buy Side Liquidity or Equal Highs. In the binary version, only the direction of the next candle matters and the entry takes place immediately after the confirmation candle.
🟣 Bearish Setup
In the bearish setup, the market first forms a spiky downward move, signaling increased selling pressure and liquidity absorption at the Sell Side Liquidity zone. This movement is accompanied by a Break of Structure (BOS) to the downside and represents the beginning of a bearish momentum phase. After the spike, the price enters the Retracement phase and returns to the Bearish Order Block or bearish Fair Value Gap zone. Within these areas, the formation of a bearish confirmation candle (Bearish Engulf, Breaker, or Rejection Candle) validates the continuation of the downtrend.
The entry is taken at the close of the confirmation candle, with the stop loss placed above the Swing High or above the pullback zone, and the target set toward the next Sell Side Liquidity or Equal Lows. In binary applications, only the direction of the next candle is considered and the confirmation candle serves as the entry trigger.
🔵 Conclusion
This strategy, by combining the principles of the Smart Money Concept, Liquidity Dynamics, and Candle Confirmation Logic, offers a precise and multi functional approach to market entry. Its core structure, identifying the initial spiky movement, waiting for a structural pullback, and entering based on a confirmation candle allows quick interpretation of institutional liquidity behavior and provides trading opportunities with high accuracy and controlled risk.
On lower timeframes, this logic becomes a powerful tool for Scalping and Micro Structure Trading, while in binary markets it delivers high success rates due to its focus on predicting the next candle’s direction. Built upon the foundations of Order Flow, Market Structure, and Fractal Liquidity Behavior, this strategy demonstrates that even in the fastest and noisiest market conditions, the order of Smart Money remains observable and exploitable.
Search in scripts for "fvg"

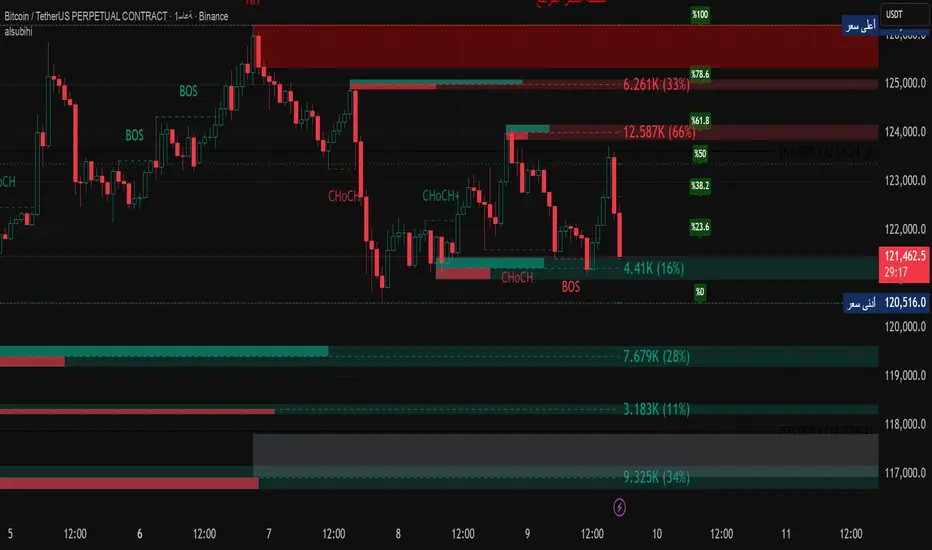
alsubihi.2Advanced Market Structure Indicator
This custom-built indicator provides an in-depth analysis of market structure changes to help traders identify key price levels, trends, and potential reversals. It combines multiple tools to give you a clearer picture of market behavior and improve your decision-making process.
Key Features:
Break of Structure (BOS):
The BOS indicator identifies significant changes in market structure, marking when the price breaks previous highs or lows, signaling a potential trend shift. Green lines represent upward breaks (bullish trend), while red lines show downward breaks (bearish trend).
Change of Character (Choch):
This feature helps to highlight subtle shifts in market dynamics. A change in character (Choch) indicates when the market transitions between bullish or bearish behavior. Green indicates a bullish character change, while red shows a bearish one.
Premium vs Discount Zones:
The indicator identifies price levels that are considered 'Premium' (high price levels) and 'Discount' (low price levels), assisting traders in recognizing overbought or oversold conditions and making better trading decisions based on market conditions.
Support and Resistance Levels:
Automatically drawn support and resistance lines are included to show critical price areas where reversals or breakouts might occur, helping traders anticipate price action.
Equilibrium Zone:
This is the price level where supply and demand balance out, acting as a key reference point for identifying potential market reversals or continuation.
Why Use This Indicator?
This all-in-one tool helps traders make informed decisions by combining multiple technical analysis concepts into a single, easy-to-use indicator. It reduces the complexity of analyzing price action and allows traders to quickly identify potential entry and exit points with greater accuracy.
Whether you are an experienced trader or just starting, this indicator provides you with the essential tools needed to identify trend shifts, key support and resistance zones, and price extremes, leading to more profitable trading decisions.
14 سبتمبر
ملاحظات الأخبار
📌 Summary of the Indicator
Market Structure (MS):
Detects swing & internal BOS, CHoCH, CHoCH+. Can color candles or bars by trend.
Multi-Timeframe Scanner (MTF):
Shows trend direction on multiple TFs (5m → 1W).
Highs/Lows (HTF):
Plots previous Day/Week/Month/Year highs & lows as liquidity levels.
Order Blocks (OB):
Draws volumetric order blocks, with filters (BOS/CHoCH), overlap rules, mitigation, and volume metrics.
Fair Value Gaps (FVG/VI/OG):
Detects price imbalances, extends them, and removes when mitigated.
Accumulation/Distribution Zones:
Highlights Wyckoff-style accumulation (green) or distribution (red).
Equal Highs/Lows (EQH/EQL):
Marks liquidity pools at equal highs or lows.
Premium/Discount Bands:
Splits swing range into premium, equilibrium, and discount zones.
RSI & ADX:
Momentum filters for overbought/oversold and trend strength.
DEMA-ATR Baseline:
Adaptive EMA with ATR constraints; alerts for trend shifts.
Regression Channel:
Auto-fits best regression length using Pearson-R, shows channel with std bands.
Fibonacci Ladder:
Auto plots levels 0.236 → 1.618 based on recent swing.
👉 In short: it’s a full SMC toolkit — structure + liquidity + OB/FVG + momentum filters + extra tools (fib, regression, ATR baseline).
📌 ملخص المؤشر
البنية الهيكلية (Market Structure):
يحدد BOS و CHoCH داخلي وسوينغ، ويقدر يلوّن الشموع حسب الاتجاه.
سكانر متعدد الأطر (MTF):
يعرض الاتجاه على عدة فريمات من 5m إلى 1W.
هاي/لو من أطر عليا (HTF Highs/Lows):
يرسم قمم وقيعان اليوم/الأسبوع/الشهر/السنة السابقة (مناطق سيولة).
بلوكات الطلب/العرض (Order Blocks):
يرسم بلوكات مع فلاتر (BOS/CHoCH)، خيارات تداخل، إزالة عند الكسر، ويعرض حجم التداول بداخلها.
الفجوات السعرية (FVG/VI/OG):
يحدد الفجوات غير المغطاة، يمددها، ويحذفها عند التغطية.
مناطق التجميع/التوزيع:
يوضح مناطق Wyckoff (أخضر للتجميع، أحمر للتوزيع).
قمم وقيعان متساوية (EQH/EQL):
يميز مناطق السيولة فوق القمم أو تحت القيعان المتساوية.
مناطق Premium/Discount/Equilibrium:
يقسم آخر نطاق إلى مناطق غالية (Premium)، توازن (Equilibrium)، ورخيصة (Discount).
RSI و ADX:
مؤشرات إضافية لقياس التشبع وقوة الاتجاه.
خط DEMA-ATR:
EMA متكيف مع قيود ATR، يتغير لونه حسب الاتجاه، مع تنبيهات جاهزة.
قناة الانحدار (Regression):
تختار أفضل طول باستخدام معامل الارتباط Pearson-R، وترسم قناة مع انحراف معياري.
فيبوناتشي (Fibonacci):
يرسم مستويات 0.236 حتى 1.618 حسب آخر حركة سعرية.
👉 باختصار: المؤشر هو أداة SMC متكاملة تجمع الهيكل، السيولة، البلوكات، الفجوات، والمؤشرات المساعدة.
MK_OSFT-Momentum Confluence DetectorMOMENTUM CONFLUENCE DETECTOR - Trading Indicator Overview
What This Indicator Does
The Momentum Confluence Detector is a comprehensive Pine Script indicator designed to identify high-probability trading opportunities by detecting momentum bars that align with multiple confluence factors. It combines traditional technical analysis with advanced Smart Money Concepts to filter out noise and highlight the most significant price movements.
CORE FUNCTIONALITY
📊 Momentum Bar Detection Identifies unusual volume and bar size expansion using customizable multipliers
Detects bullish, bearish, and neutral momentum bars based on OHLC relationships
Uses moving averages to establish baseline volume and bar size thresholds
🔄 Multi-Filter Confluence System
The indicator employs up to 5 different filter types to validate momentum signals:
Level Concept Filter - Choose between:
- Support/Resistance Levels : Traditional pivot-based S/R zones with touch counting and break tracking
- Smart Money Concepts : Institutional order flow analysis including Order Blocks, Fair Value Gaps (FVGs), and market structure breaks
Trend Filter : EMA/SMA-based trend direction confirmation with alignment requirements
Breakout Filter : Detects price breakouts beyond recent highs/lows with percentage thresholds
Volatility Filter : ATR expansion confirmation to ensure signals occur during active market conditions
Market Session Filter : Filters signals to specific trading sessions (Tokyo, London, New York)
ADVANCED FEATURES
🎯 Smart Money Concepts Integration
Order Blocks : Identifies institutional supply/demand zones from major and minor structure breaks
Fair Value Gaps (FVGs) : Detects price imbalances and tracks their evolution through partial fills and inversions
Market Structure : Recognizes Break of Structure (BOS) and Change of Character (CHoCH) patterns
Retracement Patterns : Tracks HLH (Higher-Low-Higher) and LHL (Lower-High-Lower) institutional patterns
📈 Support/Resistance System
Multi-timeframe pivot detection (3, 5, 7-bar spans)
Volume-weighted strength calculation for level importance
Dynamic level merging and break tracking
Automatic level type classification (Support/Resistance/Flip zones)
⚙️ Intelligent Filtering Logic
ALL Mode : Requires all enabled filters to pass (high precision)
ANY Mode : Requires at least one filter to pass (higher frequency)
Real-time filter status tracking and visualization
Visual Features
Signal Markers : Clear triangular markers for qualified momentum bars
Unfiltered Signals : Optional display of raw momentum bars for comparison
Level Visualization : Dynamic S/R level boxes and lines with strength indicators
Structure Lines : BOS/CHoCH break visualization with major/minor classification
Fair Value Gaps : Color-coded boxes showing bullish/bearish FVGs with partial fill tracking and IFVG conversion
Order Blocks : Institutional supply/demand zones displayed as colored boxes with major/minor classification
Information Table : Real-time display of signal details and filter status
Session Boxes : Visual representation of active trading sessions
Practical Applications
✅ Swing Trading : Identify high-probability reversal and continuation setups
✅ Day Trading : Spot intraday momentum shifts with institutional backing
✅ Multi-Timeframe Analysis : Combine major and minor structure analysis
✅ Risk Management : Filter out low-quality setups using confluence requirements
✅ Educational : Understand market structure and institutional order flow
Customization Options
Adjustable momentum thresholds for different market conditions
Comprehensive filter settings with individual enable/disable controls
Visual customization for colors, sizes, and display preferences
Alert system with detailed signal information
Performance optimization settings for different chart timeframes
Who Should Use This Indicator
This indicator is suitable for traders who:
Want to combine multiple technical analysis approaches
Seek to understand institutional market behavior
Prefer confluence-based trading setups
Need customizable filtering for different market conditions
Value comprehensive signal validation over high-frequency alerts
The Momentum Confluence Detector transforms complex market analysis into clear, actionable signals by requiring multiple forms of confirmation before highlighting trading opportunities.

ICT 369 Sniper MSS Indicator (HTF Bias) - H2LThis script is an ICT (Inner Circle Trader) concept-based trading indicator designed to identify high-probability reversal or continuation setups, primarily focusing on intraday trading using a Higher Timeframe (HTF) directional bias.
Here are the four core components of the indicator:
Higher Timeframe (HTF) Bias Filter (Market Structure Shift - MSS): It determines the overall trend by checking if the current price has broken the most recent high or low swing point of a larger timeframe (e.g., 4H). This establishes a Bullish or Bearish bias, ensuring trades align with the dominant trend.
Fair Value Gap (FVG) and OTE: It identifies price imbalances (FVGs) and calculates the Optimal Trade Entry (OTE) levels (50%, 62%, 70.5%, etc.) within those gaps, looking for price to retrace into these specific areas.
Kill Zones (Timing): It incorporates specific time windows (London and New York Kill Zones, based on NY Time) where institutional trading activity is high, only allowing entry signals during these defined periods.
Signal and Targets: It triggers a Long or Short signal when all criteria are met (HTF Bias, FVG, OTE retracement, and Kill Zone timing). It then calculates and plots suggested trade levels, including a Stop Loss (SL) and three Take Profit targets (TP1, TP2, and a dynamic Runner Target based on the weekly Average True Range or ATR).
In summary, it's a comprehensive tool for traders following ICT principles, automating the confluence check across trend, structure, liquidity, and timing.

SMC style josh )SMC style josh — FVG, OB, BOS/CHoCH, EQH/EQL, PD, HTF, Trendlines
What it does
A clean-room Smart-Money–style study that visualizes market structure and liquidity concepts:
Structure: BOS & CHoCH for swing and internal legs (width/style controls, preview of last pivots)
Order Blocks: internal & swing OBs with midline (50%), mitigated/invalid handling, optional auto Breaker creation
Fair Value Gaps (FVG): auto boxes with optional 50% line, ATR filter, extend length, and “after-CHoCH only” window
Equal High/Low (EQH/EQL): ATR-based proximity threshold
Liquidity Grabs: wick-through/close-back tags
Premium/Discount (PD) zones: live boxes + equilibrium line from latest swing range
HTF levels: previous Daily/Weekly/Monthly highs/lows with labels (PDH/PDL, PWH/PWL, PMH/PML)
Trendlines: auto swing-to-swing lines (liquidity)
Confluence Score: column plot summarizing recent events (+/− weighting)
Key options
Safety switch to pause all drawings
Per-module visibility, label sizes/colors, line styles/widths
ATR-based filters for impulses and gaps
Limits for lines/labels/boxes to avoid runtime errors
How to read
BOS = continuation break of the current leg; CHoCH = potential regime shift
OB mitigated when price returns into the block; invalid when price closes beyond; mitigated-then-invalid can form a Breaker
FVG is considered “filled” when price closes through the gap boundary (optional hide/gray-out)
Strong/Weak High/Low tags reflect the active swing bias (potential liquidity/targets)
Good practice
Combine with risk management, multiple timeframes, and your own rules. All drawings are for study/visualization; signals are not trade instructions.
Compliance / Disclaimer
This script is for educational and research purposes only. It is not financial advice or a solicitation to buy/sell any asset. Past performance does not guarantee future results. Always test and manage risk responsibly.
License / Credits
Built with Pine Script® v5. “SMC style josh” is an original, clean-room implementation and does not reuse third-party code.
The Best Strategy Template[LuciTech]Hello Traders,
This is a powerful and flexible strategy template designed to help you create, backtest, and deploy your own custom trading strategies. This template is not a ready-to-use strategy but a framework that simplifies the development process by providing a wide range of pre-built features and functionalities.
What It Does
The LuciTech Strategy Template provides a robust foundation for building your own automated trading strategies. It includes a comprehensive set of features that are essential for any serious trading strategy, allowing you to focus on your unique trading logic without having to code everything from scratch.
Key Features
The LuciTech Strategy Template integrates several powerful features to enhance your strategy development:
•
Advanced Risk Management: This includes robust controls for defining your Risk Percentage per Trade, setting a precise Risk-to-Reward Ratio, and implementing an intelligent Breakeven Stop-Loss mechanism that automatically adjusts your stop to the entry price once a specified profit threshold is reached. These elements are crucial for capital preservation and consistent profitability.
•
Flexible Stop-Loss Options: The template offers adaptable stop-loss calculation methods, allowing you to choose between ATR-Based Stop-Loss, which dynamically adjusts to market volatility, and Candle-Based Stop-Loss, which uses structural price points from previous candles. This flexibility ensures the stop-loss strategy aligns with diverse trading styles.
•
Time-Based Filtering: Optimize your strategy's performance by restricting trading activity to specific hours of the day. This feature allows you to avoid unfavorable market conditions or focus on periods of higher liquidity and volatility relevant to your strategy.
•
Customizable Webhook Alerts: Stay informed with advanced notification capabilities. The template supports sending detailed webhook alerts in various JSON formats (Standard, Telegram, Concise Telegram) to external platforms, facilitating real-time monitoring and potential integration with automated trading systems.
•
Comprehensive Visual Customization: Enhance your analytical clarity with extensive visual options. You can customize the colors of entry, stop-loss, and take-profit lines, and effectively visualize market inefficiencies by displaying and customizing Fair Value Gap (FVG) boxes directly on your chart.
How It Does It
The LuciTech Strategy Template is meticulously crafted using Pine Script, TradingView's powerful and expressive programming language. The underlying architecture is designed for clarity and modularity, allowing for straightforward integration of your unique trading signals. At its core, the template operates by taking user-defined entry and exit conditions and then applying a sophisticated layer of risk management, position sizing, and trade execution logic.
For instance, when a longCondition or shortCondition is met, the template dynamically calculates the appropriate position size. This calculation is based on your specified risk_percent of equity and the stop_distance (the distance between your entry price and the calculated stop-loss level). This ensures that each trade adheres to your predefined risk parameters, a critical component of disciplined trading.
The flexibility in stop-loss calculation is achieved through a switch statement that evaluates the sl_type input. Whether you choose an ATR-based stop, which adapts to market volatility, or a candle-based stop, which uses structural price points, the template seamlessly integrates these methods. The ATR calculation itself is further refined by allowing various smoothing methods (RMA, SMA, EMA, WMA), providing granular control over how volatility is measured.
Time-based filtering is implemented by comparing the current bar's time with user-defined start_hour, start_minute, end_hour, and end_minute inputs. This allows the strategy to activate or deactivate trading during specific market sessions or periods of the day, a valuable tool for optimizing performance and avoiding unfavorable conditions.
Furthermore, the template incorporates advanced webhook alert functionality. When a trade is executed, a customizable JSON message is formatted based on your webhook_format selection (Standard, Telegram, or Concise Telegram) and sent via alert function. This enables seamless integration with external services for real-time notifications or even automated trade execution through third-party platforms.
Visual feedback is paramount for understanding strategy behavior. The template utilizes plot and fill functions to clearly display entry prices, stop-loss levels, and take-profit targets directly on the chart. Customizable colors for these elements, along with dedicated options for Fair Value Gap (FVG) boxes, enhance the visual analysis during backtesting and live trading, making it easier to interpret the strategy's actions.
How It's Original
The LuciTech Strategy Template distinguishes itself in the crowded landscape of TradingView scripts through its unique combination of integrated, advanced risk management features, highly flexible stop-loss methodologies, and sophisticated alerting capabilities, all within a user-friendly and modular framework. While many templates offer basic entry/exit signal integration, LuciTech goes several steps further by providing a robust, ready-to-use infrastructure for managing the entire trade lifecycle once a signal is generated.
Unlike templates that might require users to piece together various risk management components or code complex stop-loss logic from scratch, LuciTech offers these critical functionalities out-of-the-box. The inclusion of dynamic position sizing based on a user-defined risk percentage, a configurable risk-to-reward ratio, and an intelligent breakeven mechanism significantly elevates its utility. This comprehensive approach to capital preservation and profit targeting is a cornerstone of professional trading and is often overlooked or simplified in generic templates.
Furthermore, the template's provision for multiple stop-loss calculation types—ATR-based for volatility adaptation, and candle-based for structural support/resistance—demonstrates a deep understanding of diverse trading strategies. The underlying code for these calculations is already implemented, saving developers considerable time and effort. The subtle yet powerful inclusion of FVG (Fair Value Gap) related inputs also hints at advanced price action concepts, offering a sophisticated layer of analysis and execution that is not commonly found in general-purpose templates.
The advanced webhook alerting system, with its support for various JSON formats tailored for platforms like Telegram, showcases an originality in catering to the needs of modern, automated trading setups. This moves beyond simple TradingView pop-up alerts, enabling seamless integration with external systems for real-time trade monitoring and execution. This level of external connectivity and customizable data output is a significant differentiator.
In essence, the LuciTech Strategy Template is original not just in its individual features, but in how these features are cohesively integrated to form a powerful, opinionated, yet highly adaptable system. It empowers traders to focus their creative energy on developing their core entry/exit signals, confident that the underlying framework will handle the complexities of risk management, trade execution, and external communication with precision and flexibility. It's a comprehensive solution designed to accelerate the development of robust and professional trading strategies.
How to Modify the Logic to Apply Your Strategy
The LuciTech Strategy Template is designed with modularity in mind, making it exceptionally straightforward to integrate your unique trading strategy logic. The template provides a clear separation between the core strategy management (risk, position sizing, exits) and the entry signal generation. This allows you to easily plug in your own buy and sell conditions without altering the robust underlying framework.
Here’s a step-by-step guide on how to adapt the template to your specific trading strategy:
1.
Locate the Strategy Logic Section:
Open the Pine Script editor in TradingView and navigate to the section clearly marked with the comment //Strategy Logic Example:. This is where the template’s placeholder entry conditions (a simple moving average crossover) are defined.
2.
Define Your Custom Entry Conditions:
Within this section, you will find variables such as longCondition and shortCondition. These are boolean variables that determine when a long or short trade should be initiated. Replace the existing example logic with your own custom buy and sell conditions. Your conditions can be based on any combination of indicators, price action patterns, candlestick formations, or other market analysis techniques. For example, if your strategy involves a combination of RSI and MACD, you would define longCondition as (rsi > 50 and macd_line > signal_line) and shortCondition as (rsi < 50 and macd_line < signal_line).
3.
Leverage the Template’s Built-in Features:
Once your longCondition and shortCondition are defined, the rest of the template automatically takes over. The integrated risk management module will calculate the appropriate position size based on your Risk % input and the chosen Stop Loss Type. The Risk:Reward ratio will determine your take-profit levels, and the Breakeven at R feature will manage your stop-loss dynamically. The time filter (Use Time Filter) will ensure your trades only occur within your specified hours, and the webhook alerts will notify you of trade executions.

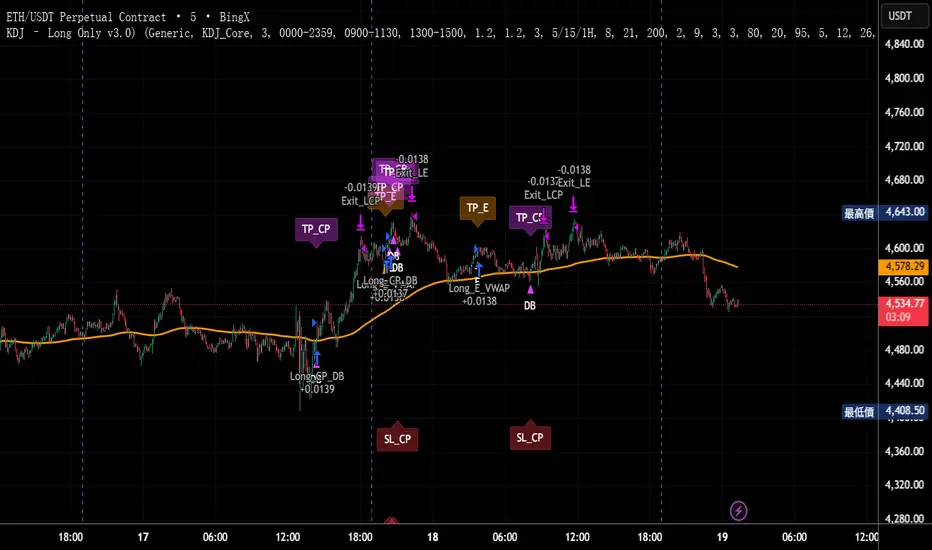
KDJ – Long Only v3.0 (TradingView Strategy)
Overview|概覽
EN
A research strategy that automates long-only entries using a KDJ-centric core with multi-layer confirmations and volatility-aware exits. Default preset targets ETH 5m; other symbols/timeframes can be tuned.
中文
研究用策略,透過 KDJ 核心與多層確認來自動化只做多進場,並以隨波動調整的出場邏輯運作。預設為 ETH 5 分鐘;其他商品/週期可自行調參。
Backtest (hypothetical) example: ETHUSDT.P, 5m, 2024-09-18→2025-09-18, fee 0.05%, slippage 1 tick.(僅示意,屬假設性回測)
What it does|做什麼
EN
Signals are organized into channels:
A KDJ trend core
B OB/FVG touch pullback
CP Double-bottom (buffered neckline)
SR Support/Resistance bounce with rejection/zone checks
D EMA pullback (long EMA length)
E VWAP reclaim (lower-band pierce & recapture)
F Prior-low sweep & reclaim
中文
訊號分成多通道:
A KDJ 順勢核心
B OB/FVG 回踩觸價
CP 雙底(頸線含緩衝)
SR 支撐/阻力觸價不破(含拒絕與區域檢查)
D EMA 回踩(長週期 EMA)
E VWAP 收復(下緣穿越後收回)
F 前低掃回
High-level logic|高層級原理
HTF/Mid-TF context:內建 5/15/1H 或 15/60/4H 組合;以簡化趨勢線/區域提供觸價參考
Trend & structure:本階 EMA(8/21/200) 結構;Structure Breakout(近期高低點 ±ATR 緩衝)/EMA8/21 回踩
Momentum/volume:MACD、KDJ 金叉與低區偵測、量能驗證
Regime:ADX 閘(趨勢/盤整門檻)、EMA 帶寬過濾震盪、Peak Guard 避免過度延伸
No look-ahead:入場不使用前視;樞紐/趨勢線僅作情境參考
Inputs & Features|參數與功能
Market Preset:Generic / ETH(ETH 預設收緊若干門檻,開箱即用)
Entry Mode:KDJ_Core / CandleOnly / KDJ_and_Candle
Session Filter:最多三段交易時窗
Lite Filters:過度延伸、實體大小、DI 差距
S/R 模組:拒絕條件、KDJ 覆核、區域要求、即時 R:R 檢核
OrderBlock/FVG:近棒位移掃描
Chart Pattern:雙底 W,ATR 容差與頸線緩衝
Plotting:EMA200、通道字母標記、可選 TP/SL 標籤
Automation via Alerts(generic)|快訊自動化(通用)
EN
On entries/exits the strategy emits JSON through alert_message. Create alerts with “Any alert() function call” and route them to your own webhook/bridge. Symbol mapping, sizing mode, and user info are configurable in inputs.
中文
進出場時透過 alert_message 輸出 JSON。建立快訊時選 “Any alert() function call”,再由你的 webhook/橋接服務轉單;輸入面板可設定商品代碼、下單型式與使用者資訊。
提示:調整參數後,請重建快訊,並將訊息欄設為 {{strategy.order.alert_message}}。
Position sizing|部位大小
base / quote / percent_local / percent(percent_local 以本地 USD 估值計算)
可選「按數量模式」以便與本地部位同步(position_size sync)
Risk & Exits|風險與出場
SL:ATR / Swing / ATR_or_Swing;TP Cap 以 ATR 或 % 限制上限
Breakeven & Trailing:達指定 R:R 啟動保本;之後以 最高價回看 − ATR×k 追蹤
Same-bar exits:可允許/禁止同根觸發 TP/SL
Pyramiding:pyramiding=2,最多兩筆多單可同時存在(淨倉交易所請留意整體倉位的平倉行為)
Suggested workflow|建議流程
回測目標市場/週期 → 設定時段/濾網與門檻 → 微調 TP/SL 與部位大小 → 建立快訊({{strategy.order.alert_message}})→ 監看執行日誌
Notes & Disclaimer|注意與免責
回測結果仰賴時間框解析與成交規則;棒內路徑與實盤可能不同
僅供研究/教育;非投資建議
本頁無廣告、無外部連結或聯絡資訊
Release Notes|版本說明
2025-09-19
新增:One-shot Force Flat(一鍵清倉僅一次)— 於下一根收盤執行,完成後自動失效
Webhook:進/出場皆輸出 JSON;提醒更新參數後重建快訊
行為澄清:pyramiding=2,允許同圖表最多兩筆多單並存;同棒出場可設定
2025-09-18
Netted venue 說明:在淨倉模式下,出場會影響同商品的整體淨多倉;請留意手動單與策略單的互動
2025-08-28
修正小數顯示;預設優化(ETH/5m);保留隨波動的 RR/SL 邏輯
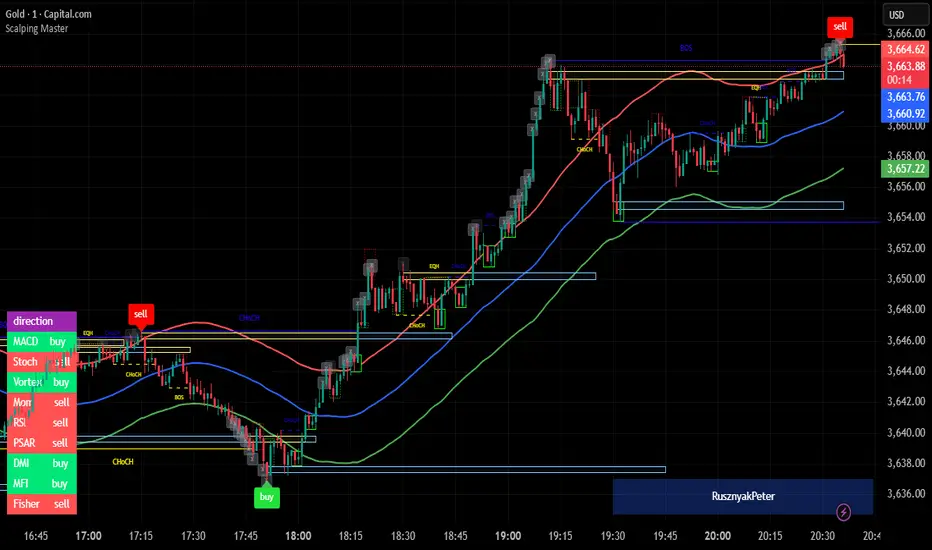
Scalping MasterMarket Structure Analysis:
Swing Structure: Detects higher highs (HH), lower highs (LH), higher lows (HL), aur lower lows (LL) ko identify karta hai using pivot points (based on ta.highest aur ta.lowest).
Internal Structure: Chhote timeframes ke liye internal swing points aur break of structure (BOS)/change of character (CHoCH) ko track karta hai.
BOS/CHoCH Detection: Bullish aur bearish structure breaks (BOS) aur trend reversals (CHoCH) ko label karta hai.
Order Blocks (OB):
Internal Order Blocks: Chhote timeframe ke order blocks ko plot karta hai, jo liquidity zones ko represent karte hain.
Swing Order Blocks: Bade timeframe ke order blocks ko show karta hai.
Filtering: ATR ya Cumulative Mean Range ke basis par volatile order blocks ko filter karta hai.
Fair Value Gaps (FVG):
Price gaps (bullish aur bearish) ko detect aur plot karta hai.
Auto-threshold aur timeframe customization ke saath FVGs ko filter karta hai.
FVGs ko extend karne ka option deta hai (visual representation ke liye).
Equal Highs/Lows (EQH/EQL):
Equal highs aur lows ko identify karta hai, jo support/resistance zones ke liye useful hote hain.
Bars confirmation aur sensitivity threshold ke saath customizable hai.
Previous Highs/Lows (MTF):
Daily, weekly, aur monthly high/low levels ko plot karta hai.
Line style (solid, dashed, dotted) aur colors customizable hain.
Premium/Discount Zones:
Market ke premium, equilibrium, aur discount zones ko highlight karta hai, jo price action ke liye key areas hote hain.
Visual Customization:
Color Themes: Colored ya monochrome themes ke options.
Candle Coloring: Trend ke hisaab se candles ko color karta hai.
Labels aur Lines: Swing points, strong/weak highs/lows, aur structure breaks ke liye labels aur lines plot karta hai.
Modes:
Historical Mode: Past data ke saath complete structure dikhata hai.
Present Mode: Sirf recent structure aur signals dikhata hai, clutter reduce karne ke liye.
Alerts:
Bullish/Bearish BOS, CHoCH, order block breaks, aur EQH/EQL ke liye alerts set karne ka option.
Swing Points aur Trailing:
Strong/weak high aur low points ko track karta hai.
Trailing maximum/minimum ko extend karta hai for real-time analysis.
Kya Kya Mila Kar Bana Hai?
Yeh indicator Smart Money Concepts ke core principles par based hai aur in elements ko combine karta hai:
Pivot Point Analysis:
ta.highest aur ta.lowest functions se swing highs/lows detect karta hai.
Internal aur swing structure ke liye alag-alag lengths (e.g., length aur 5 for internal swings).
Price Action Concepts:
Break of Structure (BOS): Jab price pivot high/low ko break karta hai.
Change of Character (CHoCH): Jab trend reverse hota hai.
Confluence filtering ke saath accuracy improve karta hai.
Order Blocks:
Liquidity zones ko identify karne ke liye high/low ranges aur ATR/cumulative mean range ka use.
Bullish aur bearish order blocks ke liye customizable colors.
Fair Value Gaps:
Gaps in price action ko detect karne ke liye OHLC data ka analysis.
Timeframe aur auto-threshold ke saath flexibility.
MTF (Multi-Timeframe) Analysis:
Daily, weekly, monthly high/low levels ke liye ta.valuewhen aur time-based calculations.
Zones Detection:
Premium, equilibrium, aur discount zones ke liye price range calculations.
Visual Tools:
Lines, labels, aur boxes ke saath market structure ko visually represent karta hai (line.new, label.new, box.new).
Extendable lines aur boxes for better visibility.
User Inputs:
Customizable settings jaise timeframe, colors, lengths, aur filters, jo user ko flexibility dete hain.
Technical Components
PineScript Functions: ta.crossover, ta.crossunder, ta.highest, ta.lowest, ta.atr, ta.cum for calculations.
Arrays: Order blocks ke coordinates store karne ke liye (array.new_float, array.new_int, array.new_box).
Drawing Tools: Lines, labels, aur boxes ke saath dynamic plotting.
Conditional Logic: BOS, CHoCH, aur other signals ke liye complex conditions.
Timeframe Support: Multi-timeframe analysis ke liye input.timeframe.
Iani SMC Sniper XAU v2.2 (Long+Short + News Countdown, v6)Iani SMC Sniper XAU (v2.2) — smart-money logic for XAUUSD.
This indicator hunts “sniper entries” using a simple SMC sequence:
Sweep → BOS → 50% FVG entry
• After London session builds its range, we wait for a liquidity sweep (price dips below London Low for longs / wicks above London High for shorts).
• A BOS confirms direction (close breaks the last swing).
• First FVG that prints after BOS gives the entry at 50% (mid-gap).
• SL anchored to the protective swing (with a small safety buffer). TP is plotted using your Risk:Reward.
News countdown (non-blocking):
The script does not auto-fetch news; you set daily times (e.g., 14:30, 16:00) and/or specific dates (“YYYY-MM-DD HH:MM”). A countdown label shows “NEWS in Xm”. Signals are not blocked—this is just a safety heads-up for prop-firm rules.
Inputs: pivot length, RR, pip size (XAU default 0.10), session filter (after London), news times (recurring & absolute), show/hide levels & labels.
Plots & labels: London High/Low (daily), Entry/SL/TP lines, BOS/Sweep/BUY/SELL markers, news badge.
Alerts: BOS Bull/Bear, BUY/SELL Entry touch, TP/SL hit, NEWS WARNING.
Notes:
• Designed for XAUUSD intraday; works on other symbols if you adjust pip size.
• Uses symbol timezone; adjust your news times for DST if needed.
• Indicator only—no orders, no backtest. Manage risk and execution in MT5/your platform.
Changelog (v2.2): Pine v6, robust time parsing, one-line logical expressions (fixed EOL errors), mirrored short logic, cleaner London H/L reset, countdown label.
Disclaimer: Educational tool, not financial advice. Past performance ≠ future results.
Tags: SMC, ICT, XAUUSD, Gold, Liquidity Sweep, BOS, FVG, London Session, News, Intraday, Scalping, DayTrading.

[DEM] Fair Value Gaps Fair Value Gaps is designed to identify and visualize institutional Fair Value Gaps (FVGs) on the price chart by detecting three-candle patterns where a significant price gap exists between non-adjacent candles, indicating areas where price moved too quickly and left behind unfilled liquidity zones. The indicator identifies bullish FVGs when the current low exceeds the high from two bars ago by more than a configurable ATR multiplier (default 1.1), and bearish FVGs when the low from two bars ago exceeds the current high by the same threshold, ensuring only significant gaps are marked. When detected, the indicator draws semi-transparent boxes around the gap areas with midline references, colors the chart background green for bullish gaps and red for bearish gaps, and maintains these visual markers as potential support/resistance levels where institutional traders may look to fill orders, helping traders identify key price levels where future reversals or continuations might occur.

Big Candle Trend█ OVERVIEW
The "Big Candle Trend" indicator is a technical analysis tool written in Pine Script® v6 that identifies large signal candles on the chart and determines the trend direction based on the analysis of all candles within a specified period. Designed for traders seeking a simple yet effective tool to identify key market movements and trends, the indicator provides clarity and precision through flexible settings, trend line visualization, and retracement lines on signal candles.
█ CONCEPTS
The goal of the "Big Candle Trend" indicator was to create a tool based solely on the size of candle bodies and their relative positions, making it universal and effective across all markets (stocks, forex, cryptocurrencies) and timeframes. Unlike traditional indicators that often rely on complex formulas or external data (e.g., volume), this indicator uses simple yet powerful price action logic. Large signal candles are identified by comparing their body size to the average body size over a selected period, and the trend is determined by analyzing price changes over a longer period relative to the average candle body size. Additionally, the indicator draws horizontal lines on signal candles, aiding in setting Stop Loss levels or delayed entries.
█ FEATURES
Large Signal Candle Detection: Identifies candles with a body larger than the average body multiplied by a user-defined multiplier, aligned with the trend (if the trend filter is enabled). Signals are displayed as triangles (green for bullish, red for bearish).
Trend Analysis: Determines the trend (uptrend, downtrend, or neutral) by comparing the price change over a selected period (trend_length) to the average candle body size multiplied by a trend strength multiplier. The trend starts when:
Uptrend: The price change (difference between the current close and the close from an earlier period) is positive and exceeds the average candle body size multiplied by the trend strength multiplier (avg_body_trend * trend_mult).
Downtrend: The price change is negative and exceeds, in absolute value, the average candle body size multiplied by the trend strength multiplier.
Neutral Trend: The price change is below the required threshold, indicating no clear market direction.The trend ends when the price change no longer meets the conditions for an uptrend or downtrend, transitioning to a neutral state or switching to the opposite trend when the price change reverses and meets the conditions for the new trend. This approach differs from standard methods as it focuses on price dynamics in the context of candle body size, offering a more intuitive and direct way to gauge trend strength.
Smoothed Trend Line: Displays a trend line based on the average price (HL2, i.e., the average of the high and low of a candle), smoothed using a user-defined smoothing parameter. The trend line reflects the market direction but is not tied to breakouts, unlike many other trend indicators, allowing for more flexible interpretation.
Retracement Lines: Draws horizontal lines on signal candles at a user-defined level (e.g., 0.618). The lines are displayed to the right of the candle, with a width of one candle. For bullish candles, the line is measured from the top of the body (close) downward, and for bearish candles, from the bottom of the body (close) upward, aiding in setting Stop Loss or delayed entries.
Trend Option: Option to enable a trend filter that limits large candle signals to those aligned with the current trend, enhancing signal precision.
Customizable Visualization: Allows customization of colors for uptrend, downtrend, and neutral states, trend line style, and shadow fill between the trend line and price.
Alerts: Built-in alerts for large signal candles (bullish and bearish) and trend changes (start of uptrend, downtrend, or neutral trend).
█ HOW TO USE
Add to Chart: Apply the indicator to your TradingView chart via the Pine Editor or Indicators menu.
Configure Settings:
Candle Settings:
Average Period (Candles): Sets the period for calculating the average candle body size.
Large Candle Multiplier: Multiplier determining how large a candle’s body must be to be considered "large".
Trend Settings:
Trend Period: Period for analyzing price changes to determine the trend.
Trend Strength Multiplier: Multiplier setting the minimum price change required to identify a significant trend.
Trend Line Smoothing: Degree of smoothing for the trend line.
Show Trend Line: Enables/disables the display of the trend line.
Apply Trend Filter: Limits large candle signals to those aligned with the current trend.
Trend Colors:
Customize colors for uptrend (green), downtrend (red), and neutral (gray) states, and enable/disable shadow fill.
Retracement Settings:
Retracement Level (0.0-1.0): Sets the level for lines on signal candles (e.g., 0.618).
Line Width: Sets the thickness of retracement lines.
Interpreting Signals:
Bullish Signal: A green triangle below the candle indicates a large bullish candle aligned with an uptrend (if the trend filter is enabled). A horizontal line is drawn to the right of the candle at the retracement level, measured from the top of the body downward.
Bearish Signal: A red triangle above the candle indicates a large bearish candle aligned with a downtrend (if the trend filter is enabled). A horizontal line is drawn to the right of the candle at the retracement level, measured from the bottom of the body upward.
rend Line: Shows the market direction (green for uptrend, red for downtrend, gray for neutral). Unlike many indicators, the trend line’s color is not tied to its breakout, allowing for more flexible interpretation of market dynamics.
Alerts: Set up alerts in TradingView for large signal candles or trend changes to receive real-time notifications.
Combining with Other Tools: Use the indicator alongside other technical analysis tools, such as support/resistance levels, RSI, moving averages, or Fair Value Gaps (FVG), to confirm signals.
█ APPLICATIONS
Price Action Trading: Large signal candles can indicate key market moments, such as breakouts of support/resistance levels or strong price rejections. Use signal candles in conjunction with support/resistance levels or FVG to identify entry opportunities. Retracement lines help set Stop Loss levels (e.g., below the line for bullish candles, above for bearish) or delayed entries after price returns to the retracement level and confirms trend continuation. Note that large candles often generate Fair Value Gaps (FVG), which should be considered when setting Stop Loss levels.
Trend Strategies: Enable the trend filter to limit signals to those aligned with the dominant market direction. For example, in an uptrend, look for large bullish candles as continuation signals. The indicator can also be used for position pyramiding, adding positions as subsequent large candles confirm trend continuation.
Practical Approach:
Large candles with high volume may indicate strong market participation, increasing signal reliability.
The trend line helps visually assess market direction and confirm large candle signals.
Retracement lines on signal candles aid in identifying key levels for Stop Loss or delayed entries.
█ NOTES
The indicator works across all markets and timeframes due to its universal logic based on candle body size and relative positioning.
Adjust settings (e.g., trend period, large candle multiplier, retracement level) to suit your trading style and timeframe.
Test the indicator on various markets (stocks, forex, cryptocurrencies) and timeframes to optimize its performance.
Use in conjunction with other technical analysis tools to enhance signal accuracy.

Raid & Imbalance Suite (ICT-inspired)**What it is**
Raid & Imbalance Suite is an invite-only indicator that visualizes liquidity raids and fair-value-gap (FVG) context directly on the chart. It is inspired by ICT concepts but is an independent implementation (not affiliated with ICT).
**What it shows**
• Liquidity raid highlights (sweeps)
• FVG / imbalance context overlays
• Light session / structure context for additional clarity
• Intentional minimalism — internal thresholds/logic are not disclosed
**How to use**
• Works on most symbols and timeframes supported by TradingView indicators
• Use as chart context alongside your own plan and risk management
• This tool does not place trades, generate signals, or guarantee outcomes
**Inputs & Alerts**
• Toggles for raids / FVG / sessions
• Basic visual settings
• Optional alerts for newly detected events
**Access**
This is an **invite-only** script. Request access via TradingView messages (username: @ASevilla28). Access is granted manually to approved users.
**Disclaimer**
For educational/charting purposes only. Not financial advice. No performance guarantees. Markets involve risk. Use at your own discretion.
*(The author is not affiliated with or endorsed by any third party referenced by “ICT-inspired”.)*

NIFTY_2min_FVG_Buy_StrategySummary
This strategy is designed for scalping Nifty on a 2-minute chart, focusing exclusively on long entries. The script's purpose is to identify and act on specific bullish reversal patterns based on volume analysis and price action.
Concept & Core Logic
The strategy operates on a two-stage confirmation process:
Volume Absorption: The initial condition seeks to identify potential bullish reversals by detecting signs of selling pressure being absorbed by buyers. This suggests that a downward move may be losing momentum.
Fair Value Gap (FVG) Confirmation: After a volume absorption signal, the strategy waits for a Fair Value Gap (FVG) to appear. A long entry signal is generated only after a candle closes above the FVG zone, serving as confirmation of bullish intent.
Risk Management
The strategy employs a fixed take profit and stop loss for each trade, based on the Nifty underlying price:
Take Profit: The exit signal is triggered when a trade reaches a 25-point profit.
Stop Loss: The exit signal is triggered when a trade reaches a 30-point loss.
Intended Use
This tool is intended for traders who:
Utilize mechanical, rule-based systems for intraday trading and scalping.
Are interested in studying a structured approach that combines volume analysis with price action inefficiencies like Fair Value Gaps.

Unfilled ImbalancesUNFILLED IMBALANCES TRACKER - IDENTIFY HIGH-PROBABILITY REVERSAL ZONES
This advanced indicator automatically detects and tracks unfilled price imbalances (Fair Value Gaps/FVGs) between candle bodies, providing traders with crucial levels where price is likely to return.
METHODOLOGY
This indicator employs an approach to imbalance detection that differs from standard FVG indicators:
1. Body-to-Body Gap Detection: Unlike typical FVG indicators that use wicks, this system exclusively tracks gaps between candle bodies, filtering out noise and focusing on the most significant price inefficiencies.
2. Dynamic Partial Fill Tracking: Our unique algorithm continuously monitors and adjusts imbalance zones as they're partially filled, showing exactly how much of each gap remains unfilled in real-time. This feature helps traders identify the strongest remaining levels.
3. Dual Fill Detection Logic: Proprietary fill detection offers two distinct modes - Distal (gap filled when touched) and Through (requires complete price movement through the entire gap), allowing adaptation to different market behaviors.
KEY FEATURES
Real-Time Imbalance Detection
Identifies body-to-body gaps between consecutive candles
Tracks both bullish and bearish imbalances
Automatically removes filled imbalances from the chart
Advanced Fill Detection Modes
Distal Mode: Imbalance considered filled when price touches the near edge
Through Mode: Requires price to completely trade through the gap
Body Fill Option: Requires candle body (not just wick) to enter the gap zone
Partial Fill Visualization
Watch imbalances shrink in real-time as price partially fills them
Visual representation shows exact percentage of gap remaining
Critical for position sizing and risk management
Flexible Display Options
Full Box Mode: Shows complete imbalance zones
Line Mode: Displays only critical edge levels for cleaner charts
Customizable visual parameters (colors, transparency, line thickness)
Smart Extension Features
Auto-extends visual elements to current price bar
Optional extension into future (0-500 bars)
Statistics table showing active imbalances count and fill rates
TRADING METHODOLOGY
Unfilled imbalances represent areas where price moved too quickly, leaving behind inefficiencies that markets tend to revisit. This indicator helps identify:
High-probability entry zones for trend continuation trades
Logical take profit targets at unfilled gaps
Stop loss placement beyond strong imbalance zones
Market structure breaks when key imbalances are filled
Supply and demand zone identification
HOW TO USE
Apply the indicator to any timeframe (works best on 15m and above)
Configure fill detection mode based on your trading style
Watch for price approaching unfilled imbalance zones
Use partial fill information to gauge zone strength
Combine with your existing strategy for confirmation
TARGET AUDIENCE & BEST PRACTICES
This tool is designed for traders who understand price action and market structure. It works best on:
Liquid instruments with consistent volume
Trending markets where imbalances are more likely to be revisited
Higher timeframes for more reliable signals
LIMITATIONS & CONSIDERATIONS
Imbalances may not always be filled, especially in strong trending markets
Performance varies across different market conditions and instruments
Should be used in conjunction with other analysis methods, not as a standalone system
Gap detection is based on candle closes and may miss intrabar movements
Historical imbalances from many bars ago may lose relevance
SETTINGS EXPLANATION
The indicator includes multiple customization options:
Require Body Fill: Controls whether wicks or bodies must enter gaps
Fill Detection Mode: Choose between Distal or Through modes
Visual Display: Select between boxes or lines
Alert Configuration: Set minimum age before fill alerts trigger
Debug Mode: Learn how the algorithm works with visual feedback
This indicator represents months of research into price inefficiency patterns and provides a systematic approach to identifying and tracking these critical market levels.
Note: Works on all timeframes and markets. Best results on liquid instruments with consistent volume patterns.

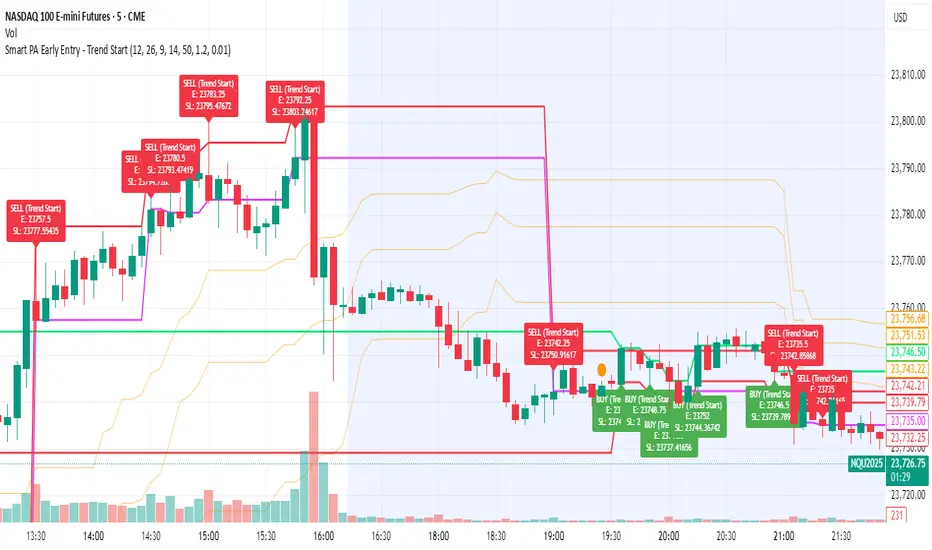
Smart PA Early Entry - Trend StartSmart PA Early Entry Indicator (MACD + FVG + Fibonacci)
This TradingView indicator helps traders spot potential trend reversals early by combining multiple technical tools:
MACD Momentum – Identifies the direction of the trend.
Volume Filter – Confirms strong market participation for reliable signals.
Fair Value Gaps (FVG) – Highlights areas where price may reverse or continue strongly.
Fibonacci Retracement Levels – Pinpoints key support/resistance zones for early entries.
ATR-based Stop Loss – Automatically calculates a dynamic stop-loss based on market volatility.
Trend Start Signals – Alerts only appear on the first candle of a potential trend change to avoid repeated signals.
Visual Labels & Plots – Shows entry price, stop-loss, FVG zones, and Fibonacci levels for easy chart reading.
Ideal for: Intraday and swing traders looking for high-probability entries near trend reversals with clear risk management.
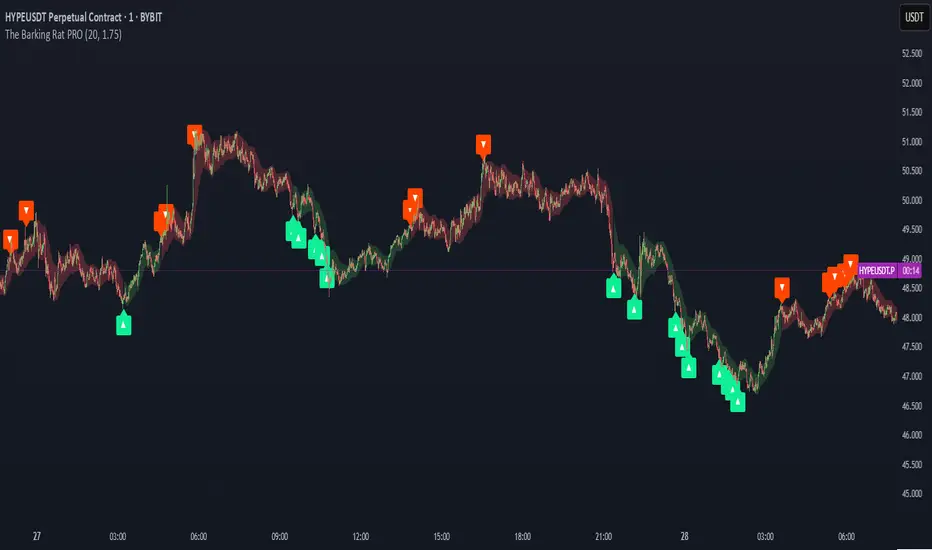
The Barking Rat PROThe Barking Rat PRO is designed around high/low pivot structure to capture meaningful market reversals. It intelligently identifies turning points by combining higher high/lower low (HH/LL) pivot detection, Fair Value Gap (FVG) confirmation, volatility-aware filters, and momentum checks. Unique features, such as a one-bar flip handler and a contextual ribbon overlay, provide traders with both clarity and precision. These tools help isolate high-probability setups while filtering out low-conviction signals, making trade opportunities easier to spot and act upon.
🧠 Core Logic: Structure-First, Filtered Reversals
The strategy takes a methodical, disciplined approach, prioritizing structural pivots over random signals. By layering multiple validation checks—structural pivots, gap confirmation, volatility filters, and momentum alignment—it highlights trades with high conviction while reducing exposure to noisy market conditions. The result is a clear, repeatable framework for reversal trading that can be applied across timeframes.
HH/LL Pivot Framework
Trades are triggered based on simple structural pivots: higher highs (HH) and lower lows (LL). When a structure flip occurs, the strategy either opens a new position or executes a one-bar delayed flip if an opposing position already exists. This ensures smooth transitions and avoids premature entries on minor market swings, keeping trading decisions focused on meaningful trend shifts.
Volatility & Distance Filters
To avoid low-quality trades, entries are validated against relative volatility, ensuring that pivots represent significant market movement. Trades must also be sufficiently spaced from previous entries and separated by a minimum number of bars, which prevents overtrading and clustered signals that can dilute performance.
Momentum Filter (RSI)
The strategy optionally aligns entries with momentum conditions using RSI. Long trades are favored when RSI is relatively low, suggesting potential exhaustion on the downside, while short trades are favored when RSI is relatively high, indicating potential overextension on the upside. This additional layer improves timing, helping traders avoid entering against strong, ongoing momentum.
Background Ribbon (Contextual Visuals)
A translucent ribbon overlays the chart to provide visual context of active trades. The ribbon displays volatility envelopes and position direction: green for long trades, red for short trades. It enhances clarity by giving traders a quick visual reference of the market environment without cluttering the chart.
Why These Parameters Were Chosen
The strategy focuses only on structurally meaningful pivots to ensure high-conviction trades.
Volatility filters confirm that trade signals are significant relative to recent price action, while FVG confirmation captures institutional-style imbalances.
Momentum and spacing rules prevent low-quality entries and overtrading, while the one-bar flip handler ensures seamless transitions when the structure reverses.
Ribbon overlays provide intuitive, real-time visualization of active trades and market context.
📈 Chart Visuals: Clear & Intuitive
- Green “▲” below a candle: Long entry triggered on LL → HH structure flip
- Red “▼” above a candle: Short entry triggered on HH → LL structure flip
- Translucent Ribbon: Green when long, Red when short
🔔 Alerts: Stay Notified Without Watching
The strategy supports real-time alerts on candle close, ensuring that only fully confirmed signals trigger notifications.
You must manually configure alerts within your TradingView account. Once set up, a single alert per instrument covers all relevant entries and exits, making hands-free monitoring simple and efficient.
⚙️ Strategy Report Properties
Position size: 25% of equity per trade
Initial capital: 10,000.00 USDT
Pyramiding: 25 entries per direction
Slippage: 2 ticks
Commission: 0.055% per side
Backtest timeframe: 1-minute
Backtest instrument: HYPEUSDT
Backtesting range: Aug 11, 2025 — Aug 28, 2025
💡Why 25% Equity Per Trade?
While it's always best to size positions based on personal risk tolerance, we defaulted to 25% equity per trade in the backtesting data — and here’s why:
Backtests using this sizing show manageable drawdowns even under volatile periods
The strategy generates a sizeable number of trades, reducing reliance on a single outcome
Combined with conservative filters, the 25% setting offers a balance between aggression and control
Users are strongly encouraged to customize this to suit their risk profile.
🔍 What Makes This Strategy Unique?
HH/LL Pivot Focus: Trades pivot structure flips instead of relying on generic indicators.
Fair Value Gap Confirmation: Only pivots supported by FVGs are acted upon, reducing noise.
One-Bar Flip Handler: Ensures clean transitions when the structure reverses, avoiding same-bar conflicts.
Volatility & Spacing Filters: Trades require sufficient movement from prior entries and minimum bar spacing to maintain quality.
Momentum-Aware Entries: RSI alignment favors entries near potential exhaustion points, improving signal reliability.
Contextual Ribbon Overlay: Visualizes volatility and active positions clearly, without cluttering the chart.
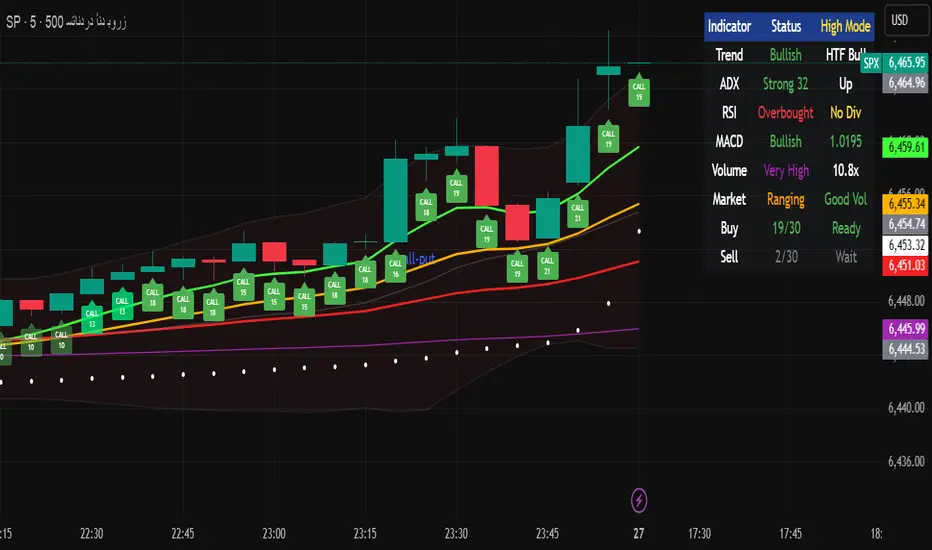
Multi-Timeframe Options Strategy with Dynamic Scoring System## Multi-Timeframe Options Strategy with Dynamic Scoring System
### Overview
This indicator combines 12 technical analysis tools using a proprietary 30-point scoring system to generate options trading signals (CALL/PUT). It's designed for traders seeking confluence-based entries with multiple confirmation layers.
### How the Scoring System Works
The indicator evaluates market conditions across three categories:
**Trend Analysis (9 points maximum):**
- EMA Alignment (9, 21, 50, 200): Checks if moving averages are properly stacked (3 points)
- ADX Trend Strength: Confirms trend momentum above 25 threshold (3 points)
- Higher Timeframe Confirmation: Validates signals against larger timeframe trend (3 points)
**Momentum Indicators (7 points maximum):**
- RSI Position & Direction: Optimal zones 40-65 for buys, 35-60 for sells (2 points)
- MACD Signal Line Cross: Momentum confirmation (2 points)
- Stochastic Oscillator: Overbought/oversold conditions (2 points)
- Bollinger Band Position: Price relative to middle band (1 point)
**Market Quality Filters (4 points maximum):**
- Volume Confirmation: 1.5x average volume requirement (2 points)
- VWAP Position: Trend alignment check (1 point)
- ATR Volatility: Ensures adequate price movement (1 point)
### Key Features
**1. Fair Value Gaps (FVG)**
- Identifies price inefficiencies between candles
- Bullish FVG: Current low > high (potential support)
- Bearish FVG: Current high < low (potential resistance)
- Visual representation with colored boxes on chart
**2. Three Operating Modes**
- Normal Mode: Minimum 10 points - balanced signal frequency
- High Mode: Minimum 15 points - fewer but stronger signals
- Ultra Mode: Minimum 20 points - only highest quality setups
**3. Protection Mechanisms**
- Bollinger Band squeeze detection avoids ranging markets
- Prevents conflicting signals (no simultaneous CALL/PUT)
- 5-bar minimum cooldown between signals
- Filters extreme RSI readings (>75 or <25)
**4. Risk Management**
- Three profit targets: 0.5%, 1%, 1.5%
- Stop loss: 0.5% or ATR-based
- Visual target lines with entry/exit levels
### How Components Work Together
The indicator creates a comprehensive market analysis by combining:
- **EMAs** provide the trend structure framework
- **Oscillators** (RSI, Stochastic) identify optimal entry timing
- **ADX** confirms trend strength to filter weak signals
- **Volume** validates institutional participation
- **Higher timeframe** acts as a directional filter
Each component contributes points to either bullish or bearish scoring. Signals only generate when one direction significantly outweighs the other and meets minimum thresholds.
### Usage Instructions
1. **Select Mode**: Choose Normal/High/Ultra based on your trading style
2. **Monitor Dashboard**: Check real-time scoring and market conditions
3. **Wait for Signals**: Main BUY/SELL labels appear when criteria met
4. **Follow Targets**: Use automated TP and SL levels for risk management
5. **Candle Labels**: Optional CALL/PUT labels show building momentum
### Dashboard Information
The dashboard displays:
- Current trend direction and HTF confirmation
- ADX strength and direction
- RSI status with divergence detection
- MACD momentum state
- Volume multiplier
- Market condition (trending/ranging)
- Live scoring for both directions
### Important Notes
- This is a technical analysis tool, not financial advice
- Past performance does not guarantee future results
- Always use proper risk management
- Test thoroughly on demo before live trading
### Originality
This indicator's unique value comes from:
1. The 30-point weighted scoring system that prioritizes different factors
2. Integration of Fair Value Gaps with traditional indicators
3. Multi-mode operation allowing traders to adjust signal frequency
4. Higher timeframe validation system
5. Comprehensive filtering to reduce false signals
The combination creates a systematic approach to options trading that goes beyond simple indicator mashups by providing clear, scored reasoning for each signal.
---
### Updates and Support
For questions or suggestions, please comment below. The indicator will be updated based on community feedback while maintaining compliance with all platform rules.
Essa - Market Structure Crystal Ball SystemEssa - Market Structure Crystal Ball V2.0
Ever wished you had a glimpse into the market's next move? Stop guessing and start anticipating with the Market Structure Crystal Ball!
This isn't just another indicator that tells you what has happened. This is a comprehensive analysis tool that learns from historical price action to forecast the most probable future structure. It combines advanced pattern recognition with essential trading concepts to give you a unique analytical edge.
Key Features
The Predictive Engine (The Crystal Ball)
This is the core of the indicator. It doesn't just identify market structure; it predicts it.
Know the Odds: Get a real-time probability score (%) for the next structural point: Higher High (HH), Higher Low (HL), Lower Low (LL), or Lower High (LH).
Advanced Analysis: The engine considers the pattern sequence, the speed (velocity) of the move, and its size to find the most accurate historical matches.
Dynamic Learning: The indicator constantly updates its analysis as new price data comes in.
The All-in-One Dashboard
Your command center for at-a-glance information. No need to clutter your screen!
Market Phase: Instantly know if the market is in a "🚀 Strong Uptrend," "📉 Steady Downtrend," or "↔️ Consolidation."
Live Probabilities: See the updated forecasts for HH, HL, LL, and LH in a clean, easy-to-read format.
Confidence Level: The dashboard tells you how confident the algorithm is in its current prediction (Low, Medium, or High).
🎯 Dynamic Prediction Zones
Turn probabilities into actionable price areas.
Visual Targets: Based on the highest probability outcome, the indicator draws a target zone on your chart where the next structure point is likely to form.
Context-Aware: These zones are calculated using recent volatility and average swing sizes, making them adaptive to the current market conditions.
🔍 Fair Value Gap (FVG) Detector
Automatically identify and track key price imbalances.
Price Magnets: FVGs are automatically detected and drawn, acting as potential targets for price.
Smart Tracking: The indicator tracks the status of each FVG (Fresh, Partially Filled, or Filled) and uses this data to refine its predictions.
🌍 Trading Session Analysis
Never lose track of key session levels again.
Visualize Sessions: See the Asia, London, and New York sessions highlighted with colored backgrounds.
Key Levels: Automatically plots the high and low of each session, which are often critical support and resistance levels.
Breakout Alerts: Get notified when price breaks a session high or low.
📈 Multi-Timeframe (MTF) Context
Understand the bigger picture by integrating higher timeframe analysis directly onto your chart.
BOS & MSS: Automatically identifies Breaks of Structure (trend continuation) and Market Structure Shifts (potential reversals) from up to two higher timeframes.
Trade with the Trend: Align your intraday trades with the dominant trend for higher probability setups.
⚙️ How It Works in Simple Terms
1️⃣ It Learns: The indicator first identifies all the past swing points (HH, HL, LL, LH) and analyzes their characteristics (speed, size, etc.).
2️⃣ It Finds a Match: It looks at the most recent price action and searches through hundreds of historical bars to find moments that were almost identical.
3️⃣ It Analyzes the Outcome: It checks what happened next in those similar historical scenarios.
4️⃣ It Predicts: Based on that historical data, it calculates the probability of each potential outcome and presents it to you.
🚀 How to Use This Indicator in Your Trading
Confirmation Tool: Use a high probability score (e.g., >60% for a HH) to confirm your own bullish analysis before entering a trade.
Finding High-Probability Zones: Use the Prediction Zones as potential areas to take profit, or as reversal zones to watch for entries in the opposite direction.
Gauging Market Sentiment: Check the "Market Phase" on the dashboard. Avoid forcing trades when the indicator shows "😴 Low Volatility."
Confluence is Key: This indicator is incredibly powerful when combined with your existing strategy. Use it alongside supply/demand zones, moving averages, or RSI for ultimate confirmation.
We hope this tool gives you a powerful new perspective on the market. Dive into the settings to customize it to your liking!
If you find this indicator helpful, please give it a Boost 👍 and leave a comment with your feedback below! Happy trading!
Disclaimer: All predictions are probabilistic and based on historical data. Past performance is not indicative of future results. Always use proper risk management.

Trading Macro Windows by BW v2
Trading Macros by BW: Integrating ICT Concepts for Session Analysis
This indicator combines two key Inner Circle Trader (ICT) concepts—Change in State of Delivery (CISD) or Inverted Fair Value Gap (IFVG) signals with Macro Time Windows—to provide a unified tool for analyzing intraday price action, particularly during Pacific Time (PT) sessions. Rather than simply merging existing scripts, this integration creates a cohesive visual framework that highlights how macro consolidation periods interact with potential reversal or continuation signals like CISD or IFVG. By overlaying macro candle styling and borders on the chart alongside selectable signal lines, traders can better contextualize setups within ICT's macro narrative, where price often manipulates liquidity during these windows before displacing toward higher-timeframe objectives.
Core Components and How They Work Together:
Macro Time Windows (Inspired by ICT's Macro Periods):
ICT emphasizes "macro" as 30-minute windows (e.g., 06:45–07:15 PT, 07:45–08:15 PT, up to 11:45–12:15 PT) where price tends to consolidate, sweep liquidity, or form key structures like Fair Value Gaps (FVGs). These periods set the stage for the session's directional bias.
The indicator styles candles within these windows using a user-defined color for wicks, borders, and bodies (translucent for visibility). This visual emphasis helps traders focus on activity inside macros, where reversals or continuations often originate.
Borders are drawn as vertical lines at the start and end of each window (with a +5 minute buffer to capture related activity), using a dotted style by default. This creates a "study zone" that encapsulates macro events, allowing traders to assess if price is respecting or violating these zones in alignment with broader ICT models like the Power of 3 (AMD cycle).
Toggle: "Macro Candles Enabled" (default: true) – Turn off to disable styling and borders if focusing solely on signals.
CISD or IFVG Signals (Selectable Mode):
Mode Selection: Choose between "Change in the State of Delivery" (CISD) or "IFVG" (default: IFVG). Both detect shifts in market delivery during specific 30-minute slices (15–45 or 17–45 minutes past the hour in PT sessions).
CISD Mode: Based on ICT's definition of a sudden directional shift, this identifies aggressive displacements after sweeping recent highs/lows. It uses a rolling reference high/low over 6 bars, checks for sweeps (penetrating by at least 2 ticks in the last 2-3 bars), reclamation (closing beyond the reference with at least 50% body), and displacement (50% of prior range or an immediate FVG of 6+ ticks). Signals plot a horizontal line from the close, extending 24 bars right, labeled "CISD."
IFVG Mode: Focuses on Inverted Fair Value Gaps, where a bullish FVG (low > high by 13+ ticks) forms but is inverted (closed below) in the same slice, signaling bearish intent (or vice versa). This targets violations against opposing liquidity, often leading to raids on external ranges. Signals plot similarly, labeled "IFVG."
Shared Logic: Both modes enforce a 55-bar cooldown to prevent clustering, operate only during PT sessions (06:30–13:00), and use tick-based thresholds for precision across instruments. The integration with macros allows traders to see if signals occur within or at the edges of macro windows, enhancing confirmation—for example, a CISD inside a macro might indicate a manipulated reversal toward the session's true objective.
Toggle: "Signals Enabled" (default: true) – Turn off to hide all signal lines and labels, isolating the macro visualization.
How Components Interact:
Macro windows provide the "narrative context" (consolidation/manipulation), while CISD/IFVG signals detect the "delivery shift" (displacement). Together, they form a mashup that justifies publication: isolated signals can be noisy, but when filtered by macro periods, they align with ICT's session model. For instance, an IFVG inversion during a macro might confirm a liquidity sweep before targeting PD arrays or order blocks.
No external dependencies; all calculations are self-contained using Pine's built-in functions like ta.highest/lowest for references and time-based sessions for windows.
Usage Guidelines:
Apply to intraday charts (e.g., 1-5 min) or stocks during PT hours.
Look for confluence: A bull IFVG signal post-macro low sweep might target the next macro high or daily bias.
Customize colors/styles for signals (solid/dashed/dotted lines) and macros to suit your chart.
Backtest in replay mode to observe how macros frame signals—e.g., price often respects macro borders as S/R.
Limitations: Timezone-fixed to PT (America/Los_Angeles); signals are directional hints, not trade entries. Combine with ICT tools like order blocks or liquidity pools for full setups.
This script draws from community ICT implementations but refines them into a single, purpose-built tool for macro-driven trading, reducing chart clutter while emphasizing interconnected concepts. Feedback welcome!

ICT Assistance TYHE42█ Overview
ICT Assistant Tye42 is a complete indicator built for Smart Money Concepts (SMC) and ICT-based trading strategies, offering a clear, stable, and real-time view of key market levels.
This all-in-one tool includes several essential features used by professional traders:
Fair Value Gaps (FVG) detected in real-time
EQH (Equal Highs) and EQL (Equal Lows) auto-detected
Previous Highs & Lows (Daily, Weekly, Monthly)
Killzones (Asian Range, London Open, New York Open, London Close)
Daily Open Line
Every module is fully customizable (color, opacity, timezone, toggle on/off), allowing traders to tailor the indicator to their strategy, style, and chart theme.
Designed for traders focused on market structure, liquidity, and imbalances, this script emphasizes clarity, responsiveness, and visual efficiency — without cluttering your chart.
█ How It Works
🔍 Automatic detection of key price action elements:
Fair Value Gaps (FVG): identified based on ICT logic (imbalance between the current candle and the one two candles back)
EQH/EQL: spots equal highs and lows as potential liquidity zones
Previous Highs & Lows: automatically plots highs and lows from previous sessions (Daily, Weekly, Monthly)
Killzones: highlights key time-based volatility zones depending on your selected timezone
Daily Open Line: shows the daily open level to help frame the trading session
█ How to Use
Use FVGs and EQH/EQL as potential imbalance or liquidity signals
Combine with Killzones to identify moments of high volatility
Monitor Previous Highs & Lows for potential stop hunts or reaction areas
Works on all timeframes – ideal for intraday and swing trading
█ Settings
Custom colors & opacity for each module
Adjustable timezone for precise session alignment
Individual on/off toggles for a clean and tailored display
█ What Makes It Unique
Unlike other ICT indicators that overload charts with visuals, ICT Assistant Tye42 follows a minimalist, clean, and efficient approach, while combining all key tools in one script.
Built for traders who want to focus on what matters most — market structure, liquidity, and institutional price behavior — this tool provides everything you need in a sleek package.
⚠️ Disclaimer
This script is for educational purposes only and does not constitute financial advice. Use at your own risk. No refunds or liabilities provided.

Gold Killzone Bias Suite🟡 Gold Killzone Bias Suite
The Gold Killzone Bias Suite is an advanced institutional-grade tool designed to generate high-confidence directional bias for XAU/USD (Gold) during the London and New York killzones.
Built for traders using a structured, confluence-driven approach, this tool blends price action, smart money principles, momentum, and volume into a real-time bias engine with a clean, easy-to-read dashboard.
🔧 Key Features
🕰️ Session-Based Bias (London / New York)
Independent bias calculation per session
Killzone times customizable with timezone support
Background highlighting (blue/red) for each session
📊 VWAP Engine
Reclaim & rejection detection
VWAP deviation alerts
Daily HTF VWAP integration
Score impact based on VWAP behaviour
📉 Market Structure (CHoCH / BOS)
Detects swing highs/lows
Labels bullish/bearish CHoCHs
Structure score contributes to session bias
💧 Liquidity Grabs
Detects stop hunts above highs / below lows
Confirms with candle rejection (body % filter)
Plots labels and adds to bias scoring
⚡ Momentum Filters
RSI: Bullish >55, Bearish <45
MACD: Histogram + Signal Line crossovers
Combined momentum score used in bias
🧠 Smart Money Proximity
Optional FVG/OB score toggle (placeholder for custom logic)
Adds static confluence for proximity-based setups
⏫ Higher Time Frame Context
Daily VWAP comparison
4H high/low structure breaks
Adds trend score to current session bias
🧠 How Bias Works
The suite uses a scoring model. Each confluence adds or subtracts points:
VWAP reclaim/reject: ±30
CHoCH/BOS: ±30
Liquidity grab: ±20
RSI/MACD: ±10
FVG/OB Proximity: +10
Daily VWAP trend: ±10
H4 Trend Break: ±10
Final Bias:
Bullish if score ≥ +20
Bearish if score ≤ -20
Neutral if between -19 and +19
A confidence % (capped at 100) is also shown, along with the contributing confluences (VWAP, Structure, Liquidity, etc.).
📋 Dashboard
A real-time dashboard shows for each session:
Session name and time
Bias (Bullish / Bearish / Neutral)
Confidence (%)
Confluences used
Position can be moved (Top Left, Top Right, etc.). Designed to be unobtrusive yet informative.
🧪 Best Practices
Use on 15m / 5m charts for intraday setups
Confirm with D1 or H4 structure for directional context
Combine with OB/FVG zones or SMT for entries
Use Trading View alerts for bias flips or liquidity grabs (custom logic can be added)
Bar Replay compatible for back testing and journaling bias shifts
🔐 Notes
Does not generate trade signals or alerts by default
Focused on bias generation and confluence stacking
Compatible with funded account trading models
📈 Built for traders who want a systematic, score-based approach to identifying directional edge in high-volume gold sessions.

Ayman Entry Signal – Ultimate PRO (Scalping Gold Settings)1. Overview
This indicator is a professional gold scalping tool built for TradingView using Pine Script v6.
It combines multiple price action and technical filters to generate high-probability Buy/Sell signals with built-in trade management features (TP1, TP2, SL, Break Even, Partial Close, Stats tracking).
It is optimized for XAUUSD but can be applied to other assets with proper setting adjustments.
2. Key Features
Multi-Condition Trade Signals – EMA trend, Break of Structure, Order Blocks, FVG, Liquidity Sweeps, Pin Bars, Higher Timeframe confirmation, Trend Cloud, SMA Cross, and ADX.
Full Trade Management – Auto-calculates lot size, SL, TP1, TP2, Break Even, Partial Close.
Dynamic Chart Drawing – Entry lines, SL/TP lines, trade boxes, and real-time PnL.
Statistics Panel – Tracks wins, losses, breakeven trades, and total PnL over selected dates.
Customizable Filters – All filters can be turned ON/OFF to match your strategy.
3. Main Inputs & Settings
Account Settings
Capital ($) – Total trading capital.
Risk Percentage (%) – Risk per trade.
TP to SL Ratio – Risk-to-reward ratio.
Value Per Point ($) – Value per pip/point for lot size calculation.
SL Buffer – Extra points added to SL to avoid stop hunts.
Take Profit Settings
TP1 % of Full Target – Fraction of TP1 compared to TP2.
Move SL to Entry after TP1? – Activates Break Even after TP1.
Break Even Buffer – Extra points when moving SL to BE.
Take Partial Close at TP1 – Option to close half at TP1.
Signal Filters
ATR Period – For SL/TP calculation buffer.
EMA Trend – Uses EMA 9/21 crossover for trend.
Break of Structure (BoS) – Requires structure break confirmation.
Order Block (OB) – Validates trades within OB zones.
Fair Value Gap (FVG) – Confirms trades inside FVGs.
Liquidity Sweep – Checks if liquidity zones are swept.
Pin Bar Confirmation – Uses candlestick patterns for extra confirmation.
Pin Bar Body Ratio – Controls strictness of Pin Bar filter.
Higher Timeframe Filters (HTF)
HTF EMA Confirmation – Confirms lower timeframe trades with higher timeframe trend.
HTF BoS – Confirms with higher timeframe structure break.
HTF Timeframe – Selects higher timeframe.
Advanced Filters
SuperTrend Filter – Confirms trades based on SuperTrend.
ADX Filter – Filters out low volatility periods.
SMA Cross Filter – Uses SMA 8/9 cross as filter.
Trend Cloud Filter – Uses EMA 50/200 as a cloud trend filter.
4. How It Works
Buy Signal Conditions
EMA 9 > EMA 21 (trend bullish)
Optional filters (BoS, OB, FVG, Liquidity Sweep, Pin Bar, HTF confirmations, ADX, SMA Cross, Trend Cloud) must pass if enabled.
When all active filters pass → Buy signal triggers.
Sell Signal Conditions
EMA 9 < EMA 21 (trend bearish)
Same filtering process but for bearish conditions.
When all active filters pass → Sell signal triggers.
5. Trade Execution & Management
When a signal triggers:
Lot size is auto-calculated based on risk % and SL distance.
SL is placed beyond recent swing high/low + ATR buffer.
TP1 and TP2 are calculated from the SL using the reward-to-risk ratio.
Break Even: If enabled, SL moves to entry price after TP1 is hit.
Partial Close: If enabled, half of the position closes at TP1.
Trade Exit: Full exit at TP2, SL hit, or partial close at TP1.
6. Chart Display
Entry Line – Shows entry price.
SL Line – Red dashed line at stop loss level.
TP1 Line – Lime dashed line for TP1.
TP2 Line – Green dashed line for TP2.
PnL Labels – Displays real-time profit/loss in $.
Trade Box – Visual area showing trade range.
Pin Bar Shapes – Optional, marks Pin Bars.
7. Statistics Panel
Stats Header – Shows “Stats”.
Total Trades
Wins
Losses
Breakeven Trades
Total PnL
Can be reset or filtered by date.
8. How to Use
Load the Indicator in TradingView.
Select Gold (XAUUSD) on your preferred scalping timeframe (1m, 5m, 15m).
Adjust settings:
Use default gold scalping settings for quick start.
Enable/disable filters according to your style.
Wait for a Buy/Sell alert.
Confirm visually that all desired conditions align.
Place trade with calculated lot size, SL, and TP levels shown on chart.
Let trade run – the indicator manages Break Even & Partial Close if enabled.
9. Recommended Timeframes
Scalping: 1m, 5m, 15m
Day Trading: 15m, 30m, 1H
Swing: 4H, Daily (adjust settings accordingly)

Mereks Wick Theory🚨 Wick Precision Zones – Top & Bottom Sniper
📈 Timeframes: 1H & 4H | 🔍 Powered by Smart Wick Logic + FVG Detection
Mark the exact 50% of key wicks where smart money reacts.
This advanced indicator auto-detects Fair Value Gaps (FVGs), Order Blocks, and liquidity zones, then highlights precision reversal levels with color-coded lines (🔴 short / 🟢 long).
✅ Alerts before and when price hits the zone
✅ Works even with just a strong wick inside FVG
✅ Filters in real-time to increase signal accuracy
✅ Built for top- and bottom-ticking entries
