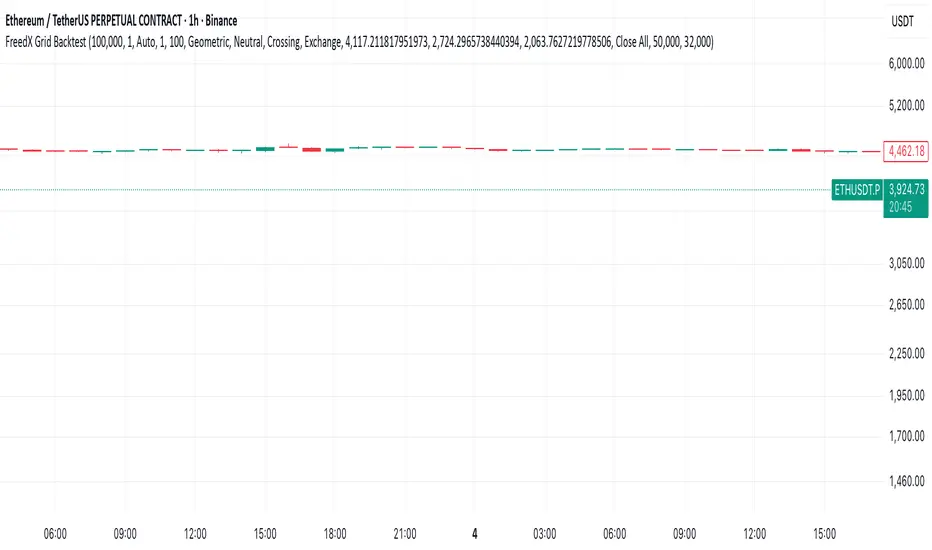
Example - How to create multiple level gridsExample on how to create custom grids with variable N lines/labels:
Search in scripts for "grid"

MTF Polarity Grid [DW]This is an experimental study designed to track directional polarities across multiple timeframes and express them as a simple two color grid.
The polarity in this calculation is determined by divergence between a fast and slow McGinley Dynamic.
Your current resolution's polarity is the top row, the rows below are are for higher timeframes of your choice.

[RS]Grid Deploy System V0request for coondawg71
showgriddepth options (0 to 4) will show more or less lines.
gridspacing : value in points (PIP*0.1)

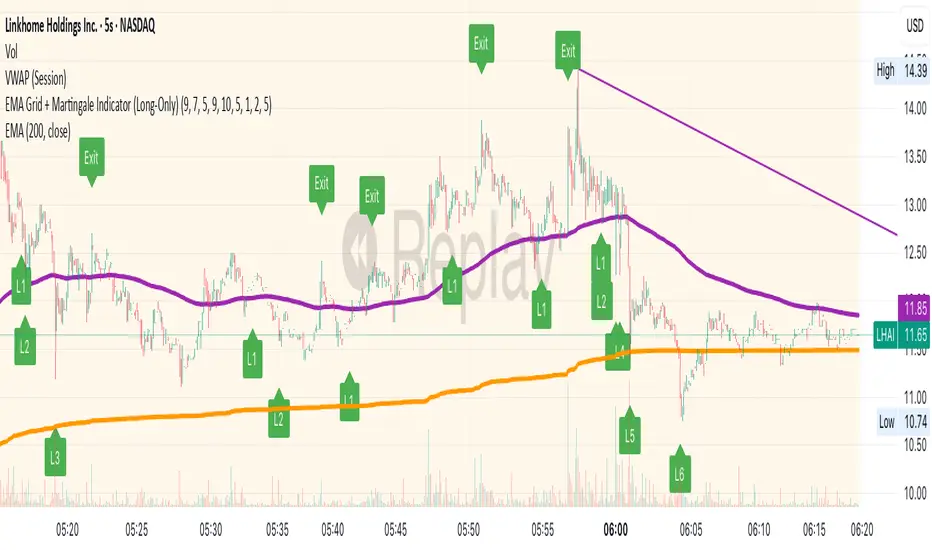
EMA Grid + Martingale Indicator (Long-Only)Title:
EMA Grid + Martingale Indicator (Long-Only)
Short Summary:
A 4-EMA trend filter combined with a grid-based entry system and optional martingale sizing to visualize staged long entries and exits in bullish markets.
Full Description:
This indicator combines a 4-EMA trend filter with a grid-based entry system and optional martingale-style position sizing to help traders visualize staged long entries and exits in trending markets.
How It Works
1. Trend Detection: Uses two sets of EMAs (fast/slow pairs) to confirm bullish momentum. A long signal is generated when both EMA groups align in an uptrend.
2. Grid Entries: After the initial long entry, additional grid levels are triggered every time price drops by the specified grid step (in pips).
3. Martingale Sizing (Optional): Each subsequent entry can increase in size based on the defined martingale factor.
4. Weighted-Average Exit: Calculates the weighted average of all grid entries and signals an exit when the price reaches or surpasses this level plus an optional buffer.
Key Features
• 4 EMA Trend Filter with fully customizable lengths.
• Dynamic grid entries with visual labels (L1, L2, etc.).
• Optional martingale position sizing.
• Weighted-average exit with adjustable buffer.
• Customizable parameters for EMAs, grid steps, max entries, and buffer pips.
• Clear chart visualization of EMAs and entry/exit levels.
Use Cases
• For traders using cost-averaging or grid strategies in bullish markets.
• Visualizes multiple entry levels and profit targets.
• Useful for backtesting and strategy planning.
Note: This indicator is for visualization and planning purposes only. It does not execute trades automatically. It does not guarantee profits and is not financial advice.
Assassin's Grid
Introduction: Are you a fan of automated grid-based trading and holding onto your crypto assets like they're the last Snickers bar in the world? If so, this Pine script could be your new best friend!
Grid Trading Genius: The script uses some seriously advanced grid trading techniques to automatically place orders at different price levels, creating a mesh of positions that move with the market like a well-oiled machine. This strategy can be great for traders who are willing to sit back and let their positions grow like a fine wine over time.
Optimization Features: The script comes loaded with all sorts of features and tools to help traders optimize their grid positions, like position exits and custom alerts for creating limit and market orders. This helps keep traders in the loop and allows them to take action as needed, like a ninja in the night.
Unique Twists: One of the unique features of this script is the option to choose between normal or incremental entry steps in a 1,2,3,... ratio. By choosing incremental entries, traders can potentially improve their average price and increase their potential profits like a boss. Just keep in mind that this script doesn't have a stop loss feature, but it does include the option to sell without profit on the final entry or on all entries if desired. Additionally, the script is always open to improvement and any ideas for improving it are welcome, like a blank canvas.
Conclusion: If you love automated trading and have the patience and determination to stick to a solid strategy, this Pine script could be a great fit for you. It's suitable for traders who are comfortable with more complex trading approaches and are willing to put in the time and effort to learn and master the script's various features and techniques, like a Jedi Knight
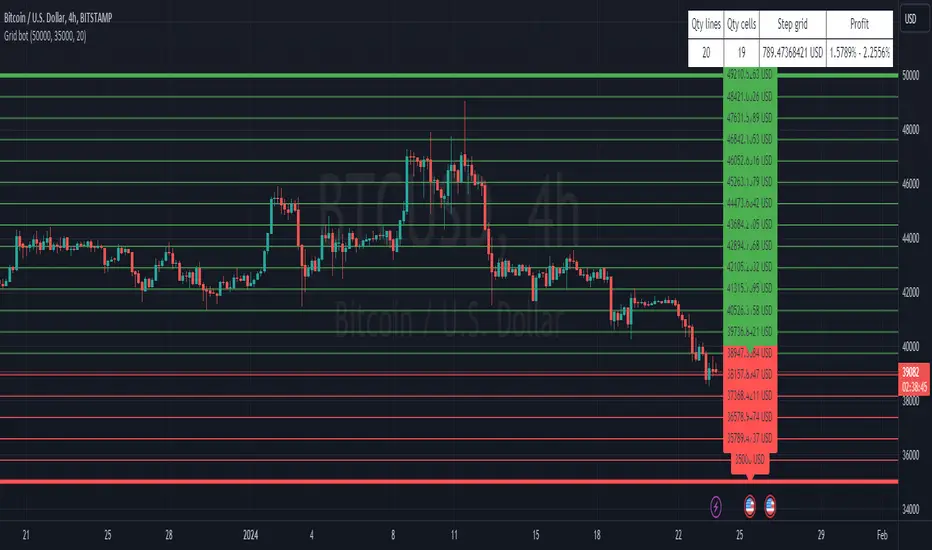
3commas GRID bot VisualisationHello everyone
This is a grid display indicator for a 3-comma grid bot.
Just enter the upper and lower borders of your grid and the number of grid cells in the indicator settings.
It's simple!
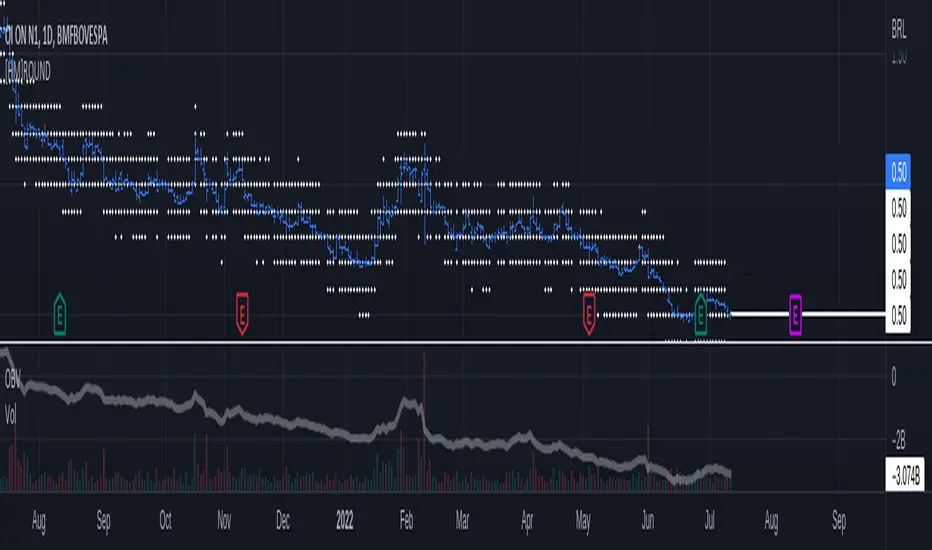
Revenue GridDescription:
The Revenue Grid indicator helps traders and investors visualize a stock’s valuation by plotting horizontal lines based on its price-to-sales (P/S) ratio. This tool displays how the stock price compares to multiples of its total revenue per share, giving a clear perspective on valuation benchmarks.
Fundamental Concept:
The price-to-sales ratio compares a company’s stock price to its revenue per share. It’s used to evaluate whether a stock is overvalued or undervalued based on its revenue.
This indicator offers a unique way to view this ratio by applying Fibonacci multiples to the revenue per share. It plots lines at these multiples to show how the stock price measures up against different valuation levels.
How It Works:
Data Inputs:
Total Revenue (TR): The company’s revenue over the past twelve months.
Total Shares Outstanding (TSO): The total number of shares in circulation.
Calculation:
Calculates the revenue per share (TR/TSO).
Plots lines at fixed Fibonacci multiples (e.g., 1x, 2x, 3x, 5x, 8x, 13x) of the revenue per share value.
How to Use:
1. Add the "Revenue Grid" indicator to your chart by searching for it in the indicator library and applying it.
2. Observe the lines plotted on the chart. If these lines are trending upwards, it indicates that the revenue is increasing.
3. Analyze how historical prices trend relative to these lines. Look for periods where the stock price supports around specific multiples, you can easily get a sense of overvaluation or undervaluation in certain periods.
Use this information to guide further analysis and investment decisions.
Benefits:
1. Clear Valuation View: Easily see how the company’s revenue translates into stock price levels.
2. Investment Insight: Identify if the stock price is lagging behind revenue growth, which might signal a buying opportunity.
3. Historical Context: Understand how the market has historically valued the company and assess the current valuation.
Do let me know your feedbacks in comments. Happy Investing :)

ATR Grid Levels [By MUQWISHI]▋ INTRODUCTION :
The “ATR Levels” produces a sequence of horizontal line levels above and below the Center Line (reference level). They are sized based on the instrument's volatility, representing the average historical price movement on a selected higher timeframe using the average true range (ATR) indicator.
_______________________
▋ OVERVIEW:
_______________________
▋ IMPLEMENTATION:
The indicator starts by drawing a Center Line that is selected by the user from a variety of common levels. Then, it draws a sequence of horizontal lines above and below the Center Line, which are sized based on the most confirmed average true range (ATR) at the selected higher timeframe.
In the top right corner of the chart, there is a table displaying both the selected ATR (in the right cell) and the ATR of the current bar (in the left cell). This feature enables users to compare these two values. It's important to note that the ATR of the current bar may not be confirmed yet, as the market is still active.
_______________________
▋ INDICATOR SETTINGS:
# Section (1): ATR Settings
(1) ATR Period & Smoothing.
(2) Timeframe where ATR value imported from.
(3) To show/hide the table comparison between the current ATR and the ATR for the selected period. Also, ability to color the current ATR cell if it’s greater.
# Section (2): Levels Settings
(1) Selecting a Center Line level among a variety of common levels, which is taken as reference level where a sequence of horizontal lines plot above and below it.
(2) Size of grid in ATR unit.
(3) Number of horizontal lines to plot in a single side.
(4) Grid Side. Ability to plot above or below the Center Line.
(5) Lines colors, and mode.
(6) Line style.
(7) Label style.
(8) Ability to remove old lines, from previous HTF.
_____________________
▋ COMMENT:
The ATR Levels should not be taken as a major concept to build a trading decision.
Please let me know if you have any questions.
Thank you.

Moving Grid Trader - With AlertsThis script used a grid system that is set when a "buy" signal is sent to generate profits inside of a range. This script used macd to weed out bad buys and then sells once the price either reaches the grid - or hits the stoploss. This works best in bullish and ranging markets.

Intraday Grid trading exampleHello everyone,
This was a grid trading example for intraday trading.
Please be advised that every commodity have diferent kind of reaction and rate of change between periods therefore the percentages need to be adjusted acording to the commodities change %.
In order to specify the adjustment rate we add the Zig Zag in the script.
For Example ;
Last 3 days zigzag high points are %25 , %13 and %8 , the average %is about %9 therefore you have to put the adjustment ratios something like;
Z%1 = %3
Z%2 = %6
Z%3 = %9
Feel free to use the script with caution( it was not a investment advice), this was only a example of grid trading strategy on our trading platform.
Regards.
[HM] HORIZONTAL GRID ROUNDED (VOLATILITY BASED)The purpose of this indicator is to draw a horizontal grid having in mind:
- rounded price levels instead tradingview standard grid, zoom-based;
- calculated by volatility, using daily ATR;
- independent of timeframe in use, locked to DAILY calculations.
Further improvements are intended.
Wish this could be useful. Any questions, feel free to comment.
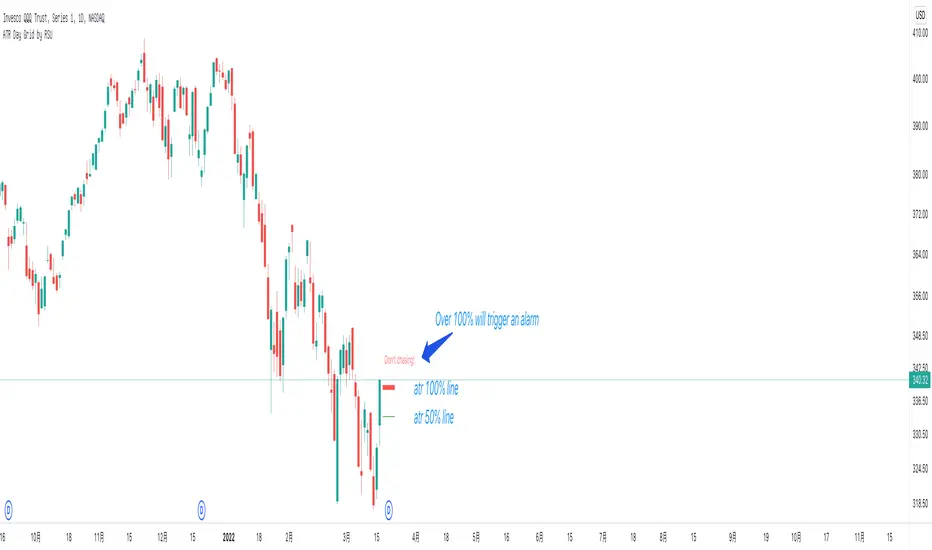
ATR Day Grid by RSUATR at the daily and intraday prompt lines, it is recommended to trade within 50%, and if it exceeds 50%, there is a risk of chasing high.
At the minute level,Day-level ATR grid line is displayed.
Volatility Adjusted Grid [Gann]█ OVERVIEW
Gann Square of 9 is one of the many brilliant concepts from W.D.Gann himself where it revolves around the idea that price is moving in a certain geometrical pattern. Numbers on the Square of 9 spiral tables, especially those lie in every 45degree in the chart act as key vibration levels where prices have tendency to react to (more on the table below).
There are few square of 9 related scripts here in Tradingview and while there's nothing wrong with them, it doesn't address 1 particular issue that i have: The numbers can be too rigid even when scaled based on current price because the levels are fixed, which makes them not tradable on certain timeframes depending on where the price currently sitting.
Heres 5min and 1hour Bitcoin chart to illustrate what i mean: Grey line on the left is based on Volatility Adjusted levels, while red/blue on the right are the standard Gann levels.
You can see that on 1hour chart, it provides a good levels (both Volatility Adjusted and the standard one happened to share the same multiplier in this case),
1Hour Chart:
On 5 min chart tells a different story as the range between blue/red levels can be deemed as to big for a short term trade, while the grey line is adjusted to suit that particular timeframe (You can still adjust to make it bigger/smaller from the settings, more on this below)
5Min Chart:
█ Little bit on Gann Square of 9 table
This is the square of nine table, the numbers highlighted in Red are known as Cardinal Cross and considered to be a major Support/Resistance while those in Blue color are known as Ordinal Cross considered as minor (but still important) Support/Resistance levels
Similarly, this script use these numbers (and certain multipliers) to print out the levels, with Cardinal numbers represented by solid lines and Ordinal numbers by dotted lines.
█ How it Works and Limitations
The Volatility Adjusted grid will go through several iterations of different multipliers to find the Gann number range that is at least bigger than times ATR. Because it's using ATR to determine the range, occasionally you'll notice that the line become smaller as ATR contracting (and vice versa). To overcome this, you can change the size range multiplier from the settings to retrieve the previous range size.
Use the size guide at the bottom left to find the multiplier that suits your need:
1st Row -> Previous Range -- Change Range Size to number lower than this to get a smaller range
2nd Row -> Next Range -- Change Range Size to number higher than this to get a larger range
Example:
Before:
After:
As you'll soon realise, the key here is to find the range that fits the historical structure and suits your own strategy. Enjoy :)
█ Disclaimer
Past performance is not an indicator of future results.
My opinions and research are my own and do not constitute financial advice in any way whatsoever.
Nothing published by me constitutes an investment recommendation, nor should any data or Content published by me be relied upon for any investment/trading activities.
I strongly recommends that you perform your own independent research and/or speak with a qualified investment professional before making any financial decisions.
Any ideas to further improve this indicator are welcome :)

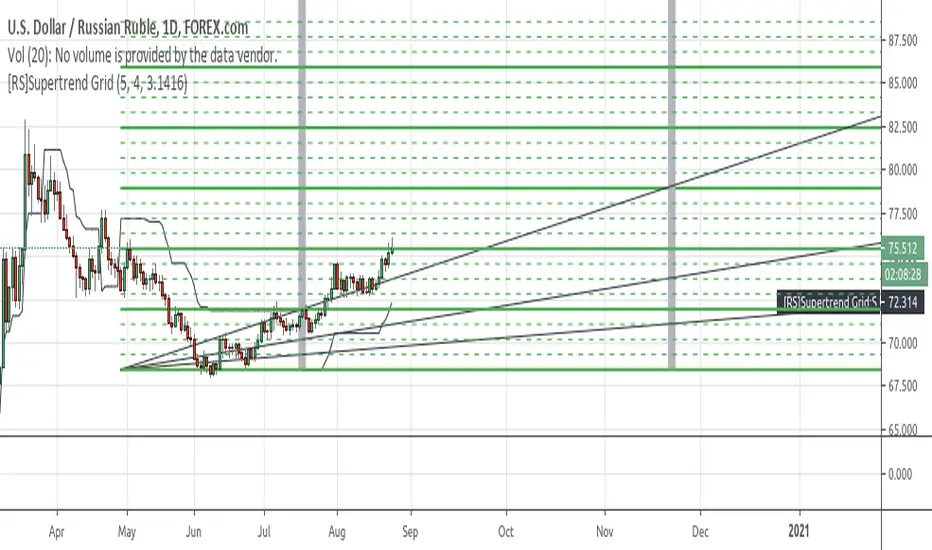
[RS]Supertrend GridDynamic grid system based on supertrend.
note: the input nlines/nfractions are not locked so if values too high might start overlapping line objects.
gridUtilitiesLibrary "gridUtilities"
TODO: add library description here
get_fibonacciGrid_data(length, trend_direction, plot_grid, plot_labels, bars_to_right, include_levels)
: Gets and plots a fibonacci grid.
Parameters:
length (int) : (int): The direction flag that indicates where the trend is going.
trend_direction (string) : (string): Direction of the trend (Long, Short or Neutral)
plot_grid (bool) : (bool): Plots the fibonacci grid.
plot_labels (bool) : (bool): Plots the datatable.
bars_to_right (int) : (bool): Plots the datatable.
include_levels (bool) : (bool): Plots the datatable.
Returns: : Returns a map with the grid levels, as string with the direction of the grid and a map with the values for the dataTable.

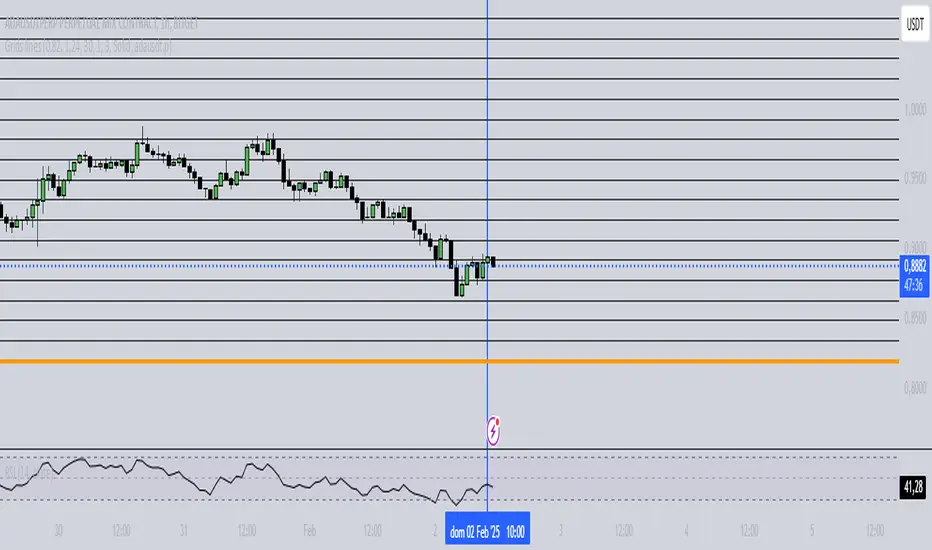
Grids lines"Líneas de Grid para Análisis Técnico"
Este indicador dibuja líneas de grid (rejilla) en el gráfico de precios, lo que puede ayudar a visualizar zonas de soporte, resistencia y niveles de interés en un rango de precios determinado.
Características:
Precio Mínimo y Máximo: Configura los precios entre los cuales se dibujarán las líneas de grid.
Número de Grids: Establece cuántas líneas de grid quieres ver en el gráfico.
Color y Grosor de las Líneas: Personaliza los colores y el grosor de las líneas de grid, incluyendo la primera y la última línea.
Estilo de las Líneas: Puedes elegir entre líneas discontinuas (Dotted) o sólidas (Solid), para personalizar aún más tu visualización.
Ticker Específico: Si lo deseas, puedes elegir un ticker específico para dibujar las líneas solo cuando el gráfico esté mostrando ese activo. De lo contrario, las líneas se dibujarán en el gráfico actual.
Parámetros:
Precio Mínimo: El precio más bajo para el rango del grid (por ejemplo: 0.82).
Precio Máximo: El precio más alto para el rango del grid (por ejemplo: 1.24).
Número de Grids: Define cuántas líneas quieres entre el precio mínimo y el máximo (por ejemplo: 30).
Estilo de Línea: Elige entre Dotted (líneas discontinuas) o Solid (líneas sólidas).
Ticker: Si deseas dibujar las líneas solo para un ticker específico, ingresa el símbolo del ticker (por ejemplo, ADAUSDT). Si dejas este campo vacío, las líneas se dibujarán en el gráfico actual.
Ejemplo de Uso:
Si estás analizando el par ADAUSDT, puedes escribir ADAUSDT en el campo del ticker para que las líneas solo se dibujen cuando este par esté visible. Si dejas el campo vacío, las líneas se dibujarán en cualquier ticker que tengas en el gráfico.
Descripción en Inglés:
"Grid Lines for Technical Analysis"
This indicator draws grid lines on the price chart, helping to visualize support, resistance, and key levels within a specific price range.
Features:
Min and Max Price: Set the price range for the grid lines to be drawn.
Number of Grids: Choose how many grid lines you want to display on the chart.
Line Color and Thickness: Customize the color and thickness of the grid lines, including the first and last line.
Line Style: Choose between Dotted (dashed lines) or Solid (solid lines) to further customize your view.
Specific Ticker: If desired, you can specify a ticker for the grid lines to only be drawn when that asset is shown. Otherwise, the lines will be drawn on the current chart.
Parameters:
Min Price: The lowest price for the grid range (for example, 0.82).
Max Price: The highest price for the grid range (for example, 1.24).
Number of Grids: Defines how many lines you want between the minimum and maximum price (for example, 30).
Line Style: Choose between Dotted or Solid.
Ticker: To draw the lines only for a specific ticker, enter the symbol of the ticker (for example, ADAUSDT). If left blank, the lines will be drawn on the current ticker.
Usage Example:
If you're analyzing the pair ADAUSDT, you can enter ADAUSDT in the ticker field to draw the lines only when that pair is visible. If you leave the field blank, the lines will be drawn for any ticker currently on the chart.
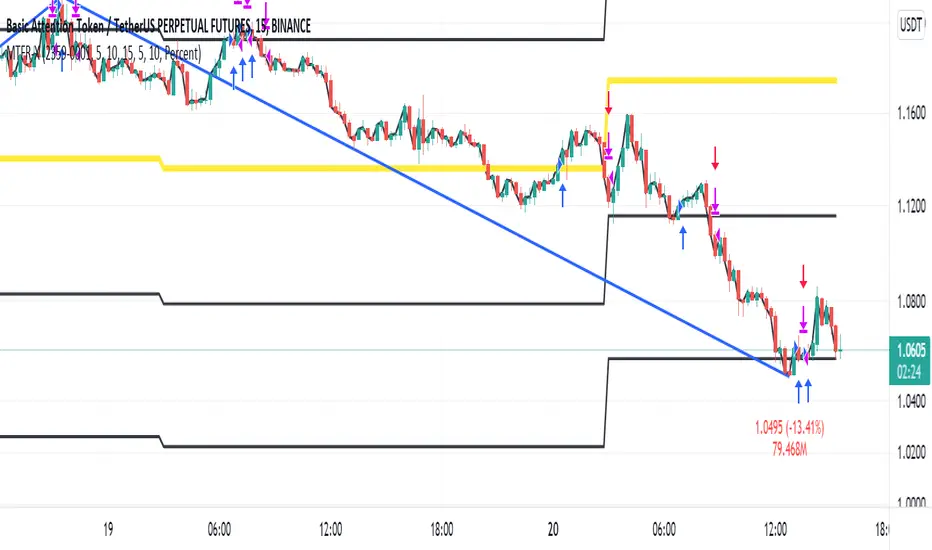
GRIDBOT Scalper by nnamWhat is this Indicator used for?
Made specifically for GRID Bots
note: before continuing... this indicator works on any timeframe, but it WORKS BEST ON THE 15 MINUTE TIMEFRAME
Straters and Forex Master Pattern Value Line Traders use this to help determine when the price could reverse.
This indicator is a scalping indicator that produces signals when a "potential" reversal in price is indicated. When the price moves UP and a Potential Bearish Reversal Signal occurs, traders can use this signal as a potential SHORT entry signal for their Short Grid Bot. The process is the same in reverse. After a sustained move down, a Potential Bullish Signal can be used by the trader as a potential LONG entry signal for their GridBot.
As shown in the screenshot below, lines develop on the chart (either RED or GREEN) indicating that a sustained move in one direction is currently occurring; however, there is no potential reversal signal plotted (this means that price action is currently moving in one direction only).
As shown in the screenshot below, lines can be used as a stop-loss after entering the GRIDbot. (usually, by this time, the Grid Bot is in Profit as it usually moves in the opposite direction first)
What this Indicator Does
The GRIDBOT Scalper provides information regarding potential reversals in the market after a sustained movement in one direction (either Bullish or Bearish).
The indicator is based on PRICE-ACTION ONLY and does not take into account the current state of the market (Bullish or Bearish).
Once the price moves in a particular direction for at least 14 bars , a line appears as shown in a previous screenshot. Once the price stops moving in that direction and begins moving in the opposite direction - and after a sustained run - a "signal" appears alerting the trader that a "potential" reversal could be on the horizon soon.
If price moves in one direction and plots both a line and a signal and then begins moving back in the other direction in a sustained manner, the original signal will remain even when a NEW line begins forming (the original line will disappear). (see below) This line will continue to move as the price continues to move. Not until a signal plots on the chart is the potential reversal forming. THE LINE DOES NOT SIGNAL A REVERSAL . Some traders, however, use this information to "ride the wave UP or DOWN" and exit their positions once the signal prints.
As shown below, optional input settings allow the trader to set the line at CLOSE or HIGH/LOW of the candle preceding the potential reversal.
It is suggested to use Close instead of High or Low but the setting allows one to use either.
As shown in the screenshot below, it is typical on LOWER TIME FRAMES to see the price pass the signal line. The Indicator works best on the 15 minute timeframe, as it gives the trader time to make the decisions required as the volatility is less on the 15 minute chart vs the 1 minute or 5 minute charts.
If you have any questions or suggestions for this indicator, please join our Discord. We offer free training on this Indicator on our Discord Server.

grid strategy longDesign ideas for the first edition:
Only go long, not short, choose a time period when the general trend is up. The default grid size is 1x ATR, the next one, two, and three grids will take orders, and the fifth grid will stop loss. When the empty position reaches the upper grid, the grid as a whole rises.
Chinese Introduction:
只做多、不做空,选择大趋势向上的时间段。网格大小默认为1倍ATR,往下1、2、3个网格吃单,第5个网格止损。空仓时到达往上一个网格则网格整体抬升。

Grid TraderGrid Trader Indicator ( GTx ):
Overview
The Grid Trader Indicator is a tool that helps traders visualize key levels within a specified trading range. The indicator plots accumulation and distribution levels, an entry level, an exit level, and a midpoint. This guide will help you understand how to use the indicator and its features for effective grid trading.
Basics of Trading Range, Grid Buy, and Grid Sell
Trading Range
A trading range is the horizontal price movement between a defined upper ( resistance ) and lower ( support ) level over a period of time. When a security trades within a range, it repeatedly moves between these two levels without trending upwards or downwards significantly. Traders often use the trading range to identify potential buy and sell points:
Upper Level (Resistance): This is the price level at which selling pressure overcomes buying pressure, preventing the price from rising further.
Lower Level (Support): This is the price level at which buying pressure overcomes selling pressure, preventing the price from falling further.
Grid Trading Strategy
Grid trading is a type of trading strategy that involves placing buy and sell orders at predefined intervals around a set price. It aims to profit from the natural market volatility by buying low and selling high in a range-bound market. The strategy divides the trading range into several grid levels where orders are placed.
Grid Buy
Grid buy orders are placed at intervals below the current price . When the price drops to these levels, buy orders are triggered . This strategy ensures that the trader buys more as the price falls, potentially lowering the average purchase price .
Grid Sell
Grid sell orders are placed at intervals above the current price . When the price rises to these levels, sell orders are triggered . This ensures that the trader sells portions of their holdings as the price increases, potentially securing profits at higher levels .
Key Points of Grid Trading
Grid Size : The interval between each buy and sell order. This can be constant (e.g., $2 intervals) or variable based on certain conditions.
Accumulation Range : The lower part of the trading range where buy orders are placed.
Distribution Range : The upper part of the trading range where sell orders are placed.
Midpoint : The average price of the entry and exit levels, often used as a reference point for balance.
As the price moves up and down within this range, your buy orders will be triggered as the price drops and your sell orders will be triggered as the price rises. This allows you to accumulate more of the asset at lower prices and sell portions at higher prices, profiting from the price oscillations within the defined range. Grid trading can be particularly effective in a sideways market where there is no clear long-term trend. However, it requires careful monitoring and adjustment of grid levels based on market conditions to minimize risks and maximize returns .
Configuring the Indicator :
Once the indicator is added, you will see a settings icon next to it. Click on it to open the settings menu.
Adjust the Upper Level , Lower Level , Entry Level , and Exit Level to match your trading strategy and market conditions.
Set the Levels Visibility to control how many bars back the levels will be plotted.
Interpreting the Levels :
Accumulation Levels : These are plotted below the entry level and are potential buy zones. They are labeled as Accumulation Level 1, 2, and 3.
Distribution Levels : These are plotted above the exit level and are potential sell zones. They are labeled as Distribution Level 1, 2, and 3.
Upper Level : Marked in fuchsia, indicating the top boundary of the trading range.
Exit Level : Marked in yellow, indicating the level at which you plan to exit trades.
Midpoint : Marked in white, indicating the average of the entry and exit levels.
Entry Level : Marked in yellow, indicating the level at which you plan to enter trades.
Lower Level : Marked in aqua, indicating the bottom boundary of the trading range.
By visualizing key levels, you can make informed decisions on where to place buy and sell orders, potentially maximizing your trading profits through systematic grid trading.

TRV & nTRV - Trimmed Range VolatilityGrid bots require stable volatility measurement - ATR becomes misleading when gaps and sudden spikes distort the average. TRV (Trimmed Range Volatility) is an advanced version of ATR: it filters outliers at the extremes (highest and lowest ranges) and remains unaffected by gaps. This provides real-time, accurate volatility measurement for grid bot setup.Grid bots require stable volatility measurement - ATR becomes misleading when gaps and sudden spikes distort the average. TRV (Trimmed Range Volatility) is an advanced version of ATR: it filters outliers at the extremes (highest and lowest ranges) and remains unaffected by gaps. This provides real-time, accurate volatility measurement for grid bot setup.
Why We Developed TRV?
When a gap or sudden spike occurs in the morning, this extreme movement affects standard ATR calculations for an extended period. Even if the price moves sideways for the rest of the day, ATR remains elevated. This causes grid bots to operate with unnecessarily wide spacing and execute fewer trades.
TRV Advantages:
✅ Unaffected by Gaps: Opening gaps don't distort the calculation
✅ Extreme Point Elimination: Filters the largest and smallest outlier candles
✅ Real-Time Accuracy: Shows current market volatility
✅ Grid Bot Optimization: Enables tighter and more efficient grid spacing
✅ Comparison Capability: Compare different stocks and timeframes with nTRV
Grid Bot Usage:
The TRV value is used directly to calculate the number of grid lines:
(Resistance - Support) / TRV = Number of Grid Lines
Example:
Resistance: $110
Support: $90
TRV: $2
Grid Count: (110-90)/2 = 10 grid lines
Features:
Two Filtering Modes: Manual (enter number) or Percentage-Based (automatic ratio)
Four Indicators in One: nTRV, TRV, ATR, and nATR all displayed on the same panel
nTRV: Normalized value (percentage-based, for stock comparison)
TRV: Absolute value (currency-based, for grid calculation)
ATR & nATR Included: Standard ATR and nATR for direct comparison with TRV
Comprehensive Analysis: Compare filtered (TRV) vs unfiltered (ATR) volatility side-by-side
Default: 10% top, 10% bottom outlier elimination
Conclusion:
TRV is an advanced version of ATR specifically designed for grid bot traders. By filtering outlier movements, it provides more stable and reliable volatility measurement. The indicator includes both TRV (filtered) and ATR (unfiltered) on the same chart, giving traders a comprehensive view to make informed decisions. This dual-display approach enables more efficient grid strategies and increased trading frequency.

Grid Bot Visualizer V1
📊 Grid Bot Visualizer – V1
A dynamic and visual support tool for grid trading strategies.
🔧 Key Features
• Fixed grid levels based on a central entry price
• Customizable spacing, number of levels, and range
• Color-coded lines (🟢 green above, 🔴 red below)
• Expands automatically when price exceeds boundaries (within the defined box)
• Optional price labels shown outside the grid
• Grid visually framed by a blue box
• Vertical line to mark grid origin
• Built-in alert when price hits a grid level
⚙️ Use Case
Ideal for visualizing grid bot logic in volatile markets.
Monitor how price interacts with predefined zones.
✅ Alert Ready
Use alertcondition to get notified when a grid level is touched.

Grid Strategy with MA0. Preface
Hello traders,
This is a strategy script that allows you to utilize a Grid Strategy using moving averages.
It is very simple, but I decided to post it because it was hard to find such shared open-source codes in Pine Script.
1. Main
This is a very simple trading method.
Based on the moving average line you set, if the price drops by a certain ATR (or percent) below it, you buy, and when it goes back up, you sell.
In basic settings, you choose the moving average line and its length, and decide how much to set the distance between each grid through the 'Band Multiplier/Percent' item.
I believe that it is advantageous to widen the bandwidth for stocks with strong upward momentum.
2. Conclusion
I have confirmed that this works better in the stock market than in the crypto market,
and that it is suitable for use on index stocks like NASDAQ because it follows trends.
In addition, through backtesting, I have confirmed that this grid strategy is more suitable for buying strategies than selling strategies, so I uploaded it as a strategy focused on buying strategies.
Personally, I have developed my own strategy by adjusting buying and selling strategies according to trends and managing risks.
I hope you can use this to create a script that suits you.
Thank you.