High Low of Close PriceCalculates highs and lows of the close line.
A quick high/low is determined with 0 candles on the right hand side, so it updates quickly.
A "true" high/low is determined by having 2 candles on either side (5 total), and then seeing if the center is a high or low.
Search in scripts for "high low"

Highs Lows and OpensThis script is an update to a lovely script by BURSATRENDBANDCHART
There original script gave Daily, Weekly and Monthly Highs but I loved the format
I required
Previous Days Highs and Lows
Previous Week High and Low
Previous Day Open
Previous Week Open
Hope this can be of use

High Low YearlySorry for the mess above. Not sure how to remove it. It was not what I was looking to post. I added the the clean chart below.
This was requested by "N". It displays the current yearly highs and lows along with the previous years highs and lows. Just a nice way to see the support resistance in all time frames.
High/Low Sweep Dashboard Heatmap/Table (Final v4)The High/Low Sweep Dashboard v6 is a versatile TradingView indicator that analyzes the past N candles to track how many times the high, low, both, or neither levels were taken out. It provides a clear visual summary through either a table or heatmap, with percentages for each category.
Key Features:
- Toggle between Table or Heatmap display.
- User-selectable dashboard position: Upper Right or Lower Right.
- Track sweep data over a custom number of candles.
- Optional markers on the chart for when both or none of the levels are taken.
- Clear percentage breakdowns for each sweep type.
This indicator is ideal for traders who want a quick overview of high/low sweeps and candle behavior over a defined historical window.

High/Low of Day/WeekDisplays stats collected from the configured start date and shows them in a table. In the first version, this shows the following distributions:
High/Low of the week formed during days (top right table)
High/Low of the day formed during configured sessions (middle right table)
High/Low of the week formed during configured sessions (bottom right table)
For the default settings (which contains the ICT Asian range and Kill zones), it's best used in 1-hour chart. If you're modifying the sessions, then make sure you use it on a timeframe which can fit all the enabled sessions. For example, if one of your sessions is 2-hour, but you're switching to a 4-hour chart, then the stats will contain errors and isn't reliable.

High, Low and MidpointThis indicator plots the daily high and low from the previous day. (BLACK)
It then calculates the midpoint of the high and low and plots this. (RED)
This indicator can be used to identify daily ranges and to identify possible support and resistance levels.

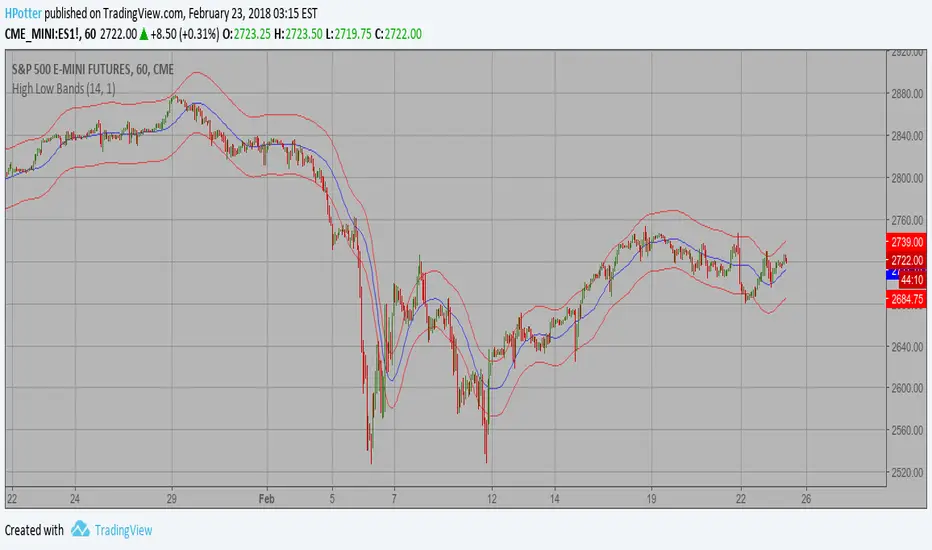
High Low Bands Strategy As the name suggests, High low bands are two bands surrounding the underlying’s
price. These bands are generated from the triangular moving averages calculated
from the underlying’s price. The triangular moving average is, in turn, shifted
up and down by a fixed percentage. The bands, thus formed, are termed as High
low bands. The main theme and concept of High low bands is based upon the triangular
moving average.
WARNING:
- This script to change bars colors.

High Low Bands As the name suggests, High low bands are two bands surrounding the underlying’s
price. These bands are generated from the triangular moving averages calculated
from the underlying’s price. The triangular moving average is, in turn, shifted
up and down by a fixed percentage. The bands, thus formed, are termed as High
low bands. The main theme and concept of High low bands is based upon the triangular
moving average.
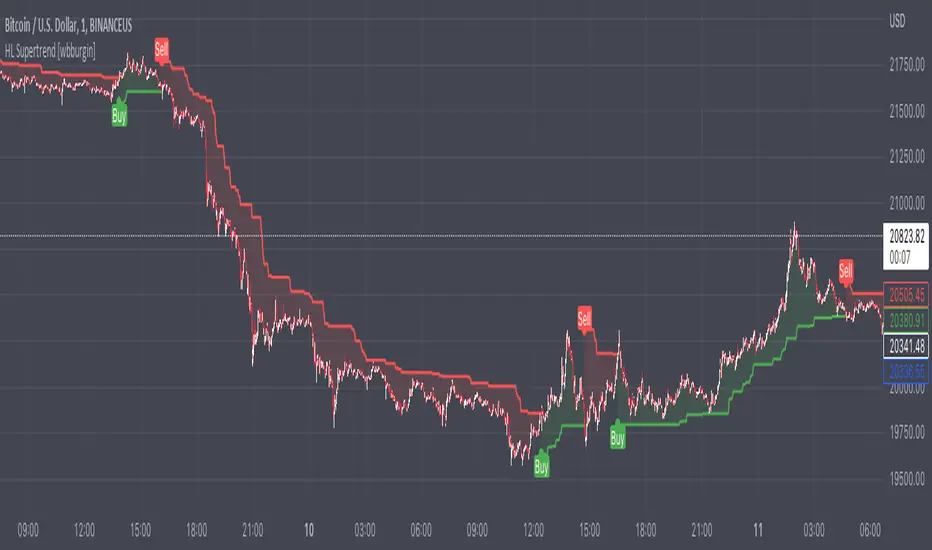
High/Low SupertrendThe High/Low supertrend uses an ATR produced from the highest and lowest points within the ATR lookback range, instead of from current highs and lows. This makes it less susceptible to false breakout attempts.
In the settings, you can choose whether you want the supertrend to calculate from the highest highs and lowest lows within the period, or the maxima of the opens and closes.
USAGE: I recommend using this supertrend as the arming mechanism to the buy or sell, instead of the trigger itself. This is because in ranging markets the supertrend will flip on the current high or current low.
High/Low meterUsing the new 'pinescript' array support to build an High/Low tunnel meter.
Using the Array to save only X HIGHEST HIGHS and Y LOWEST LOWS.
By the X and Y i build a tunnel - X is the top line (highs) and Y bottom line (lows)
Green - Up Trending
Red - Down Trending
Yellow - Reversal / drawback might occur.

High/Low Location Frequency [LuxAlgo]The High/Low Location Frequency tool provides users with probabilities of tops and bottoms at user-defined periods, along with advanced filters that offer deep and objective market information about the likelihood of a top or bottom in the market.
🔶 USAGE
There are four different time periods that traders can select for analysis of probabilities:
HOUR OF DAY: Probability of occurrence of top and bottom prices for each hour of the day
DAY OF WEEK: Probability of occurrence of top and bottom prices for each day of the week
DAY OF MONTH: Probability of occurrence of top and bottom prices for each day of the month
MONTH OF YEAR: Probability of occurrence of top and bottom prices for each month
The data is displayed as a dashboard, which users can position according to their preferences. The dashboard includes useful information in the header, such as the number of periods and the date from which the data is gathered. Additionally, users can enable active filters to customize their view. The probabilities are displayed in one, two, or three columns, depending on the number of elements.
🔹 Advanced Filters
Advanced Filters allow traders to exclude specific data from the results. They can choose to use none or all filters simultaneously, inputting a list of numbers separated by spaces or commas. However, it is not possible to use both separators on the same filter.
The tool is equipped with five advanced filters:
HOURS OF DAY: The permitted range is from 0 to 23.
DAYS OF WEEK: The permitted range is from 1 to 7.
DAYS OF MONTH: The permitted range is from 1 to 31.
MONTHS: The permitted range is from 1 to 12.
YEARS: The permitted range is from 1000 to 2999.
It should be noted that the DAYS OF WEEK advanced filter has been designed for use with tickers that trade every day, such as those trading in the crypto market. In such cases, the numbers displayed will range from 1 (Sunday) to 7 (Saturday). Conversely, for tickers that do not trade over the weekend, the numbers will range from 1 (Monday) to 5 (Friday).
To illustrate the application of this filter, we will exclude results for Mondays and Tuesdays, the first five days of each month, January and February, and the years 2020, 2021, and 2022. Let us review the results:
DAYS OF WEEK: `2,3` or `2 3` (for crypto) or `1,2` or `1 2` (for the rest)
DAYS OF MONTH: `1,2,3,4,5` or `1 2 3 4 5`
MONTHS: `1,2` or `1 2`
YEARS: `2020,2021,2022` or `2020 2021 2022`
🔹 High Probability Lines
The tool enables traders to identify the next period with the highest probability of a top (red) and/or bottom (green) on the chart, marked with two horizontal lines indicating the location of these periods.
🔹 Top/Bottom Labels and Periods Highlight
The tool is capable of indicating on the chart the upper and lower limits of each selected period, as well as the commencement of each new period, thus providing traders with a convenient reference point.
🔶 SETTINGS
Period: Select how many bars (hours, days, or months) will be used to gather data from, max value as default.
Execution Window: Select how many bars (hours, days, or months) will be used to gather data from
🔹 Advanced Filters
Hours of day: Filter which hours of the day are excluded from the data, it accepts a list of hours from 0 to 23 separated by commas or spaces, users can not mix commas or spaces as a separator, must choose one
Days of week: Filter which days of the week are excluded from the data, it accepts a list of days from 1 to 5 for tickers not trading weekends, or from 1 to 7 for tickers trading all week, users can choose between commas or spaces as a separator, but can not mix them on the same filter.
Days of month: Filter which days of the month are excluded from the data, it accepts a list of days from 1 to 31, users can choose between commas or spaces as separator, but can not mix them on the same filter.
Months: Filter months to exclude from data. Accepts months from 1 to 12. Choose one separator: comma or space.
Years: Filter years to exclude from data. Accepts years from 1000 to 2999. Choose one separator: comma or space.
🔹 Dashboard
Dashboard Location: Select both the vertical and horizontal parameters for the desired location of the dashboard.
Dashboard Size: Select size for dashboard.
🔹 Style
High Probability Top Line: Enable/disable `High Probability Top` vertical line and choose color
High Probability Bottom Line: Enable/disable `High Probability Bottom` vertical line and choose color
Top Label: Enable/disable period top labels, choose color and size.
Bottom Label: Enable/disable period bottom labels, choose color and size.
Highlight Period Changes: Enable/disable vertical highlight at start of period

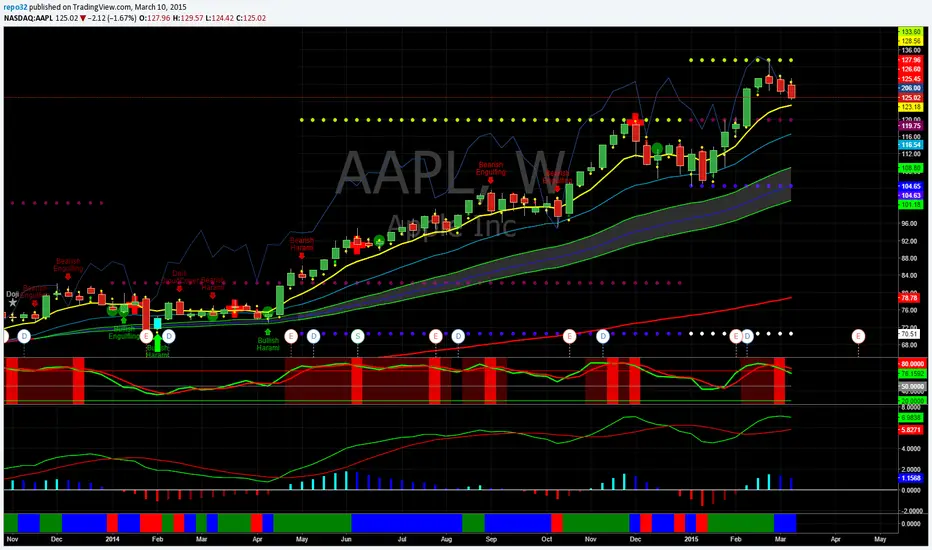
High-Low-Avg Plot (1D)This script aims to plot the High, Low, Average (of High+Low+Close) for past 14 days of an index/a stock to provide certain levels in trading

High Low Color VolumeCompanion to High Low Color Bars, for strategies that don't use open and close levels. Color is determined using change in midpoints between high and low ( hl2 ), with degrees of shading based on threshold levels in the settings. The default threshold is 1.2 standard deviations of the change in hl2.
I use this to get a less noisy visual of volume-driven momentum.

High-Low CandleSimplified trading with only High Low candles. It uses CCI for trade selection and filtering. Use it either in normal candle mode or better in Heikin Ashi mode. Recommend using standard Stochastics and CCI 20 indicators to learn usage and behaviors.
Trading rules and color legend:
Teal (Green): Long
Red: Short
Grey/Silver: No trade zone, Indecisive candle
Yellow: Potential trend change (Outside Bar) needs confirmation on either side
Purple: Extreme momentum (CCI above 195/below -195) . Alert for reversal possibilities and divergences
Trading recommendations:
When color transitions from Grey or Purple or Red to Green - Enter long above high of this green candle
When color transitions from Grey or Purple or Green to Red enter short below low of this Red candle
Exit trade on 2 consecutive Red bars (for long) and Green bars (for Short) or Super Trend changes direction
Additionally can use Stochastics, CCI (and VWAP for shorter time frames) for validation/confirmation.
Thank you for looking this up. This is my first publish of an indicator/pine script so please judge me kindly! Happy trading.

High-Low- Signal (Expo)High-Low-Signal (Expo)
DESCRIPTION
This simple but powerful High-Low indicator plots price extremes. Either it’s an exhausting sign or a continuation sign of the trend. The color of the cloud determines the trend, and the height of the peaks determines the strength in the price moves. You can easily compare current peaks with historical ones to understand the current dynamics and what might happen next.
This indicator is a must if you want to understand price dynamics in the market. The indicator is perfect to combine with other indicators to confirm the signal.
For example:
Combine it with trend lines/Channels/Bollinger Band, you name it! If the indicator peaks in conjunction with that the price reaches a trend line/Channels/Bollinger Band. It's a great sign!
HOW TO USE
1. Look for a signal
2. Identify the color and height of the peak. Compare it to historical ones to get an understanding of the current market dynamics.
3. Combine the indicator with e.g. trend lines/Channels/Bollinger Band
4. Consider Enter the market.
INDICATOR IN ACTION
BTCUSD
BTCUSD
BTCUSD
Wall Street
EURJPY
EURUSD
GOLD
I hope you find this indicator useful , and please comment or contact me if you like the script or have any questions/suggestions for future improvements. Thanks!
I will continue to work on this indicator, so please share your experience and feedback with me so that I can continuously improve it. Thanks to everyone that have contacted me regarding my scripts. Your feedback is valuable for future developments!
ACCESS THE INDICATOR
• Contact me on TradingView or use the links below
-----------------
Disclaimer
Copyright by Zeiierman.
The information contained in my scripts/indicators/ideas does not constitute financial advice or a solicitation to buy or sell any securities of any type. I will not accept liability for any loss or damage, including without limitation any loss of profit, which may arise directly or indirectly from use of or reliance on such information.
All investments involve risk, and the past performance of a security, industry, sector, market, financial product, trading strategy, or individual’s trading does not guarantee future results or returns. Investors are fully responsible for any investment decisions they make. Such decisions should be based solely on an evaluation of their financial circumstances, investment objectives, risk tolerance, and liquidity needs.
My scripts/indicators/ideas are only for educational purposes!

High/Low Breaker v2Specify Candles back to determine if high/low has been broken. Can choose to either calculate with source of high/low or close.

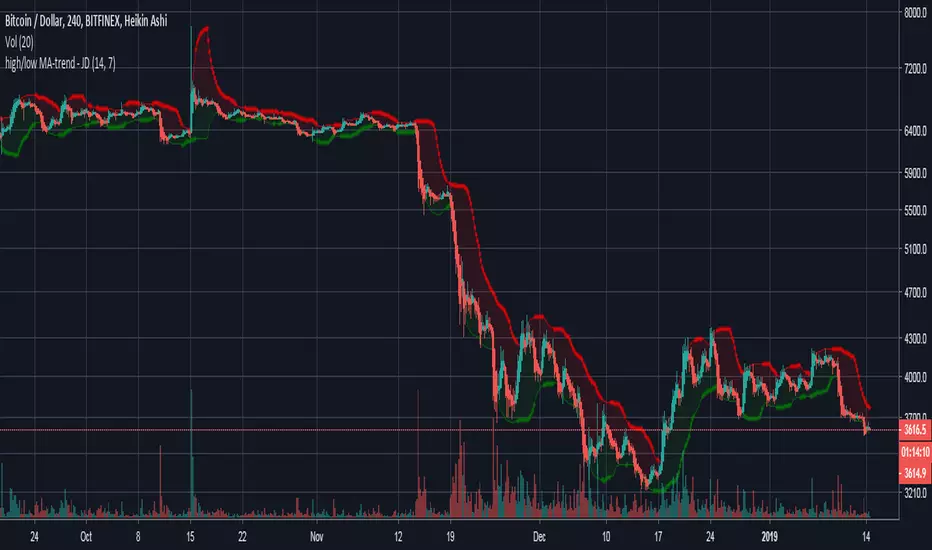
high/low MA-trend - JDShort script for trend indication taking a moving average of the highs and the lows seperately.
Lookback period for the highs/lows can be altered.
Ema length can be altered.
JD.
[M]HLC PlotsHLC Plots
Draws points (lines) to high low and close. In some trading situations, this method is more convenient than candles or bars.
--------------------------------------
Рисует точки(линии) по high low и close. В некоторых ситуациях торговли такой способ бывает удобней, чем свечи или бары. На вкус и цвет все фломастеры разные =)

High/Low Digit SumNAMAN SHAH
Its about the high low total of a candle only for gold where if highs total is 9 then its a chance that it will not break the high for a long time and it will be a good opportunity for short
And vise versa

High Low LinesThis script allows you to see a line graph of the highs and lows. Useful for drawing trend lines.


High/Low Premarket & Previous Day This scripts adds lines for previous day and premarket high/low with labels that you can toggle on and off. The lines extend through current premarket and trading session

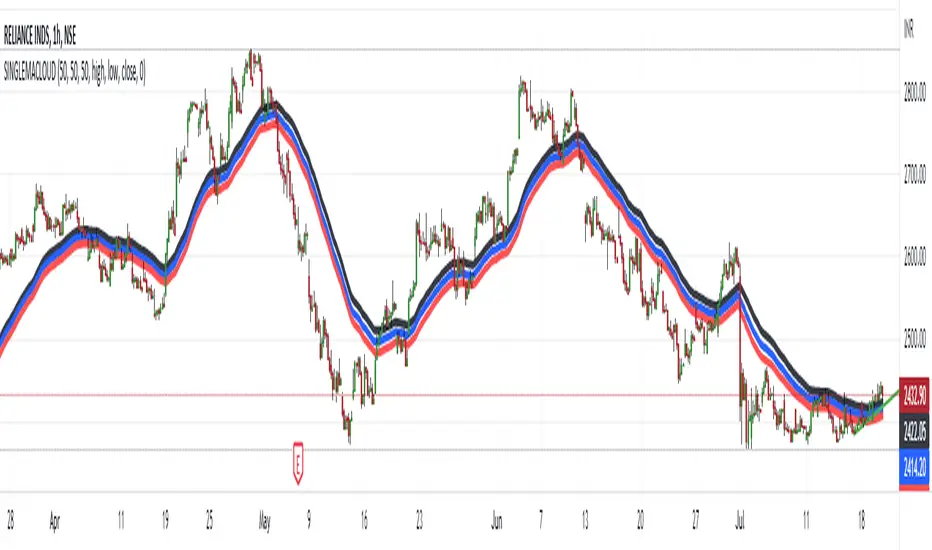
HIGH LOW CLOSE Moving Average ExponentialThe Script is prepared for testing purpose the Added single indicator for getting high low and close.