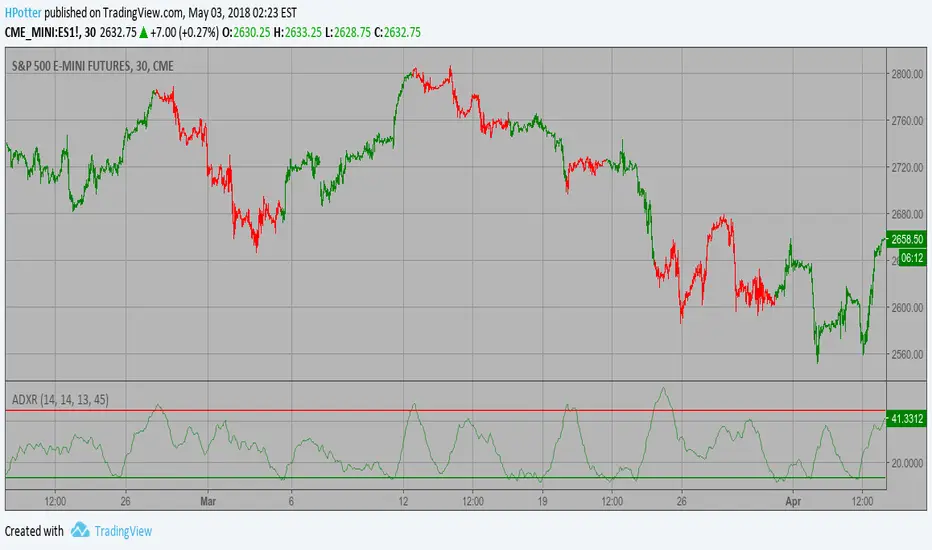
Average Directional Movement Index Rating Backtest The Average Directional Movement Index Rating (ADXR) measures the strength
of the Average Directional Movement Index (ADX). It's calculated by taking
the average of the current ADX and the ADX from one time period before
(time periods can vary, but the most typical period used is 14 days).
Like the ADX, the ADXR ranges from values of 0 to 100 and reflects strengthening
and weakening trends. However, because it represents an average of ADX, values
don't fluctuate as dramatically and some analysts believe the indicator helps
better display trends in volatile markets.
You can change long to short in the Input Settings
WARNING:
- For purpose educate only
- This script to change bars colors.
Search in scripts for "index"

Average Directional Movement Index Rating Strategy The Average Directional Movement Index Rating (ADXR) measures the strength
of the Average Directional Movement Index (ADX). It's calculated by taking
the average of the current ADX and the ADX from one time period before
(time periods can vary, but the most typical period used is 14 days).
Like the ADX, the ADXR ranges from values of 0 to 100 and reflects strengthening
and weakening trends. However, because it represents an average of ADX, values
don't fluctuate as dramatically and some analysts believe the indicator helps
better display trends in volatile markets.
WARNING:
- This script to change bars colors.
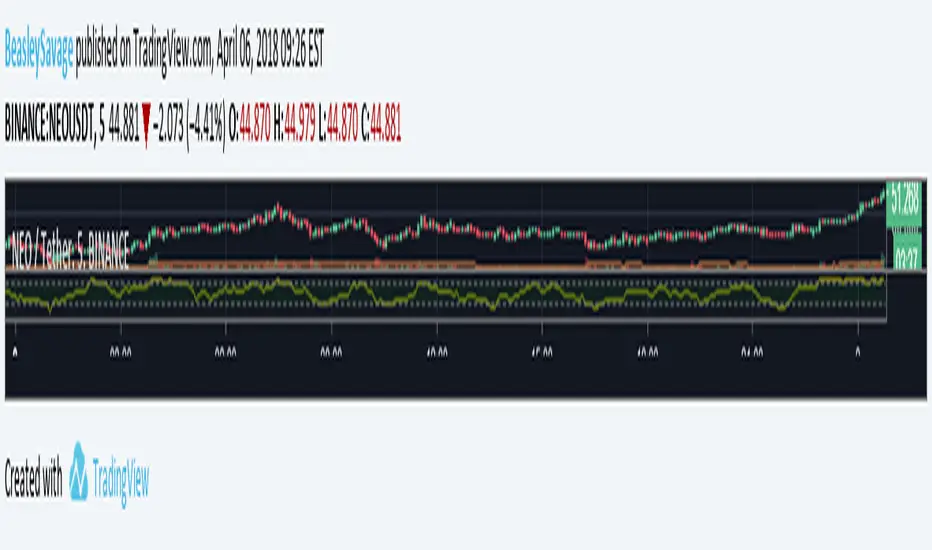
Money Flow Index - Beasley SavageThe Money Flow Index indicator (MFI) is a tool used in technical analysis for measuring buying and selling pressure. This is done through analyzing both price and volume. The MFI's calculation generates a value that is then plotted as a line that moves within a range of 0-100, making it an oscillator. When the MFI rises, this indicates an increase in buying pressure. When it falls, this indicates an increase in selling pressure. The Money Flow Index can generate several signals, most notably: overbought and oversold conditions, divergences, and failure swings.
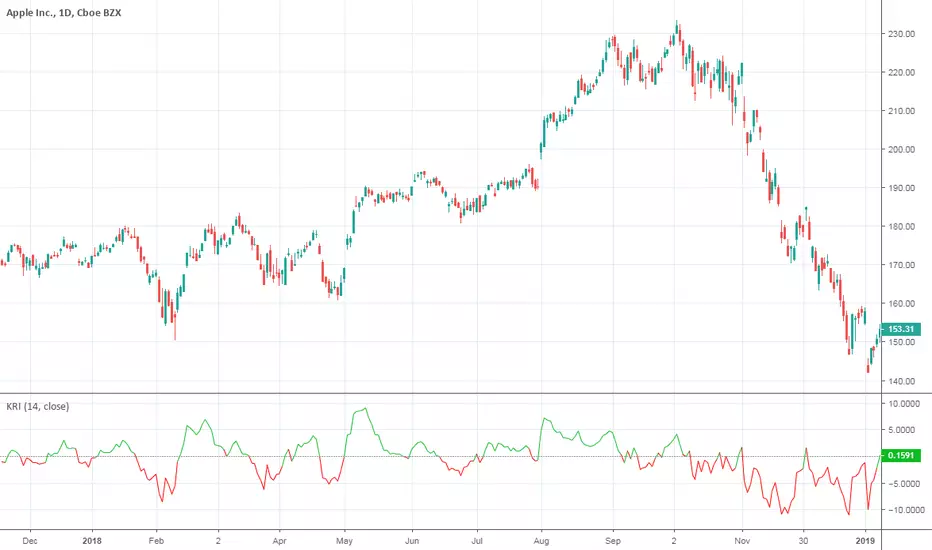
Kairi Relative IndexKairi Relative Index indicator script. The Kairi Relative index is an old Japanese metric with unknown origins.
Dual Ulcer Divergence Index [DW]This study is an experimental variation of Peter Martin's Ulcer Index built using the framework of my Dual Ulcer Index indicator.
In this version, the difference between the long and short UI is calculated.
This index is a measure of volatility and momentum that can be used to locate low risk trading opportunities.
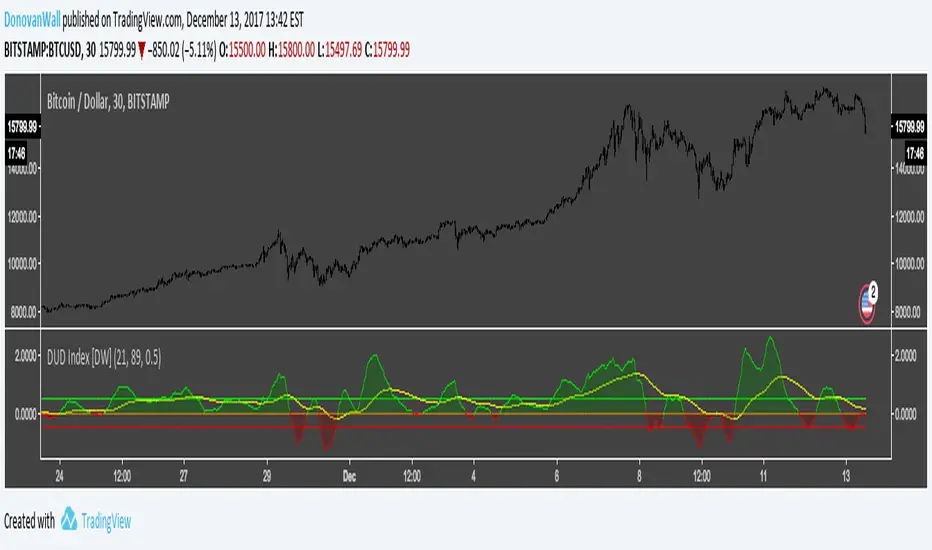
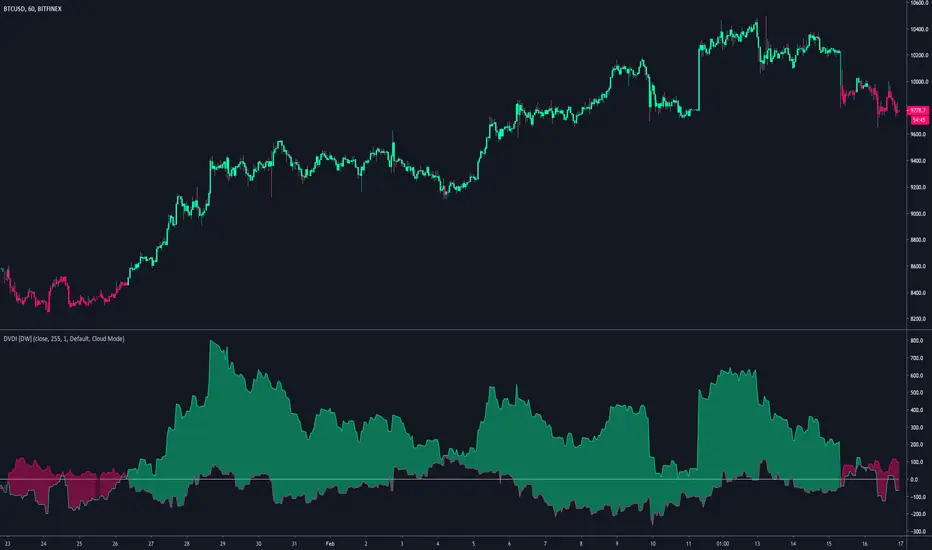
Dual Volume Divergence Index [DW]This is an experimental variation of Paul L. Dysart's Positive Volume Index and Negative Volume Index that tracks the divergences between the PVI and its EMA, and the NVI and its EMA, then plots both together for comparison.
This tool can be used to identify trending price activity.
Dual Ulcer Index [DW]This study is an experimental variation of Peter Martin's Ulcer Index that calculates the risk measures in the long and short direction for comparison.
The index is a measure of volatility that can be used to locate low risk trading opportunities.

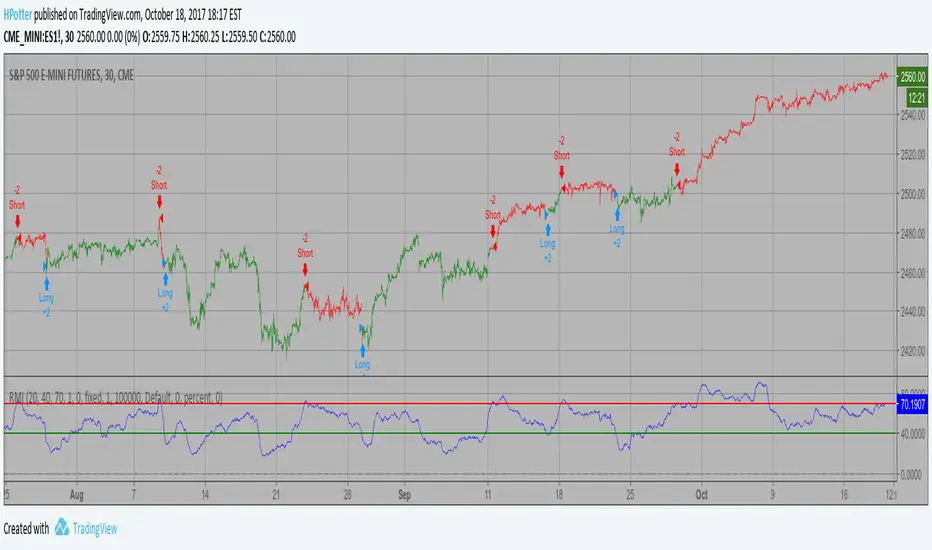
Relative Momentum Index Backtest The Relative Momentum Index (RMI) was developed by Roger Altman. Impressed
with the Relative Strength Index's sensitivity to the number of look-back
periods, yet frustrated with it's inconsistent oscillation between defined
overbought and oversold levels, Mr. Altman added a momentum component to the RSI.
As mentioned, the RMI is a variation of the RSI indicator. Instead of counting
up and down days from close to close as the RSI does, the RMI counts up and down
days from the close relative to the close x-days ago where x is not necessarily
1 as required by the RSI). So as the name of the indicator reflects, "momentum" is
substituted for "strength".
You can change long to short in the Input Settings
WARNING:
- For purpose educate only
- This script to change bars colors.
Relative Momentum Index Strategy The Relative Momentum Index (RMI) was developed by Roger Altman. Impressed
with the Relative Strength Index's sensitivity to the number of look-back
periods, yet frustrated with it's inconsistent oscillation between defined
overbought and oversold levels, Mr. Altman added a momentum component to the RSI.
As mentioned, the RMI is a variation of the RSI indicator. Instead of counting
up and down days from close to close as the RSI does, the RMI counts up and down
days from the close relative to the close x-days ago where x is not necessarily
1 as required by the RSI). So as the name of the indicator reflects, "momentum" is
substituted for "strength".
WARNING:
- This script to change bars colors.

MASS Index Backtest The Mass Index was designed to identify trend reversals by measuring
the narrowing and widening of the range between the high and low prices.
As this range widens, the Mass Index increases; as the range narrows
the Mass Index decreases.
The Mass Index was developed by Donald Dorsey.
You can change long to short in the Input Settings
WARNING:
- For purpose educate only
- This script to change bars colors.

MASS Index Strategy The Mass Index was designed to identify trend reversals by measuring
the narrowing and widening of the range between the high and low prices.
As this range widens, the Mass Index increases; as the range narrows
the Mass Index decreases.
The Mass Index was developed by Donald Dorsey.
WARNING:
This script to change bars colors.

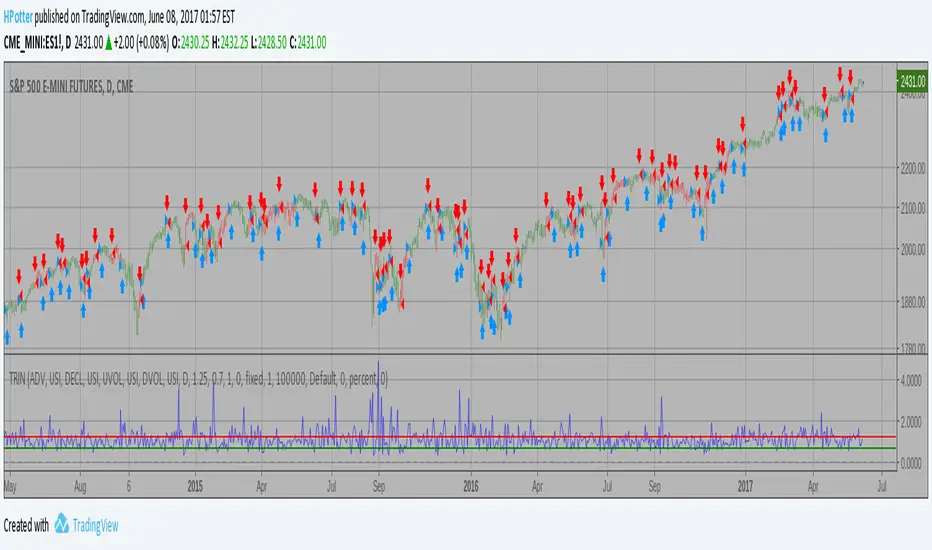
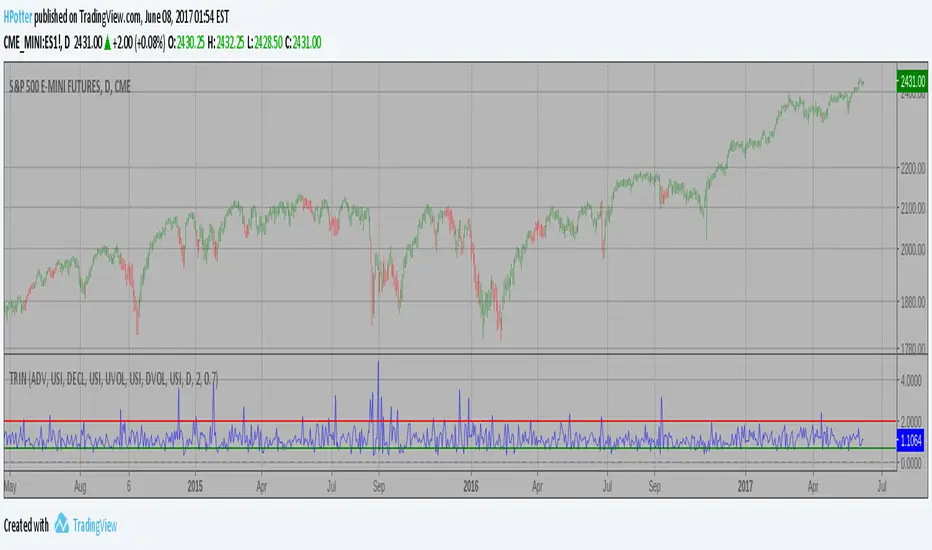
Arms Index (TRIN) Backtest The Arms index (TRIN) is a technical analysis indicator that compares advancing
and declining stock issues and trading volume as an indicator of overall market
sentiment. It measures the relationship between market supply and demand and is
used as a predictor of future price movements in the market, primarily on an
intraday basis. The Arms index seeks to provide a more dynamic explanation of
overall movements in the composite value of stock exchanges, such as the NYSE or
NASDAQ, by analyzing the strength and breadth of these movements.
You can change long to short in the Input Settings
Please, use it only for learning or paper trading. Do not for real trading.
Arms Index (TRIN) Strategy The Arms index (TRIN) is a technical analysis indicator that compares advancing
and declining stock issues and trading volume as an indicator of overall market
sentiment. It measures the relationship between market supply and demand and is
used as a predictor of future price movements in the market, primarily on an
intraday basis. The Arms index seeks to provide a more dynamic explanation of
overall movements in the composite value of stock exchanges, such as the NYSE or
NASDAQ, by analyzing the strength and breadth of these movements.
GMMA IndexThe GMMA index is the EMA line position count.
The GMMA feature value visualization.
Long index equal 5 and short equal equal -5 is buy timing.
Long index equal -5 and short equal equal 5 is sell timing.
Japanese articles
mt4program.blogspot.jp

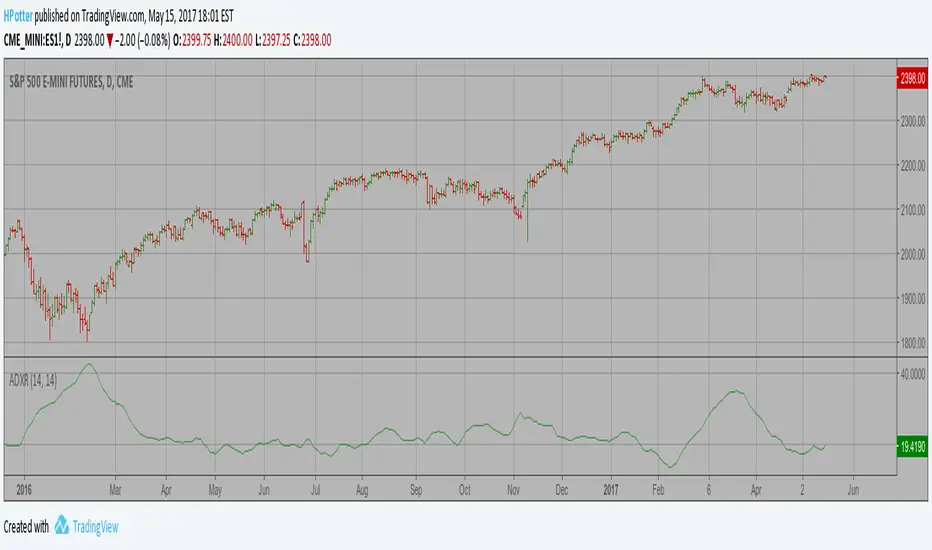
Average Directional Movement Index Rating The Average Directional Movement Index Rating (ADXR) measures the strength
of the Average Directional Movement Index (ADX). It's calculated by taking
the average of the current ADX and the ADX from one time period before
(time periods can vary, but the most typical period used is 14 days).
Like the ADX, the ADXR ranges from values of 0 to 100 and reflects strengthening
and weakening trends. However, because it represents an average of ADX, values
don't fluctuate as dramatically and some analysts believe the indicator helps
better display trends in volatile markets.
Arms Index (TRIN) The Arms index (TRIN) is a technical analysis indicator that compares advancing
and declining stock issues and trading volume as an indicator of overall market
sentiment. It measures the relationship between market supply and demand and is
used as a predictor of future price movements in the market, primarily on an
intraday basis. The Arms index seeks to provide a more dynamic explanation of
overall movements in the composite value of stock exchanges, such as the NYSE or
NASDAQ, by analyzing the strength and breadth of these movements.

Traders Dynamic Index Indicator Alert v0.1 by JustUncleLThis is a trend trading indicator+alert utilising the Traders Dynamic Index (TDI), Price Action Channel (PAC) and Heikin Ashi candles.
About 6months ago I came across the use of TDI in "E.A.S.Y. Method" that I found in forexfactory forums: www.forexfactory.com
and I was able to set up a chart based on the specifications by using Kurbelklaus scripts. However, I found that the alerts were being generated one or two bars too late, so at that time I was not successful using it with Binary Options. A few months later I found a variation of the method in the forecfactory forums which is able to generate the alerts a bit earlier, so this indicator is a modification of that early detection version.
The indicator can optionally use Heikin Ashi candles only for all it's calculation. I would recommend viewing the chart with Heikin Ashi candles, these smooth out the trends and makes trends very clear.
I found that this method it works good with most currency pairs or commodities and with 5min+ timeframe charts. I would suggest expiry of 2 to 6 candles.
ALERT GENERATION:
=================
The TDI (Traders Dynamic Index)
---------------------------------------------
Volatility Band VB(34), color: Blue, buffer: UpZone, DnZone
Relative Strength Index RSI(13)
RSI PRICE LINE (2), color: Green, buffer: mab
RSI TRADE SIGNAL LINE (7), color: Red, buffer: mbb
MARKET BASE LINE MID VB(34), color: Orange, buffer: mid
Indicator SignalLevels:
-------------------------------
RSI_OversoldLevel : 22 (normally: 32)
RSI_OverboughtLevel : 78 (normally: 68)
Alert Conditions:
-----------------------
Strong Buy : yellow
Medium Buy : aqua
Weak Buy : blue
Strong Sell : fuchsia
Medium Sell : purple
Weak Sell : black
Hints on How to use:
----------------------------
- When a Medium or Strong alert is generated and MACD histogram colour matches the direction
of the alert (optional auto filter), then place trade in direction of alert candle and MACD.
- I use the multi-Hull MA's for overall trend direction confirmation.
- Best positions normally occur near the MACD(5,15,1) Histogram crossing the zero line.
- The optional coloured Dots along the bottom of the indicator represent the first alert
of this type that was generated in this sequence.
- It is advisable to trade in the direction of the main trend as indicated the HULL MA red cloud:
if red cloud underneath PAC then BULLISH trend, if red cloud above PAC then BEARISH trend.
- Selecting the HeiKin Ashi candles does affect the MACD and MA caculations, so if you select
normal candles the result chart will change. You can still Optionally select to use Heikin Ashi
for calculations.
- When using the Heikin Ashi candles, a good buy entry is indicated by long top wick and no bottom wick
for bull (green) candles and good sell entry is indicated by long bottom wick and no top wick for
bear (red) candles.
- When the MACD histogram is flat and close to zero line,
this indicates a ranging market, do NOT trade when this occurs.
- When the PAC channel on the main chart is spread apart widely, this is an indication
of extreme volatility and choppy chart, do NOT try to trade during these periods.
A choppy chart is also indicated by Heikin Ashi candles with long wicks on both sides
of the candles.
- You can specify what strength level Alerts are generated (default 2):
Level (1) means only generate Strong Alerts only.
Level (2) means generate Strong and Medium Alerts.
Level (3) means generate Strong, Medium and Weak Alerts.

Relative Vigour Index (RVI). EhlersRelative Vigor Index - RVI
------------------------------------
An indicator used in technical analysis that measures the conviction of a recent price action and the likelihood that it will continue. The RVI compares the positioning of a security's closing price relative to its price range, and the result is smoothed by calculating an exponential moving average of the values.
The RVI indicator is calculated in a similar fashion to the stochastic oscillator, but the vigor index compares the close relative to the open rather than to the low.
Traders expect the RVI value to grow as the bullish trend gains momentum because in this type of environment, a security's closing price tends to be at the top of the range while the open is near the low of the day.
Usage Example: www.investopedia.com

Pip Foundry - BitMEX BVOL7D IndexMy premium indicators are available for monthly lease at www.tradingview.com
A quick indicator in response to the product released this month from BitMEX - a Weekly settled volatility index for bitcoin!
www.bitmex.com
uses BVOL calculation from www.bitmex.com

Absolute Strength Index Oscillator [LazyBear]This oscillator is derived from Absolute Strength Index, originally developed by Tudor Marcelin (Art Invest).
I made it an oscillator mainly to make it easy to identify the divergences and price-flows. There is not much documentation available online for Absolute Strength Index afaik, lets hope Mr.Tudor comes across this and provides us a detailed writeup :)
Quick testing showed lots of good signals (with minimal lag). Let me know what you guys find in your testing.
Indicator options support coloring bars based on the oscillator/signal values, and a histogram-only mode.
List of my public indicators: bit.ly
List of my app-store indicators: blog.tradingview.com

Pip Foundry - BitMEX BVOL24H IndexCourtesy of Pip - uses BVOL calculation from www.bitmex.com
P = Bitfinex Last Price (taken at 5 minute intervals)
Stdev = Sample Standard Deviation
Ln = Natural Logarithm
Sqrt = Square Root
.BVOL Index = Stdev(Ln(P1/P0), Ln(P2/P1), ..., Ln(P288/P287))
* Sqrt(288)

Momentum of Relative strength to Index Leaf_West styleMomentum of Relative Strength to index as used by Leaf_West. This is to be used with the companion Relative Strength to Index indicator Leaf_West Style. Make sure you use the same index for comparison. If you follow his methods be aware of the different moving averages for the different time periods. From Leaf_West: "on my weekly and monthly R/S charts, I include a 13 EMA of the R/S (brown dash line) and an 8 SMA of the 13 EMA (pink solid line). The indicator on the bottom of the weekly/monthly charts is an 8 period momentum indicator of the R/S line. The red horizontal line is drawn at the zero line.
For daily or 130-minute time periods (or shorter), my R/S charts are slightly different - the moving averages of the R/S line include a 20EMA (brown dash line), a 50 EMA (blue dash line) and an 8 SMA of the20 EMA (pink solid line). The momentum indicator is also slightly different from the weekly/monthly charts – here I use a 12 period calculation (vs 8 SMA period for the weekly/monthly charts)." Leaf's methods do evolve and so watch for any changes to the preferred MAs etc..

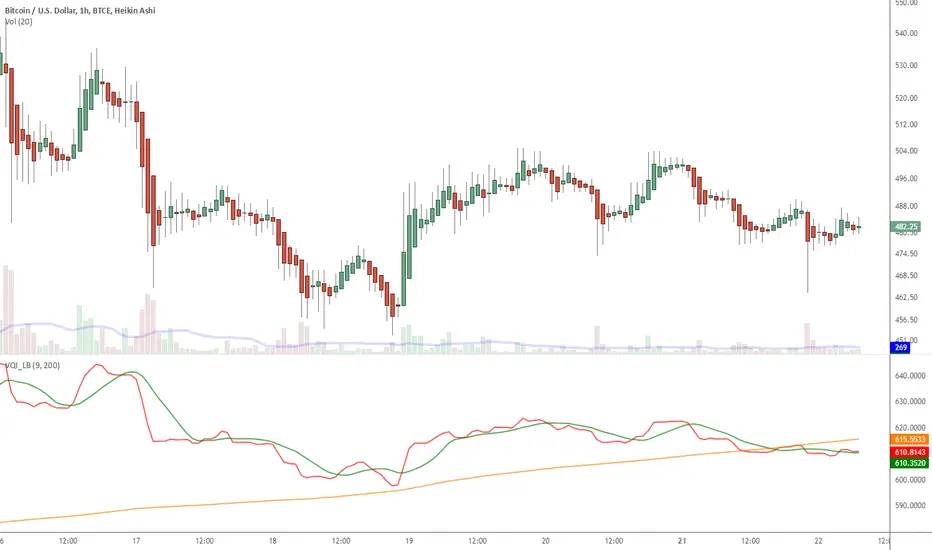
Indicator: Volatility Quality Index [VQI]Volatility Quality Index (VQI), by Thomas Stridsman, points out the difference between bad and good volatility in order to identify better trade opportunities in the market.
This plots 3 lines:
- Red line is the VQI (actually, sum of VQI).
- Green line is the 9-period SMA of sum_of_VQI.
- Orange line is the 200-period SMA of sum_of_VQI.
Stridsman suggested to buy when VQI has increased in the previous 10 bars (use the SMAs) and sell when it has decreased in the previous 10 bars. IMO, use this with your other indicators as a confirmation signal.
More info: www.3pips.com
To use this indicator in your charts, click on "Share" button (top right on the chart). Click on "Make it mine" button on the dialog that pops up. Now, you will have a copy of this chart with the indicator's source code in it. Click on "{}" to open the source code of VQI_LB and save it to your custom scripts section.