chentz MACDAn adaptation of MACD. I added:
- Zero line cross signal
- MACD/Signal line cross signals with arrows
- Max/Min lines threshold
Theoretical foundation is from goo.gl
Search in scripts for "macd"
MACD-v Bullish/Bearish DivergenceMACD-v Bullish/Bearish Divergence
Overview This indicator is a specialized divergence detector based on the MACD-v (Volatility Normalized Momentum) concept. Unlike standard MACD which uses absolute price differences, MACD-v normalizes values against volatility (ATR), allowing for fixed, universal Overbought/Oversold thresholds across all assets and timeframes.
Recommendation: This script is highly effective when paired with the original MACD-v by Alex Spiroglou. While this indicator focuses on identifying and visualizing divergence entries, using the original oscillator alongside it provides the best visual context for the overall momentum structure.
How It Works
This tool uses a dual-signal mechanism (Raw Line + Signal Smooth) to identify specific divergence setups:
Setup (Yellow/Blue Dots): Identifies when price momentum has extended significantly into extreme zones (Overbought/Oversold).
Trigger (Red/Green Dots): Fires when price fails to make a new momentum extreme despite price action (classic divergence/failure swing).
Active State (Background Color): Once a trigger fires, the background highlights (Red for Bearish, Green for Bullish) to indicate an active divergence play.
Reset (Exit): The signal state clears when momentum returns to the neutral "safe zone."
Important Note: Momentum Washout
The colored background persists as long as the divergence trade remains valid. Traders should note the concept of "Momentum Washout":
Signal End: The background color turns off when the MACD returns to the neutral range, indicating the primary high-velocity impulse is over.
Performance Continuation: Significant positive or negative price performance can often continue even after the background signal ends. This period allows the remaining momentum to "wash out" or drift before the next major impulse.
Strategy Tip: The indicator is designed to capture the high-volatility portion of the reversal. Do not assume the end of the signal is the absolute top or bottom of the trend; it simply marks the normalization of momentum.
Strategy Recommendation: Multi-Timeframe Analysis
Divergence signals are most powerful when confirmed across timeframes. It is highly recommended to look for alignment before taking a trade:
Trend Confirmation: If you see a signal on a lower timeframe (e.g., 5m or 15m), check a higher timeframe (e.g., 1H or 4H). A bullish divergence on the 5m is significantly more reliable if the 1H momentum is already bullish or oversold.
Signal Stacking: Valid signals often appear sequentially—first on the 1m, then the 5m, and finally the 15m. Waiting for this "cascade" can filter out false reversals.
Visual Guide
🔵 Blue Dot: Bullish Divergence Setup (Watch for entry).
🟢 Green Dot: Bullish Divergence Trigger (Long Entry).
🟡 Yellow Dot: Bearish Divergence Setup (Watch for entry).
🔴 Red Dot: Bearish Divergence Trigger (Short Entry).
Background Color: Indicates an active trade (Red = Bearish / Green = Bullish).
Settings
Auto-Detect: Automatically switches between Scalping settings (tighter thresholds) for low timeframes and Swing settings for high timeframes.
Strict Invalidation: If enabled, cancels a setup if momentum pushes too far in the opposite direction before triggering.
Active Signal Multiplier: Dynamically smooths the signal line only when a trade is active to prevent premature exits during choppy corrections.
Disclaimer: This tool is for educational purposes and trend analysis only. Always manage your risk appropriately.

MACD Classic MT5 Style (2 Lines + Histogram)MACD Classic MT5 Style (แบบ MetaTrader 5) มีความแตกต่างจาก MACD ทั่วไปที่ใช้กันใน TradingView พอสมควรครับ นี่คือคำอธิบายว่ามันทำงานอย่างไรและอ่านค่าอย่างไรครับ:
1. ความแตกต่างสำคัญ (Key Difference)
MACD ทั่วไป (Standard):
มี 2 เส้น (เส้น MACD และ เส้น Signal)
ฮิสโตแกรม (แท่งกราฟ) คือ ส่วนต่าง (Gap) ระหว่าง 2 เส้นนั้น
MACD แบบ MT5 (Classic MT5):
เส้น MACD จะถูกวาดออกมาเป็น แท่งกราฟ (Histogram) แทนที่จะเป็นเส้น
เส้น Signal จะเป็น เส้น (Line) สีแดงพาดผ่านแท่งกราฟ
สรุปคือ: ในแบบ MT5 แท่งกราฟคือตัวพระเอก (MACD) ส่วนเส้นคือตัวช่วยกรอง (Signal)
Here is the English translation of the explanation:
MACD Classic MT5 Style vs. Standard MACD
The "Classic MT5 Style" MACD differs significantly from the standard MACD typically found on TradingView. Below is an explanation of its mechanics and how to interpret it.
1. Key Differences
Standard MACD (TradingView Default):
Displays 2 Lines (MACD Line and Signal Line).
The Histogram represents the difference (gap) between those two lines.
MT5 Style MACD (Classic):
The MACD value is plotted as a Histogram (bars) instead of a line.
The Signal Line appears as a standard Line (usually red) overlaying the histogram.
In summary: In the MT5 style, the Histogram represents the actual MACD Line, while the separate line acts as the Signal filter.

Divergence Detector (MACD + Volume)Divergence Detector (MACD + Volume Confirmation)
This indicator automatically detects bullish and bearish divergences between price and MACD, enhanced with volume confirmation to filter out weak signals.
🔹 Core Logic
Pivot Detection:
The script identifies swing highs and lows (pivots) using customizable left/right lookback values.
Bullish Divergence:
Occurs when price makes a lower low, but MACD makes a higher low.
A label "Bull Div" appears below the bar; if confirmed by high volume, it shows "Bull Div 🔥".
Bearish Divergence:
Occurs when price makes a higher high, but MACD makes a lower high.
A label "Bear Div" appears above the bar; if confirmed by high volume, it shows "Bear Div 📉".
Volume Confirmation:
The indicator checks whether the volume at the pivot bar is above the moving average of volume (customizable length).
This ensures that divergence signals are backed by strong market participation.
Inputs
MACD Fast/Slow/Signal Length – standard MACD parameters
Pivot Lookback Left/Right – defines the swing structure sensitivity
Volume MA Length – defines how volume strength is validated
Output
Labels:
🔹 Bull Div / Bull Div 🔥 → Bullish divergence (confirmed with volume)
🔹 Bear Div / Bear Div 📉 → Bearish divergence (confirmed with volume)
Tips
Works best on higher timeframes and trending markets.
Volume confirmation helps filter false divergences in low liquidity conditions.
Combine with trend or structure indicators for better trade setups.
----------------------------------------------------------------------------------------------
اندیکاتور شناسایی واگرایی MACD با تأیید حجم
این اندیکاتور بهصورت خودکار واگراییهای صعودی و نزولی بین قیمت و MACD را شناسایی کرده و با استفاده از تأیید حجم (Volume Confirmation) سیگنالهای ضعیف را فیلتر میکند.
🔹 منطق عملکرد
شناسایی پیوتها:
نقاط چرخش (سقف و کف) با استفاده از تعداد کندلهای قابل تنظیم در دو سمت شناسایی میشوند.
واگرایی صعودی (Bullish):
زمانی که قیمت کف پایینتر و MACD کف بالاتر میسازد.
برچسب "Bull Div" در زیر کندل نمایش داده میشود؛ اگر حجم بالا باشد، با علامت 🔥 مشخص میگردد.
واگرایی نزولی (Bearish):
زمانی که قیمت سقف بالاتر و MACD سقف پایینتر میسازد.
برچسب "Bear Div" در بالای کندل نمایش داده میشود؛ اگر حجم بالا باشد، با 📉 مشخص میگردد.
تأیید حجم:
اگر حجم در کندل پیوت بالاتر از میانگین متحرک حجم باشد، سیگنال معتبرتر در نظر گرفته میشود.
تنظیمات ورودی
تنظیمات MACD (Fast, Slow, Signal)
پارامترهای شناسایی پیوت (Left / Right)
طول میانگین متحرک حجم (Volume MA Length)
خروجیها
Bull Div 🔥 / Bear Div 📉 برای واگراییهای تأییدشده با حجم
Bull Div / Bear Div برای واگراییهای بدون تأیید حجم
نکات کاربردی
بهترین عملکرد در تایمفریمهای بالا و بازارهای دارای روند
تأیید حجم به حذف سیگنالهای اشتباه در شرایط حجم پایین کمک میکند
برای دقت بیشتر، آن را با اندیکاتورهای روند یا ساختار ترکیب کنید
⚠️ Disclaimer:
This script is provided for educational and informational purposes only.
It does not constitute financial advice, and the author is not responsible for any financial losses caused by its use.
Always confirm signals with your own analysis and other tools before making trading decisions.
⚠️ توجه:
این اسکریپت صرفاً جهت آموزش و اطلاعرسانی طراحی شده و توصیه مالی یا سرمایهگذاری محسوب نمیشود.
نویسنده مسئول هیچگونه ضرر یا زیان احتمالی ناشی از استفاده از آن نیست.
لطفاً پیش از هر تصمیم معاملاتی، تحلیل شخصی خود را انجام داده و از این ابزار در کنار سایر ابزارهای تحلیل و مدیریت ریسک استفاده کنید.

MACD crossover while RSI Oversold/Overbought# MACD Crossover with RSI Overbought/Oversold Indicator Explained
## Indicator Overview
This is a trading signal system that combines two classic technical indicators: **MACD (Moving Average Convergence Divergence)** and **RSI (Relative Strength Index)**. Its core logic is: MACD crossover signals are only triggered when RSI is in extreme zones (overbought/oversold), thereby filtering out many false signals and improving trading accuracy.
## Core Principles
### 1. **Dual Confirmation Mechanism**
This indicator doesn't use MACD or RSI alone, but requires both conditions to be met simultaneously:
- **Short Signal (Orange Triangle)**: MACD bearish crossover (fast line crosses below signal line) + RSI was overbought (≥71)
- **Long Signal (Green Triangle)**: MACD bullish crossover (fast line crosses above signal line) + RSI was oversold (≤29)
### 2. **RSI Memory Function**
The indicator checks the RSI values of the current and past 5 candlesticks. As long as any one of them reaches the overbought/oversold level, the condition is satisfied. This design avoids overly strict requirements, as RSI may have already left the extreme zone before the MACD crossover occurs.
```pine
wasOversold = rsi <= 29 or rsi <= 29 or ... or rsi <= 29
wasOverbought = rsi >= 71 or rsi >= 71 or ... or rsi >= 71
```
## Parameter Settings
### MACD Parameters
- **Fast MA**: 12 periods (adjustable 7-∞)
- **Slow MA**: 26 periods (adjustable 7-∞)
- **Signal Line**: 9 periods
### RSI Parameters
- **Oversold Threshold**: 29 (traditional 30)
- **Overbought Threshold**: 71 (traditional 70)
- **Calculation Period**: 14
## Visual Elements
### 1. **Signal Markers**
- 🔻 **Orange Downward Triangle**: Appears above the candlestick, labeled "overbought", indicating a shorting opportunity
- 🔺 **Green Upward Triangle**: Appears below the candlestick, labeled "oversold", indicating a long opportunity
### 2. **Price Level Lines**
- **Orange Dashed Line**: Extends rightward from the high of the short signal, serving as a potential resistance level
- **Green Dashed Line**: Extends rightward from the low of the long signal, serving as a potential support level
Each time a new signal appears, the old level line is deleted, keeping only the most recent reference line.
## Trading Logic Explained
### Short Signal Scenario
1. Price rises, RSI surges above 71 (market overheated)
2. Momentum subsequently weakens, MACD fast line crosses below signal line
3. Indicator draws an orange triangle at the high, alerting to reversal risk
4. Orange dashed line marks the high point of the short entry position
### Long Signal Scenario
1. Price falls, RSI drops below 29 (market oversold)
2. Selling pressure exhausted, MACD fast line crosses above signal line
3. Indicator draws a green triangle at the low, suggesting a rebound opportunity
4. Green dashed line marks the low point of the long entry position
## Advantages and Limitations
### ✅ Advantages
- **Filters Noise**: Reduces false signals through dual confirmation
- **Captures Reversals**: Catches trend reversals in extreme conditions
- **Visual Clarity**: Level lines help identify support/resistance
- **Built-in Alerts**: Can set up message push notifications
### ⚠️ Limitations
- **Lag**: Both indicators are lagging, signals may be delayed
- **Poor Performance in Ranging Markets**: Prone to whipsaws during consolidation
- **Needs Other Analysis**: Should not be the sole decision-making basis
- **Parameter Sensitivity**: Different markets and timeframes may require parameter adjustments
## Practical Trading Suggestions
1. **Confirm Trend Context**: Counter-trend signals carry high risk in strong trending markets
2. **Combine with Candlestick Patterns**: Confirm with patterns (such as engulfing, hammer candles)
3. **Set Stop Losses**: Use level lines as stop-loss references (long stop below green line, short stop above orange line)
4. **Watch Volume**: Signals accompanied by high volume are more reliable
5. **Multi-Timeframe Verification**: Signals appearing simultaneously on daily and 4-hour charts are more credible
## Summary
This indicator follows the "mean reversion from extremes" philosophy, seeking reversal opportunities when market sentiment becomes excessive. It's suitable for auxiliary judgment, particularly in swing trading and position trading strategies. But remember, no indicator is perfect—always combine risk management and multi-dimensional analysis when making trading decisions

Solana 4H RSI->MACD — Counter-Trend By TetradTetrad RSI→RSI Cross→MACD (Sequenced) — Counter-Trend (SL-Only)
Category: Market-neutral, counter-trend, sequenced entries
Timeframe default: Works on any TF; designed around 4H On Solana
Markets: Any (spot, perp, futures); parameterize to your asset
What it does
This strategy hunts reversals using a 3-step sequence on RSI and MACD, then optionally restricts entries by market regime and a price gate. It shows stop-loss lines only when hit (clean chart), and paints a Donchian glow for quick read of backdrop conditions.
Entry logic (sequenced)
1. RSI Extreme:
Long path activates when RSI < Oversold (default 27.5).
Short path activates when RSI > Overbought (default 74).
2. RSI Cross confirmation:
Long path: RSI crosses up back above the oversold level.
Short path: RSI crosses down back below the overbought level.
Each step has a max bar lookback so stale signals time out.
3. MACD Cross trigger:
Long: MACD line crosses above Signal.
Short: MACD line crosses below Signal.
→ When step 3 fires and gates are satisfied, a trade is entered.
Optional gates & filters
Regime Filter (Counter-Trend):
Longs allowed in **Range / Short Trend / Short Parabolic** regimes.
Shorts allowed in **Range / Long Trend / Long Parabolic** regimes.
Based on ADX/DI and ATR% intensity.
* Price Gate (Long Ceiling):
Toggle to **disable new longs above a chosen price (default 209.0 For SOL).
Useful for assets like SOL where you want longs only below a cap.
Exits / Risk
* Stop-Loss (% of entry):** default **14%**, toggleable.
* SL visualization:** plots a **thin dashed red line only on the bar it’s hit**.
* (No take-profit or time-based exit in this version—keep it pure to the sequence and regime. Add TP/time exits if desired.)
Visuals
* Donchian Glow (50): background band only (upper/lower lines hidden).
* Regime HUD: compact table (top-right) highlighting the active regime.
* Minimal marks: no entry/exit “arms” clutter; only SL-hit lines render.
Inputs (key)
* Core: RSI Length, Oversold/Overbought, MACD Fast/Slow/Signal.
* Sequence: Max bars from Extreme→RSI Cross and RSI Cross→MACD Cross.
* Regime: ADX Length, Trend/Parabolic thresholds, ATR length & floor.
* Stops: Enable/disable; SL %.
* Price Gate: Enable; Long ceiling price.
Alerts
Sequenced Long (CT): RSIhigh → RSI cross down → MACD bear cross.
## Notes & Tips
Designed for counter-trend fades that become trend rides. The regime filter helps avoid fading true parabolics and aligns entries with safer contexts.
The sequence is stateful (steps must occur in order). If a step times out, the path resets.
Works on lower TFs, but the 4H baseline reduces noise and over-trading.
Consider pairing with volume or structure filters if you want fewer but higher-conviction entries.
Past performance ≠ future results. **Educational use only. Not financial advice.

MacD Alerts MACD Triggers (MTF) — Buy/Sell Alerts
What it is
A clean, multi-timeframe MACD indicator that gives you separate, ready-to-use alerts for:
• MACD Buy – MACD line crosses above the Signal line
• MACD Sell – MACD line crosses below the Signal line
It keeps the familiar MACD lines + histogram, adds optional 4-color histogram logic, and marks crossovers with green/red dots. Works on any symbol and any timeframe.
How signals are generated
• MACD = EMA(fast) − EMA(slow)
• Signal = SMA(MACD, length)
• Buy when crossover(MACD, Signal)
• Sell when crossunder(MACD, Signal)
• You can compute MACD on the chart timeframe or lock it to another timeframe (e.g., 1h MACD on a 4h chart).
Key features
• MTF engine: choose Use Current Chart Resolution or a custom timeframe.
• Separate alert conditions: publish two alerts (“MACD Buy” and “MACD Sell”)—ideal for different notifications or webhooks.
• Visuals: MACD/Signal lines, optional 4-color histogram (trend & above/below zero), and crossover dots.
• Heikin Ashi friendly: runs on whatever candle type your chart uses. (Tip below if you want “regular” candles while viewing HA.)
Settings (Inputs)
• Use Current Chart Resolution (on/off)
• Custom Timeframe (when the above is off)
• Show MACD & Signal / Show Histogram / Show Dots
• Color MACD on Signal Cross
• Use 4-color Histogram
• Lengths: Fast EMA (12), Slow EMA (26), Signal SMA (9)
How to set alerts (2 minutes)
1. Add the script to your chart.
2. Click ⏰ Alerts → + Create Alert.
3. Condition: choose this indicator → MACD Buy.
4. Options: Once per bar close (recommended).
5. Set your notification method (popup/email/webhook) → Create.
6. Repeat for MACD Sell.
Webhook tip: send JSON like
{"symbol":"{{ticker}}","time":"{{timenow}}","signal":"BUY","price":"{{close}}"}
(and “SELL” for the sell alert).
Good to know
• Symbol-agnostic: use it on crypto, stocks, indices—no symbol is hard-coded.
• Timeframe behavior: alerts are evaluated on bar close of the MACD timeframe you pick. Using a higher TF on a lower-TF chart is supported.
• Heikin Ashi note: if your chart uses HA, the calculations use HA by default. To force “regular” candles while viewing HA, tweak the code to use ticker.heikinashi() only when you want it.
• No repainting on close: crossover signals are confirmed at bar close; choose Once per bar close to avoid intra-bar noise.
Disclaimer
This is a tool, not advice. Test across timeframes/markets and combine with risk management (position sizing, SL/TP). Past performance ≠ future results.

MACD Liquidity Tracker SystemMACD Liquidity Tracker System
🔹 Enhanced MACD with candle coloring, entry markers, and customizable signal logic.
🧠 Features:
This tool combines a color-coded MACD histogram with signal-based candle colors and small shape markers (🔼🔽) for clear market momentum and entry visualization.
📊 Visuals:
MACD Histogram (Sub-panel):
4 dynamic colors to show momentum direction:
🔹 Bright Blue = MACD > 0 & rising (strong bullish)
🔹 Dark Blue = MACD > 0 & falling (weakening bullish)
🔹 Bright Magenta = MACD < 0 & falling (strong bearish)
🔹 Dark Magenta = MACD < 0 & rising (weakening bearish)
Price Candles (Main Chart):
🔹 Bright Blue = Active Long signal
🔹 Bright Magenta = Active Short signal
Entry Markers:
🔼 Blue triangle (below candle) = Start of Long
🔽 Magenta triangle (above candle) = Start of Short
⚙️ System Types (select in settings):
Normal:
🔹 Long = MACD > 0
🔹 Short = MACD < 0
Fast: (Based on histogram color)
🔹 Long = Bright Blue OR Dark Magenta
🔹 Short = Dark Blue OR Bright Magenta
Safe:
🔹 Long = Only Bright Blue
🔹 Short = All other colors
🔔 Alerts:
Alerts trigger only on the first bar of a new Long/Short signal.
Easy to set up using TradingView’s alert system.
📌 How to Use:
Add the indicator to your chart
Open settings and select a System Type
Adjust MACD parameters if needed
Use histogram color + candle color for momentum and signal confirmation
Set alerts for clean entries if desired
💡 Ideal for traders seeking visual clarity and flexible MACD-based strategies.

MACD & Bollinger Bands Overbought OversoldMACD & Bollinger Bands Reversal Detector
This indicator combines the power of MACD divergence analysis with Bollinger Bands to help traders identify potential reversal points in the market.
Key Features:
MACD Calculation & Divergence:
The script calculates the standard MACD components (MACD line, Signal line, and Histogram) using configurable fast, slow, and signal lengths. It includes a simplified divergence detection mechanism that flags potential bearish divergence—when the price makes a new swing high but the MACD fails to confirm the move. This divergence can serve as an early warning that the bullish momentum is waning.
Bollinger Bands:
A 20-period simple moving average (SMA) is used as the basis, with upper and lower bands drawn at 2 standard deviations. These bands help visualize overbought and oversold conditions. For example, a close at or above the upper band suggests the market may be overextended (overbought), while a close at or below the lower band may indicate oversold conditions.
Visual Alerts:
The indicator plots the Bollinger Bands on the chart along with labels marking overbought and oversold conditions. Additionally, it marks potential bearish divergence with a downward triangle, providing a quick visual cue to traders.
Usage Suggestions:
Confluence with Other Signals:
Use the divergence signals and Bollinger Band conditions as filters. For example, even if another indicator suggests a long entry, you might avoid it if the price is overbought or if MACD divergence warns of weakening momentum.
Customization:
All key parameters, such as the MACD lengths, Bollinger Band period, and multiplier, are fully configurable. This flexibility allows you to adjust the indicator to suit different markets or trading styles.
Disclaimer:
This script is provided for educational purposes only. Always perform your own analysis and backtesting before trading with live capital.

MACD, ADX & RSI -> for altcoins# MACD + ADX + RSI Combined Indicator
## Overview
This advanced technical analysis tool combines three powerful indicators (MACD, ADX, and RSI) into a single view, providing a comprehensive analysis of trend, momentum, and divergence signals. The indicator is designed to help traders identify potential trading opportunities by analyzing multiple aspects of price action simultaneously.
## Components
### 1. MACD (Moving Average Convergence Divergence)
- **Purpose**: Identifies trend direction and momentum
- **Components**:
- Fast EMA (default: 12 periods)
- Slow EMA (default: 26 periods)
- Signal Line (default: 9 periods)
- Histogram showing the difference between MACD and Signal line
- **Visual**:
- Blue line: MACD line
- Orange line: Signal line
- Green/Red histogram: MACD histogram
- **Interpretation**:
- Histogram color changes indicate potential trend shifts
- Crossovers between MACD and Signal lines suggest entry/exit points
### 2. ADX (Average Directional Index)
- **Purpose**: Measures trend strength and direction
- **Components**:
- ADX line (default threshold: 20)
- DI+ (Positive Directional Indicator)
- DI- (Negative Directional Indicator)
- **Visual**:
- Navy blue line: ADX
- Green line: DI+
- Red line: DI-
- **Interpretation**:
- ADX > 20 indicates a strong trend
- DI+ crossing above DI- suggests bullish momentum
- DI- crossing above DI+ suggests bearish momentum
### 3. RSI (Relative Strength Index)
- **Purpose**: Identifies overbought/oversold conditions and divergences
- **Components**:
- RSI line (default: 14 periods)
- Divergence detection
- **Visual**:
- Purple line: RSI
- Horizontal lines at 70 (overbought) and 30 (oversold)
- Divergence labels ("Bull" and "Bear")
- **Interpretation**:
- RSI > 70: Potentially overbought
- RSI < 30: Potentially oversold
- Bullish/Bearish divergences indicate potential trend reversals
## Alert System
The indicator includes several automated alerts:
1. **MACD Alerts**:
- Rising to falling histogram transitions
- Falling to rising histogram transitions
2. **RSI Divergence Alerts**:
- Bullish divergence formations
- Bearish divergence formations
3. **ADX Trend Alerts**:
- Strong trend development (ADX crossing threshold)
- DI+ crossing above DI- (bullish)
- DI- crossing above DI+ (bearish)
## Settings Customization
All components can be fine-tuned through the settings panel:
### MACD Settings
- Fast Length
- Slow Length
- Signal Smoothing
- Source
- MA Type options (SMA/EMA)
### ADX Settings
- Length
- Threshold level
### RSI Settings
- RSI Length
- Source
- Divergence calculation toggle
## Usage Guidelines
### Entry Signals
Strong entry signals typically occur when multiple components align:
1. MACD histogram color change
2. ADX showing strong trend (>20)
3. RSI showing divergence or leaving oversold/overbought zones
### Exit Signals
Consider exits when:
1. MACD crosses signal line in opposite direction
2. ADX shows weakening trend
3. RSI reaches extreme levels with divergence
### Risk Management
- Use the indicator as part of a complete trading strategy
- Combine with price action and support/resistance levels
- Consider multiple timeframe analysis for confirmation
- Don't rely solely on any single component
## Technical Notes
- Built for TradingView using Pine Script v5
- Compatible with all timeframes
- Optimized for real-time calculation
- Includes proper error handling and NA value management
- Memory-efficient calculations for smooth performance
## Installation
1. Copy the provided Pine Script code
2. Open TradingView Chart
3. Create New Indicator -> Pine Editor
4. Paste the code and click "Add to Chart"
5. Adjust settings as needed through the indicator settings panel
## Version Information
- Version: 2.0
- Last Updated: November 2024
- Platform: TradingView
- Language: Pine Script v5

CCI and MACD Auto Trading Strategy with Risk/RewardOverview:
This strategy combines the Commodity Channel Index (CCI) and the Moving Average Convergence Divergence (MACD) indicators to automate trading decisions. It dynamically sets stop-loss and take-profit levels based on recent lows and highs, ensuring a risk/reward ratio of 1:1.5. This script aims to leverage trend and momentum signals while maintaining effective risk management.
Originality and Usefulness:
This script is not just a simple mashup of CCI and MACD indicators; it incorporates dynamic risk management by setting stop-loss and take-profit levels based on recent price action. This approach helps traders to:
・Identify potential trend reversals using the combination of CCI and MACD signals.
・Manage trades effectively by setting realistic stop-loss and take-profit levels based on recent market data.
・Maintain a balanced risk/reward ratio, which is essential for sustainable trading.
Indicators Used:
・CCI (Commodity Channel Index):
・Measures the deviation of the price from its average over a specified period, typically ranging from -100 to +100.
・Helps identify overbought and oversold conditions.
・MACD (Moving Average Convergence Divergence):
・Utilizes the difference between short-term and long-term moving averages to indicate trend strength and direction.
・Provides momentum signals that can be used for timing entries and exits.
How It Works:
Entry Conditions:
Long Entry:
・The MACD histogram is above zero.
・The CCI crosses above the -100 line.
Short Entry:
・The MACD histogram is below zero.
・The CCI crosses below the +100 line.
Exit Conditions:
Long Positions:
・The stop-loss is set at the recent low.
・The take-profit is set at 1.5 times the distance between the entry price and the stop-loss.
Short Positions:
・The stop-loss is set at the recent high.
・The take-profit is set at 1.5 times the distance between the entry price and the stop-loss.
Risk Management:
・The script dynamically adjusts stop-loss and take-profit levels based on recent market data, ensuring that the risk/reward ratio is maintained at 1:1.5.
・This approach helps in managing the risk effectively while aiming for consistent profits.
Strategy Properties:
・Account Size: Configured for a realistic account size suitable for the average trader.
・Commission and Slippage: Includes settings for realistic commission and slippage to reflect real market conditions.
・Risk per Trade: Designed to risk no more than 5-10% of equity per trade, aligning with sustainable trading practices.
・Backtesting Results: Configured to generate a sufficient sample size (ideally more than 100 trades) for reliable backtesting results.
Revised Backtesting Settings
Ensure that your backtesting settings are realistic:
・Account Size: Set a realistic initial capital suitable for the average trader.
・Commission and Slippage: Include realistic commission fees and slippage.
・Risk Management: Ensure that each trade risks no more than 5-10% of the account equity.
・Sufficient Sample Size: Choose a dataset that will generate more than 100 trades to provide a robust sample size.

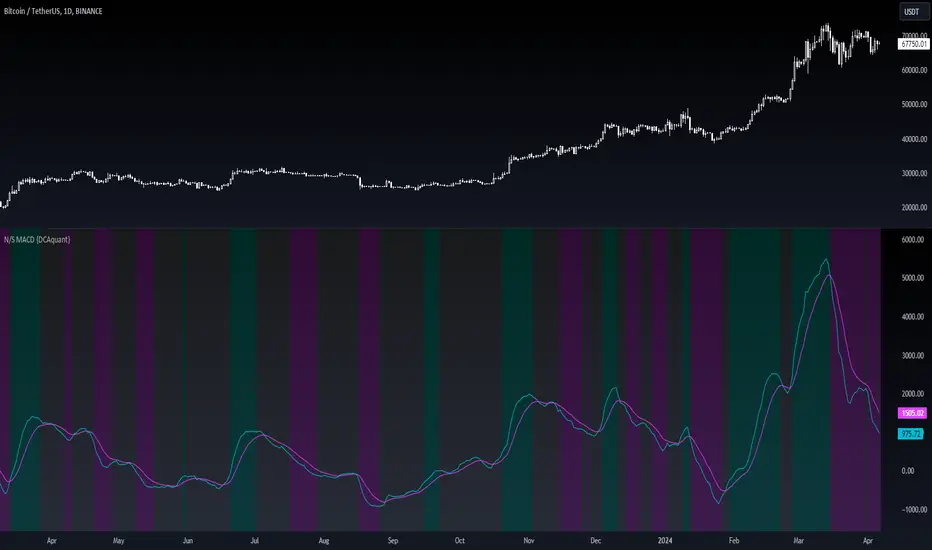
Neutral State MACD {DCAquant}The Neutral State MACD {DCAquant}
The Neutral State MACD {DCAquant} offers a nuanced interpretation of the classic MACD (Moving Average Convergence Divergence) indicator. By focusing on the neutrality of price movements, it serves to identify periods where the market lacks a defined directional bias, often seen as potential phases of accumulation or distribution before a new trend emerges.
Characteristics of the Neutral State MACD {DCAquant}:
Enhanced MACD Formula: Incorporates a neutral zone detection system into the traditional MACD framework to spotlight periods of market equilibrium.
Neutral Zone Threshold: A user-defined parameter that establishes a range within which the MACD and the signal line convergence is considered indicative of a neutral state.
Color-Coded Visualization: Utilizes color variations to illustrate the relationship between the MACD line and the signal line, accentuating the detection of neutral states, bullish crossovers, and bearish crossovers.
Functionality:
MACD and Signal Line Calculation: Employs fast and slow EMA inputs to generate the MACD line, contrasted against a signal line to capture momentum shifts.
Neutral State Detection: Assesses the proximity between the MACD and signal lines relative to the neutral zone threshold, identifying periods where neither bullish nor bearish momentum is dominant.
Background Highlighting: Modifies the chart's background color to reflect the current state of the market—neutral (gray), bullish divergence (teal), or bearish divergence (purple).
Interpretation and Trading Strategy:
Market Phases Identification: Traders can spot periods of equilibrium that may precede significant market moves, aiding in the timing of entry and exit points.
Momentum Analysis: The MACD line's cross above the signal line suggests increasing bullish momentum, whereas a cross below may signal growing bearish momentum.
Trend Confirmation: Acts as a confirmation tool when aligned with trend-following strategies, providing additional validation for trade setups.
Customization and User Guidance:
Adjustable Parameters: Allows for fine-tuning of length settings and the neutral zone threshold to match different trading styles and market conditions.
Complementary Indicator: Can be paired with volume indicators, price action patterns, or other oscillators to form a comprehensive trading system.
Disclaimer:
The Neutral State MACD {DCAquant} is a sophisticated tool meant for educational and strategic development. Traders should integrate it within a broader analytical framework and consider additional market factors. It is not a standalone signal for trades and should be used with caution and proper risk management. Trading decisions should always be made in the context of well-researched strategies and responsible investment practices.
Stochastic MACD - Slow and FastStochastic MACD - Slow and Fast
The "Stochastic MACD - Slow and Fast" indicator combines two popular technical indicators, the Stochastic Oscillator and the Moving Average Convergence Divergence ( MACD ).
The Stochastic Oscillator is a momentum indicator that measures the current closing position of an asset relative to its recent price range. This indicator helps traders identify possible turning points in an asset's trend, it is used to identify if the market is overbought or oversold.
On the other hand, the MACD is an indicator used to identify the trend and strength of the market and shows the difference between two exponential moving averages ( EMA ) of different periods. The MACD is commonly used to determine the direction of an asset's price trend.
The combination of both indicators can help traders identify market entry and exit opportunities. This indicator has two parts: a slow part and a fast part. The slow part uses input values for the lengths of the moving averages and the length of the signal for the MACD indicator. The fast part uses different input values for the lengths of the moving averages. Also, each part has its own set of line colors and histogram colors for easy visualization.
In general, the "Stochastic MACD - Slow and Fast" indicator is used to identify possible turning points in the trend of an asset. Traders can use the indicator to determine when to enter or exit a position based on the signals generated by the indicator. The stochastic MACD is a variation of the regular MACD that incorporates a stochastic oscillator to provide additional signals.
In summary, this indicator can be useful for those looking for a combination of two popular indicators to help identify trading opportunities.
In addition, parameters were defined to activate or deactivate the graphic signal.
When the Stochastic MACD Slow Line Crosses the Stochastic MACD Slow Signal Line:
Long or Buy = ↑ // The Entry is more Effective if it is made when the signal is below the Zero Trend Line .
Short or Sell = ↓ // The Entry is more Effective if it is made when the signal is above the Zero Trend Line .
When the Fast Stochastic MACD Line Crosses the Slow Stochastic MACD Line:
Long or Buy = ▲ // The Entry is more Effective if it is made when the signal is below the Zero Trend Line .
Short or Sell = ▼ // The Entry is more Effective if it is made when the signal is above the Zero Trend Line .
Taking into account the above, alerts were also defined for possible Purchases or Sales or entries in Long or Short.
COPOSITION AND USE OF THE INDICATOR
This script is an implementation of the Stochastic MACD indicator with two variations - Slow and Fast. It uses a combination of the Stochastic Oscillator and the Moving Average Convergence Divergence (MACD) indicator to identify trend reversals and momentum shifts in the price of an asset.
The Slow version of the Stochastic MACD is built using three inputs - fastLength, slowLength, and signalLength. The fastLength and slowLength are used to calculate two exponential moving averages (EMAs), while the signalLength is used to calculate a signal line as an EMA of the difference between the two EMAs. The Stochastic Oscillator is then applied to the difference between the two EMAs, and the resulting values are plotted on the chart.
The Fast version of the Stochastic MACD is built using the same inputs as the Slow version, but with different values. It uses a shorter fastLength value and a longer slowLength value to generate the two EMAs, and the resulting values are plotted on the chart.
The script also includes inputs for choosing the type of moving average to use (SMA, EMA, etc.), the source of price data (open, close, etc.), the lookback period, and the colors for the lines and histogram bars.
This script can be used in different markets such as forex, indices, and cryptocurrencies for analysis and trading. However, it is important to note that no trading strategy is guaranteed to be profitable, and traders should always conduct their own research and risk management.

EMA and MACD with Trailing Stop Loss (by Coinrule)An exponential moving average ( EMA ) is a type of moving average (MA) that places a greater weight and significance on the most recent data points. The exponential moving average is also referred to as the exponentially weighted moving average. An exponentially weighted moving average reacts more significantly to recent price changes than a simple moving average simple moving average ( SMA ), which applies an equal weight to all observations in the period.
Moving average convergence divergence ( MACD ) is a trend-following momentum indicator that shows the relationship between two moving averages of a security’s price. The MACD is calculated by subtracting the 26-period exponential moving average ( EMA ) from the 12-period EMA.
The result of that calculation is the MACD line. A nine-day EMA of the MACD called the "signal line," is then plotted on top of the MACD line, which can function as a trigger for buy and sell signals. Traders may buy the security when the MACD crosses above its signal line and sell—or short—the security when the MACD crosses below the signal line. Moving average convergence divergence ( MACD ) indicators can be interpreted in several ways, but the more common methods are crossovers, divergences, and rapid rises/falls.
The Strategy enters and closes the trade when the following conditions are met:
LONG
The MACD histogram turns bearish
EMA7 is greater than EMA14
EXIT
Price increases 3% trailing
Price decreases 1% trailing
This strategy is back-tested from 1 January 2022 to simulate how the strategy would work in a bear market and provides good returns.
Pairs that produce very strong results include XRPUSDT on the 1-minute timeframe. This short timeframe means that this strategy opens and closes trades regularly
In order to further improve the strategy, the EMA can be changed from 7 and 14 to, say, EMA20 and EMA50. Furthermore, the trailing stop loss can also be changed to ideally suit the user to match their needs.
The strategy assumes each order is using 30% of the available coins to make the results more realistic and to simulate you only ran this strategy on 30% of your holdings. A trading fee of 0.1% is also taken into account and is aligned to the base fee applied on Binance.

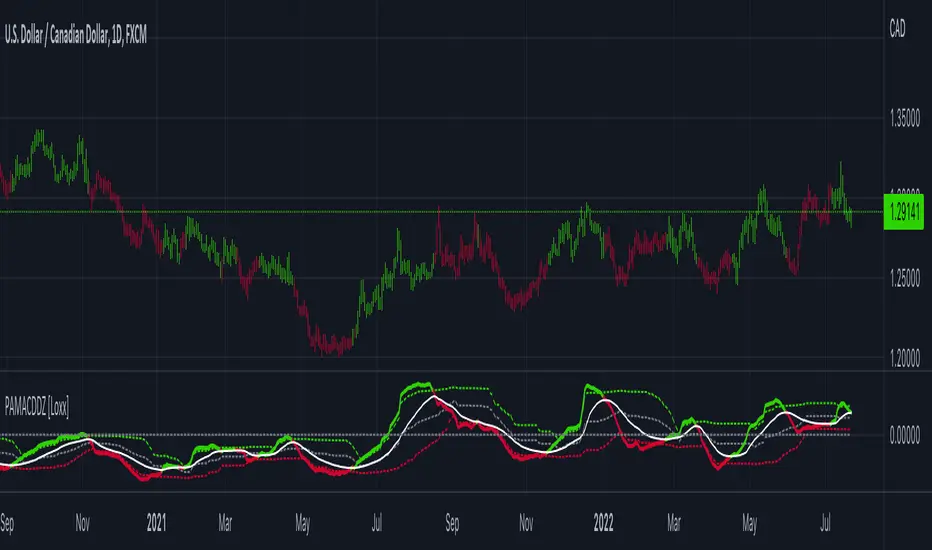
PA-Adaptive MACD w/ Variety Levels [Loxx]PA-Adaptive MACD w/ Variety Levels is a Phase Accumulation Adaptive MACD with both floating and quantile levels. This is tuned for Forex. You'll have to adjust the Phase Accumulation Cycle settings to work for crypto and stock markets.
What is MACD?
Moving average convergence divergence ( MACD ) is a trend-following momentum indicator that shows the relationship between two moving averages of a security’s price. The MACD is calculated by subtracting the 26-period exponential moving average ( EMA ) from the 12-period EMA .
What is the Phase Accumulation Cycle?
The phase accumulation method of computing the dominant cycle is perhaps the easiest to comprehend. In this technique, we measure the phase at each sample by taking the arctangent of the ratio of the quadrature component to the in-phase component. A delta phase is generated by taking the difference of the phase between successive samples. At each sample we can then look backwards, adding up the delta phases.When the sum of the delta phases reaches 360 degrees, we must have passed through one full cycle, on average.The process is repeated for each new sample.
The phase accumulation method of cycle measurement always uses one full cycle’s worth of historical data.This is both an advantage and a disadvantage.The advantage is the lag in obtaining the answer scales directly with the cycle period.That is, the measurement of a short cycle period has less lag than the measurement of a longer cycle period. However, the number of samples used in making the measurement means the averaging period is variable with cycle period. longer averaging reduces the noise level compared to the signal.Therefore, shorter cycle periods necessarily have a higher out- put signal-to-noise ratio.
Included:
Zero-line and signal cross options for bar coloring, signals, and alerts
Alerts
Signals
Loxx's Expanded Source Types
4 moving average types
Adaptive Jurik Filter MACD [Loxx]Adaptive Jurik Filter MACD uses Jurik Volty and Adaptive Double Jurik Filter Moving Average (AJFMA) to derive Jurik Filter smoothed volatility.
What is MACD?
Moving average convergence divergence (MACD) is a trend-following momentum indicator that shows the relationship between two moving averages of a security’s price. The MACD is calculated by subtracting the 26-period exponential moving average (EMA) from the 12-period EMA.
The result of that calculation is the MACD line. A nine-day EMA of the MACD called the "signal line," is then plotted on top of the MACD line, which can function as a trigger for buy and sell signals. Traders may buy the security when the MACD crosses above its signal line and sell—or short—the security when the MACD crosses below the signal line. Moving average convergence divergence (MACD) indicators can be interpreted in several ways, but the more common methods are crossovers, divergences, and rapid rises/falls.
What is Jurik Volty?
One of the lesser known qualities of Juirk smoothing is that the Jurik smoothing process is adaptive. "Jurik Volty" (a sort of market volatility ) is what makes Jurik smoothing adaptive. The Jurik Volty calculation can be used as both a standalone indicator and to smooth other indicators that you wish to make adaptive.
What is the Jurik Moving Average?
Have you noticed how moving averages add some lag (delay) to your signals? ... especially when price gaps up or down in a big move, and you are waiting for your moving average to catch up? Wait no more! JMA eliminates this problem forever and gives you the best of both worlds: low lag and smooth lines.
Ideally, you would like a filtered signal to be both smooth and lag-free. Lag causes delays in your trades, and increasing lag in your indicators typically result in lower profits. In other words, late comers get what's left on the table after the feast has already begun.
That's why investors, banks and institutions worldwide ask for the Jurik Research Moving Average ( JMA ). You may apply it just as you would any other popular moving average. However, JMA's improved timing and smoothness will astound you.
What is adaptive Jurik volatility?
One of the lesser known qualities of Juirk smoothing is that the Jurik smoothing process is adaptive. "Jurik Volty" (a sort of market volatility ) is what makes Jurik smoothing adaptive. The Jurik Volty calculation can be used as both a standalone indicator and to smooth other indicators that you wish to make adaptive.
What is an adaptive cycle, and what is Ehlers Autocorrelation Periodogram Algorithm?
From his Ehlers' book Cycle Analytics for Traders Advanced Technical Trading Concepts by John F. Ehlers , 2013, page 135:
"Adaptive filters can have several different meanings. For example, Perry Kaufman’s adaptive moving average ( KAMA ) and Tushar Chande’s variable index dynamic average ( VIDYA ) adapt to changes in volatility . By definition, these filters are reactive to price changes, and therefore they close the barn door after the horse is gone.The adaptive filters discussed in this chapter are the familiar Stochastic , relative strength index ( RSI ), commodity channel index ( CCI ), and band-pass filter.The key parameter in each case is the look-back period used to calculate the indicator. This look-back period is commonly a fixed value. However, since the measured cycle period is changing, it makes sense to adapt these indicators to the measured cycle period. When tradable market cycles are observed, they tend to persist for a short while.Therefore, by tuning the indicators to the measure cycle period they are optimized for current conditions and can even have predictive characteristics.
The dominant cycle period is measured using the Autocorrelation Periodogram Algorithm. That dominant cycle dynamically sets the look-back period for the indicators. I employ my own streamlined computation for the indicators that provide smoother and easier to interpret outputs than traditional methods. Further, the indicator codes have been modified to remove the effects of spectral dilation.This basically creates a whole new set of indicators for your trading arsenal."
Included
- Change colors of oscillators and bars

Hybrid, Zero lag, Adaptive cycle MACD [Loxx]TASC's March 2008 edition Traders' Tips includes an article by John Ehlers titled "Measuring Cycle Periods," and describes the use of bandpass filters to estimate the length, in bars, of the currently dominant price cycle.
What are Dominant Cycles and Why should we use them?
Even the most casual chart reader will be able to spot times when the market is cycling and other times when longer-term trends are in play. Cycling markets are ideal for swing trading however attempting to “trade the swing” in a trending market can be a recipe for disaster. Similarly, applying trend trading techniques during a cycling market can equally wreak havoc in your account. Cycle or trend modes can readily be identified in hindsight. But it would be useful to have an objective scientific approach to guide you as to the current market mode.
There are a number of tools already available to differentiate between cycle and trend modes. For example, measuring the trend slope over the cycle period to the amplitude of the cyclic swing is one possibility.
We begin by thinking of cycle mode in terms of frequency or its inverse, periodicity. Since the markets are fractal; daily, weekly, and intraday charts are pretty much indistinguishable when time scales are removed. Thus it is useful to think of the cycle period in terms of its bar count. For example, a 20 bar cycle using daily data corresponds to a cycle period of approximately one month.
When viewed as a waveform, slow-varying price trends constitute the waveform's low frequency components and day-to-day fluctuations (noise) constitute the high frequency components. The objective in cycle mode is to filter out the unwanted components--both low frequency trends and the high frequency noise--and retain only the range of frequencies over the desired swing period. A filter for doing this is called a bandpass filter and the range of frequencies passed is the filter's bandwidth .
Indicator Features
-Zero lag or Regular MACD/signal calculation
- Fixed or Band-pass Dominant Cycle for MACD and Signal MA period inputs
-10 different moving average options for both MACD and Signal MA calculations
-Separate Band-pass Dominant Cycle calculations for both MACD and Signal MA calculations
- Slow-to-Fast Band-pass Dominant Cycle input to tweak the ratio of MACD MA input periods as they relate to each other

Selected MACD Areas CompareThis is a simple tool to compare two selected MACD histogram area. The MACD histogram area is sometimes used to determine trend reversal or trend strength. One may have difficulty with this when the compared MACD areas are of different shape or similar in size. This indicator/tool allows user to select two time periods on the chart and get a precise compare result.
To use the indicator, place a regular MACD indicator on the chart which shows the histogram, then add this indicator and select the two areas of which you want to compare the size. Please make sure that the regular MACD indicator this one have the same source.

RSI MACD Same RatioこのインジケータはRSIとMACDを同比率で表示するものです。
なぜ同比率で表示するのでしょうか。
同比率で表示することでRSIとMACDのダイバージェンスを同時に確認することができます。
私には思いつきませんが、他にも使い道はあるかもしれません。
必要と感じた場合はぜひ使ってみてください。
※同比率で表示するためにRSIとMACDの値を変更しています。
そのため、値はあくまで参考程度にご覧ください。
注目すべきはラインのみです。
使う場合は「adjustment ratio」に適当な値を入れて、RSIの比率とMACDの比率を合わせてください。
それでは良いトレードライフを。
-----
This indicator shows RSI and MACD in equal proportions.
Why are they displayed at the same ratio?
By displaying at the same ratio, you can check the divergence of RSI and MACD at the same time.
I can't think of it, but there may be other uses.
If you feel it is necessary, please use it.
caution!
The RSI and MACD values are changed to display the same ratio.
Therefore, please see the values for reference only.
Only the line should be noted.
When using it, enter an appropriate value in "adjustment ratio" and match the RSI ratio with the MACD ratio.
Let's have a good trade life.

Momentum Strategy (BTC/USDT; 1h) - MACD (with source code)Good morning traders.
It's been a while from my last publication of a strategy and today I want to share with you this small piece of script that showed quite interesting result across bitcoin and other altcoins.
The macd indicator is an indicator built on the difference between a fast moving average and a slow moving average: this difference is generally plottted with a blue line while the orange line is simply a moving average computed on this difference.
Usually this indicator is used in technical analysis for getting signals of buy and sell respectively when the macd crosses above or under its moving average: it means that the distance of the fast moving average (the most responsive one) from the slower one is getting lower than what it-used-to-be in the period considered: this could anticipate a cross of the two moving averages and you want to anticipate this potential trend reversal by opening a long position
Of course the workflow is specularly the same for opening short positions (or closing long positions)
What this strategy does is simply considering the moving average computed on macd and applying a linear regression on it: in this way, even though the signal can be sligthly delayed, you reduce noise plotting a smooth curve.
Then, it simply checks the maximums and the minimums of this curve detecting whenever the changes of the values start to be negative or positive, so it opens a short position (closes long) on the maximum on this curve and it opens a long position (closes short) on the minimum.
Of course, I set an option for using this strategy in a conventional way working on the crosses between macd and its moving average. Alternatively you can use this workflow if you prefer.
In conclusion, you can use a tons of moving averages: I made a function in pine in order to allw you to use any moving average you want for the two moving averages on which the macd is based or for the moving average computed on the macd
PLEASE, BE AWARE THAT THIS TRADING STRATEGY DOES NOT GUARANTEE ANY KIND OF SUCCESS IN ADVANCE. YOU ARE THE ONE AND ONLY RESPONSIBLE OF YOUR OWN DECISIONS, I DON'T TAKE ANY RESPONSIBILITY ASSOCIATED WITH THEM. IF YOU RUN THIS STRATEGY YOU ACCEPT THE POSSIBILITY OF LOOSING MONEY, ALL OF MY PUBBLICATIONS ARE SUPPOSED TO BE JUST FOR EDUCATIONAL PURPOSES.
IT IS AT YOUR OWN RISK WHETHER TO USE IT OR NOT
But if you make money out of this, please consider to buy me a beer 😜
Happy Trading!

[SK] Double MACDThe Double MACD indicator is precisely two different MACD indicators plotted on the same axis for precise visual correlation between each other.
This correlation provides more information than a single regular MACD by allowing you to compare the signals of a shorter timeframe to the default or longer timeframe,
showing the strength of the change in momentum and the peak of the momentum between both configurations.
The indicator has cloud options by default if you toggle on the MACD / Signal lines for better readability.
The cloud will change color to the line on top of it's set. This is to help you not get lost in the 4 different lines.
Customize the indicator to your preference and make it your own
If you'd like a candle like visualization, change the short MACD plot style to a histogram.
For a beautiful double bars style, select bars on both configurations and set the transparency to 30 - 40
For a dynamic moving average style, go with the line plot style ( default )
All MACD/Signal lines are toggled off by default, toggle them on in the inputs section.
On the styles panel, you can turn off the cloud fills or the lines.
Change all the colors you'd like!

SALEH MACD Donchian + EMA & MACD + ADXI gathered all the signals coming from the MACD & Donchian channels indicators and filtered them with EMA 200 or ADX > 25 indicators (which both of them show the trend),
and put them on the chart to show me the buy and sell signals;
the signals rules are as following:
BUY:
when we have an uptrend ( the price is above the EMA 200 or ADX > 25 ) & the macd line cross up the signal line while they are both under the 0 level of histogram it generates buy signals.
SELL:
when we have a downtrend ( the price is below the EMA 200 or ADX > 25) & the macd line cross below the signal line while they are both above the 0 level of histogram it generates sell signals.
Donchian channel works as a confirmation for the macd signal.
this signals work best at London session, you can also filter them by chandelier exit indicator.
