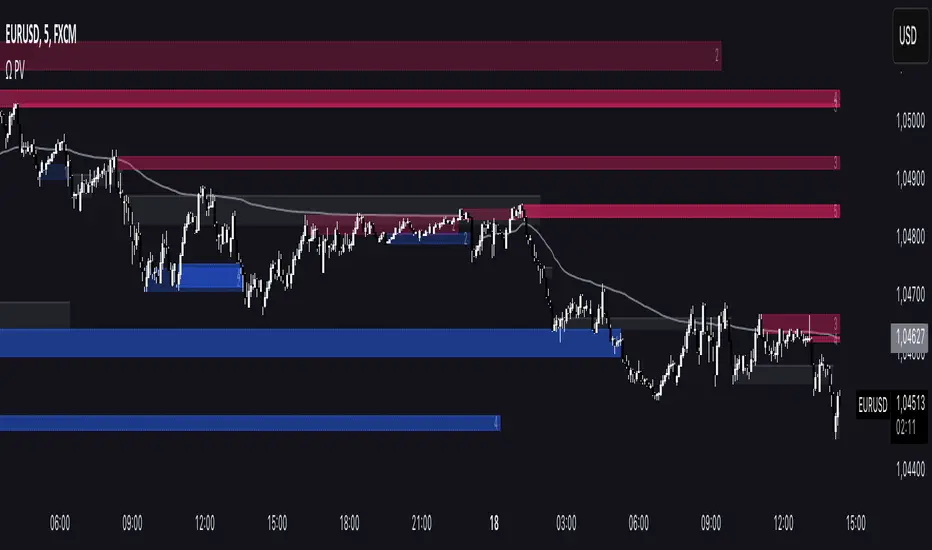
Omega Smart AnalystThe Omega Smart analyst is a tool designed to help traders visualize in a clearer way key price levels on the chart based on the price and the volume.
The indicator has some features, including:
- Option to customize the colors for all of the tools available to have common aesthetics
- Option to choose the length and the sensitivity for all of the tools
Volume clusters: display automatic volume clusters that can be used as support or resistance following the order block theory. These levels can be highlighted or extended in the settings.
Support and resistance: show automatic support and resistance levels based on volume.
Candle coloring: color candles based on volume and volatility, great to use as a signal confirmation.
Full levels: show previous high, low, and close levels on the chart, great to use to detect liquidity and breakouts
Bias target: a tool to enhance one of the low or high of the previous full levels according to the daily liquidity bias ICT method. As shown in the picture above you can also choose to display only these levels.
Market structure: show the current trend according to the market structure.
Structure origin: shows the main level of support and resistance with an area that gives also an indication of the current price volatility.
Risk Disclaimer:
All content and scripts provided are purely for informational & educational purposes only and do not constitute financial advice or a solicitation to buy or sell any securities of any type. Past performance does not guarantee future results. Trading can lead to a loss of the invested capital in the financial markets. I will not accept liability for any loss or damage, including without limitation any loss of profit, which may arise directly or indirectly from the use of or reliance on such information. All investments involve risk, and the past performance of a security, industry, sector, market, financial product, trading strategy, backtest, or individual's trading does not guarantee future results or returns. Investors are fully responsible for any investment decisions they make. Such decisions should be based solely on an evaluation of their financial circumstances, investment objectives, risk tolerance, and liquidity needs.
Search in scripts for "order block"
[AlbaTherium] Sessional & Daily's liquidities - Beta Sessional & Daily Liquidities - Beta: Harnessing the Power of the Institutional Funding Candle (IFC) in Trading
Introduction:
The Sessional & Daily Liquidities - Beta indicator places the Institutional Funding Candle (IFC) at its core. Within the realm of trading, the IFC stands as a key signal for identifying Points of Interest (POIs) , offering traders invaluable insights into market dynamics. This document aims to illuminate the central role of the IFC within the Sessional & Daily Liquidities - Beta indicator, explaining how it can be effectively utilized to spot significant changes in the market and seize trading opportunities.
Chapter 1: Sessional Liquidity concepts
The forex market can be broken up into four major trading sessions: the Sydney session, the Tokyo session, the London session, and Trump’s favorite time to tweet (before he was banned), the New York session.
Historically, the forex market has three peak trading sessions. Traders often focus on one of the three trading periods, rather than attempt to trade the markets 24 hours per day. This is known as the “forex 3-session system“. These sessions consist of the Asian, European, and North American sessions, which are also called Tokyo, London, and New York sessions.
For that reason, a lot of trader put their stoploss right at the High or Low of their session, filling these price levels with liquidities. The market loves liquidities, they are like the “fuel” of the market. Price usually goes to these levels, takes out all the liquidities, and then returns to its original direction. This price behaviour indicates the presence of players – banks, institutions,... – driving the market to their own profit.
The same logic applies with Daily, Weekly and Monthly high/low levels.
Chapter 2: Deciphering the Institutional Funding Candle
2.1 Unveiling the Essence of the Institutional Funding Candle (IFC)
- IFC concept is the core of this indicator. It is recommended to use this indicator on high timeframes, like 1H or 4H charts, as those are the timeframes which big players look at.
- The presence of IFC candles means a significant amount of stop loss is triggered, and price have a tendency to reverse.
2.2 Criteria for IFC Identification
The definition of specific conditions that characterize an IFC within the Sessional & Daily Liquidities - Beta indicator:
- A breach of Previous day, Previous week, or Previous month’s High or Low levels or a breach of major Session Highs or Lows.
- Price made an immediate reverse, creating a decent distance from the wicks.
Chapter 2: Trading Strategies with the IFC
User should treat these signals with cautions, and only take trades with multi confluences.
This pictures below demonstrate a strategy to trade with this indicator, taking 1H HTF trend and 5m LTF ChoCh and Single Candle Order Block as confluences.
Conclusion:
The Sessional & Daily Liquidities - Beta indicator, centered around the Institutional Funding Candle (IFC), stands as a potent tool for traders, offering them the means to spot critical inflection points in the market. By understanding the role of the IFC in violating significant swing highs or lows and major session highs or lows, traders can make informed decisions and seize opportunities within the ever-evolving realm of financial markets. It's crucial to note that while IFC candle colors can provide insights, they do not unilaterally dictate market direction. Furthermore, candle closure can be a valuable consideration in specific situations, particularly when evaluating other High Time Frame POIs.
The real-world examples presented in this document within the Sessional & Daily Liquidities - Beta indicator offer a tangible insight into the world of IFC trading. Harness the potential of the Institutional Funding Candle within the Sessional & Daily Liquidities - Beta indicator to elevate your trading strategies and make well-informed decisions in the dynamic landscape of financial markets.

Support & Resistance IndicatorThe MACD Support & Resistance indicator is an enhanced tool to better visualize potential supply (resistance) and demand (support) zones based on the MACD indicator. It combines the strength of the MACD with recent price highs and lows to depict potential breakout or reversal areas in the market.
Features:
MACD Settings: Users can adjust the fast length, slow length, source of MACD, signal smoothing, and MA type for both the oscillator and the signal line.
Dynamic Color Settings: Customize the color of supply boxes, demand boxes, and closed boxes for improved visualization.
Table View: An optional table can be displayed showing the average MACD high and low values, with customizable table position, size, background color, and text color.
Historical MACD Average: The indicator uses a historical average of MACD pivot highs and lows to determine potential support and resistance zones.
Real-Time Zone Detection: The indicator plots 'High Boxes' when the MACD crosses above its average high and 'Low Boxes' when it crosses below its average low, which signifies potential breakout or reversal zones.
How It Works:
The MACD line is calculated using user-defined moving average types (either EMA or SMA).
Pivot highs and pivot lows of the MACD are identified over a specified period.
Historical MACD highs and lows are stored and managed for average calculation. The average MACD high and low values are then used to determine potential trading zones.
When the MACD crosses over its average high, a 'High Box' (representing a potential breakout zone) is plotted from the recent high price to the candle top.
Conversely, when the MACD crosses under its average low, a 'Low Box' (indicating a potential reversal zone) is plotted from the recent low price to the candle base.
As price progresses, the boxes can either extend (if price stays within the zone) or close if a breakout happens.
For those who prefer a tabular view, an optional table displays the average MACD high and low, enhancing the on-chart data representation.
Use Cases:
Traders can use this indicator as an additional tool to spot potential breakout or reversal areas based on the MACD's behavior against its historical average. The visual representation in the form of boxes can assist in making better trading decisions by offering a clear picture of potential supply and demand zones.
Note: As with all trading indicators, it's advisable to use this tool in conjunction with other technical analysis methods or indicators for more informed decision-making.

itradesize /\ Overnight Session & Silver BulletOvernight Session & Silver Bullet indicator
The indicator can be divided into two separate stuff:
ONS ( Overnight Session ) based on TCM’s ( TheCurrencyMerchant ) theory and Silver Bullet based on what ICT ( InnerCircleTrader ) is teaching to us.
Overnight Session
• ONS will be always based on Chicago 4am to 8am time according to TCM’s CME teaching.
The indicator has the option to show TSO ( Today’s session only ) which is good to have the chart not messed up by it. At this time when it comes to backtesting just turn this off to have the past ONS and SB ranges showed up on your chart.
• Mid line at the ONS range is useful to have as you are able to decide wether price is in a premium or a discount under the ONS.
If Im a buyer target is above the range, if Im a seller target is below the range.
• You are also able to have SD ( Standard Deviation ) lines for price projections. In the variety of TCM’s videos you are able to have a deeper knowledge.
• You can also extend Today’s ONS lines to the very end of the chart which could make an easier looking on the levels you eyeing with.
Silver Bullet
It’s based on New York time as ICT ( Inner Circle Trader ) is always teaching to us that we should use New York time, every time when it comes to his concepts.
Silver Bullets are always be there aiming of an opposing liquidity pool. They are working even on choppy days.
Silver Bullet hours:
• 03:00 - 04:00am NY Time
• 10:00 - 11:00am NY Time
• 02:00 - 03:00pm NY Time
SB highlighted areas could be shown as a box or a range according to your taste, with or without Start/End lines.
Both of them ca be used to form trades.
You should dig yourself into Silver Bullet ( InnerCircleTrader ) and Overnight Session ( TheCurrencyMerchant ) teachings before the use of the indicator.
Simple setups
• Silver Bullet
Look 20-30 minutes before any SB where the Buy or Sell program has started.
Where the first 1m FVG ( Fair Value Gap ) appears under the range, enter the trade.
Expect only a 5 handle move as a beginner.
1m chart is a must for these kind of FVG entries. ( 30s , 15s can also be used )
• ONS
Price is trading aggressively out of the range to take liquidity.
Once price grabbed liquidity that candle on the 3-5m could considered as on order block for the further movement.
If you are trading in the range, then the opposite side can be the target, if its out of the range and trading one sided, then use standard deviations as 0.5 is a minimum target.

Automatic Order Block + Imbalance by D. BrigagliaThis script combines automatic orderblock and imbalance tracking.
Bullish OB - Blue
Bullish Imbalance - Green
Bearish OB - Red
Bearish Imbalance - Orange
Please note that the actual definitions of orderblock and imbalance are not respected in this script for the sake of simplicity. Scripts that are too complex may overfit some particular chart. Since there is no way to translate the actual ob and imb definitions into pinescript language, I decided to keep it simple.
Ideally, you want to see a bullish OB followed by buy side imbalance, or viceversa. OBs that are broken weakly are generally invalidated, ones that are broken strongly generally become breakers, and you can use them as good support/resistance levels.
Also, a good thing you can do when an OB and an imbalance match, is going in the lower timeframes and catching the structure reversal in the OB or imbalance zone. That may provide excellent RR trades. Always trade with OB that confirm the HTF trend.
Nothing in my content on tradingview is considerable investment advice.

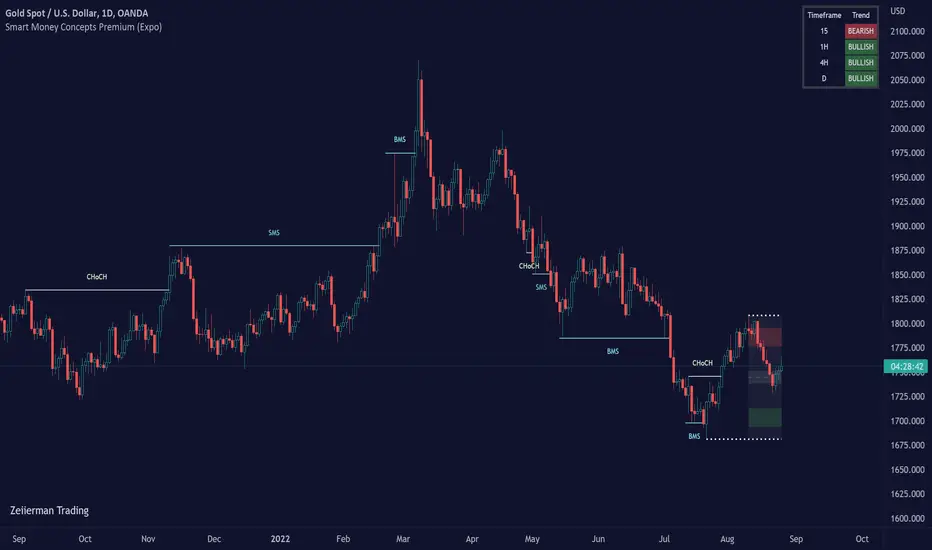
Smart Money Concepts Premium (Expo)Are you a professional Smart Money Concept Trader?
█ This premium version of our SMC indicator includes all advanced Smart Money Concept Trading techniques. The indicator includes all the important concepts such as Market Structure, Change of Character, Current Trading Range, Premium & Discount , Fractals, and Swing Structure. The indicator includes the popular SMC Market Structure Trend to help traders analyze the trend.
In addition to these features, this version adds the following:
Multitimeframe option
Predicted Structure and Range
Backtesting option
External Range Liquidity
Internal Range Liquidity
Liquidity Grab
Fair Value Gap (FVG)
True Fair Value Gap
Imbalance
Order block
Orderflow
Supply & Demand
Equal Highs and Equal Lows
Point of Interest
An alert function that allows you to set any combination of alerts.
This indicator aims to be an all-in-one SMC indicator that helps Smart Money Traders automate their analyzes.
█ HOW TO USE
Use the indicator to trade advanced SMC Trading techniques.
█ Settings
The indicator is fully customized and can be adjusted to fit Swing Trading, Trend Trading, Day Trading, or Scalping.
The indicator works in any market and timeframe.
-----------------
Disclaimer
Copyright by Zeiierman.
The information contained in my Scripts/Indicators/Ideas/Algos/Systems does not constitute financial advice or a solicitation to buy or sell any securities of any type. I will not accept liability for any loss or damage, including without limitation any loss of profit, which may arise directly or indirectly from the use of or reliance on such information.
All investments involve risk, and the past performance of a security, industry, sector, market, financial product, trading strategy, backtest, or individual's trading does not guarantee future results or returns. Investors are fully responsible for any investment decisions they make. Such decisions should be based solely on an evaluation of their financial circumstances, investment objectives, risk tolerance, and liquidity needs.
My Scripts/Indicators/Ideas/Algos/Systems are only for educational purposes!
Super OrderBlock / FVG / BoS Tools by makuchaku & eFeThis super indicator is a Swiss army knife for Smart Money traders for OrderBlocks / FVG / BoS
It provides many options for drawing (non-repainting) boxes for OrderBlocks, Fair Value Gaps (FVG) and Break of Structures. The boxes are extended into the future, until the first retest/mitigation.
Some of the additional options (not explained in the diagrams above)
PPDD OB : An order block which is formed after interacting with Liquidity (old low/high, fractal low/high, etc). Since these OB's are in the most premium or most discount, they are Premium Premium Discount Discount OB's (PPDD OB)
HVB Bars : When the volume of any bar is higher than the average volume of last N bars, it could mean something important (in the right context). Hence, the indicator allows for coloring them differently.
This indicator was built as a collaboration between @makuchaku & eFe
Pro tip : This indicator is a simply a tool to visualize trading concepts on the candle stick chart. It is the job of the trader to sequence these effectively into a profitable trade.
If you come across any bug or have a question on how to effectively use the indicator, please don't hesitate to ask questions.
Good luck & good trading!

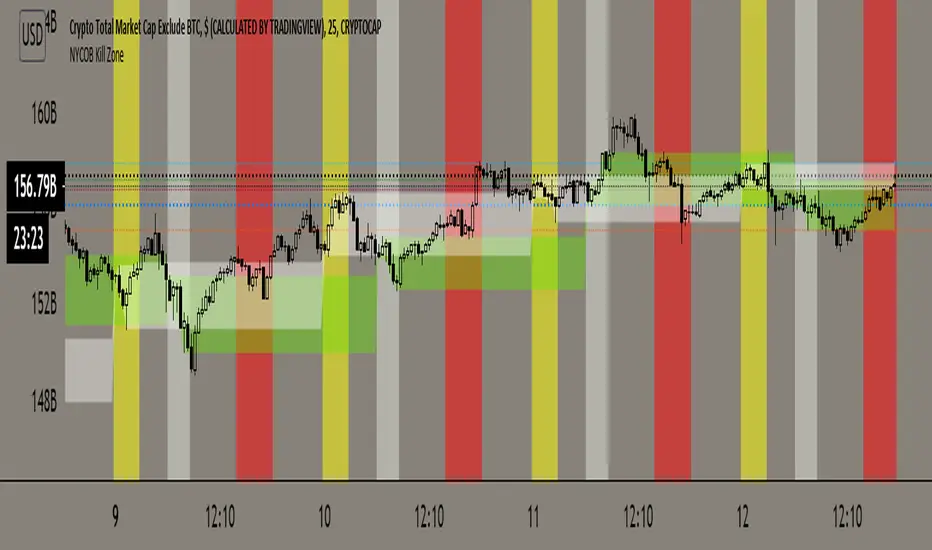
NYCOB Kill Zone StrategyI have now turned the NYCOB Kill zone into a stand alone strategy!
Fully customizable in regards to time of entry and levels of entry but the standard settings are the best all around.
Original NYCOB Kill Zone text below
This script plots the H and L of the first 2 hours of the NYC session and shades the space between in which i deem the NYC Order Block
It also maps out the First two hours on the chart as well so you can understand when the OB has formed
Over the past 3 years of trading cryptocurrency i have noticed a phenomena that has occurred nearly every day
The H or L will 90% of the time will be posted in the first two hours of this session
knowing this means you understand if you just wait til this time you can better your odds at not getting stop hunted due to poor entry
A few things to take from this study are these.
1. after the OB is formed
2. whichever side gets taken out first (H/L) will 90% define the bias for the day. I have found that using the m13-m15 TF will add some more confirmation with 1-2 closes outside of range H/L/
3. After general bias has formed 2 things can happen
A) PA just takes off and there is really nothing you can do about it unless you had other studies that told you that will happen
B) PA will dip back INTO the OB and create the OTE which is any retracement below the .5 Fibonacci of the shaded OB
4. Typically OTE happens after the session has ended
5. If you used OTE off of the past days NYCOB then you can use the new (forming or just formed) NYCOB to CONFIRM your initial bias presented from the previous days OTE and bias.
6. When PA cannot close outside the NYCOB it presents a range to range play where PA will visit the opposite side of the range to chase liquidity,
7. When the NYCOB is TIGHT then deviation is more likely to result in price expansion, when the NYCOB is WIDE then deviation tends to present more range to range plays.
8. After bias is formed and OTE has been made your stops should always be outside the NYCOB. I use the m30 or H1 ATR to get a slight cushion from the OB to ensure i dont get stop hunted.
Standard TP are all set at the same level but you can adjust them accordingly
Shout out to Elevate-Trading family member Boederzeng for helping me with the code!

Volume-based S/R Levels
█ OVERVIEW
After my last indicator "Order Block Finder" was unexpectedly popular with the TradingView community, I decided to publish another experimental indicator which again tries to identify "areas of interest"
Idea:
Often candles with long wicks represent strong buying & selling pressure, especially when they are combined with extraordinary volume. Especially interesting to me are the lower wicks on red candles and the upper wicks of green candles. These wicks can potentially indicate "areas of interest" by the bigger players in the market and price may interact with these levels again in the future.
This indicator tries to identify these "high volume / long wick" candles and paints a line of either Support or Resistance from the wick into the future.
█ CALCULATION LOGIC
Extraordinary Volume is identified by first calculating thresholds based on a volume Moving Average and Standard Deviations. Two Standard Deviation Values are entered to identify HIGH and EXTREME threshold levels. The current volume is classified by comparing the volume against these thresholds.
The following inputs can be made:
- Volume MA Length
- Standard Deviation Length
- Threshold for HIGH Volume (Number of StdDev)
- Threshold for EXTREME Volume (Number of StdDev)
Another entry parameter can be used to specify the Minimum Wick Length (in % of the candle body value) which identifies a "relevant" candle. If this value is set to 0, then there is no limit and all high volume candles are considered.
The identified Support/Resistance levels are shown as lines on the chart. The parameter "Length of lines (hours)" can be used to set the length of the lines (always in hours). Depending on the timeframe, this needs to be adjusted.
(I know that this can be solved more elegantly in pine, but it was just not important to me. As always everyone is free to copy the code and make improvements. Just give me a mention when you do.)
█ DISPLAY OPTIONS
Different display options are available in the settings:
- Display Support/Resistance: Select if you want to see only Support or Resistance lines - or both
- Display High/Extreme Volume: Select if you only want to see the Extreme Value Candles or the High Value Candles or both
- Display WICK / WICK Range: Select if you only want one line at the extreme value (High/Low) of the wick - or if you want to see a range (three lines - one at the top, one at the bottom and one in the middle of the wick)
- Show Signal Triangles?: This gives the option to show little triangles on all the identified candles
█ DISCLAIMER
This is an experimental indicator and I do not know if my theory works in real life. So treat this not as financial advise, but purely for entertainment and educational purposes.
As mentioned above, I publish this code open so that everyone can re-use it or hopefully even improve it.
Let me know if you have any ideas for improvement and if it is within my coding capabilities (which to be honest are quite limited), I will try to accomodate it.
Have fun.

FVG MTF II, multiple time frame Fair Value GapThis is FVG indicator, it outlines the location of the efficiently traded candle.
Areas that were traded in one direction, representing volume and unfilled gaps or hidden gaps in price.
An area where Price pass through long or short only, leaving it inefficiently traded and where the market with high probility might return to trade this area in a later time in the other direction leaving it efficiently traded or to rebalance.
you can use up to multiple time frames, for full market visibility.
Indentifies market impulsive move away from Order Block
This indicator captures 99.9% of FVG on your chart
This indicator works:
on every timeframe (eg. 1M, 5M, 15M, 30M, 1H, 4H, 6H, D, ...) up to 5 at the same time.
on cryptocurrencies (eg. BTCUSD, ETHUSD , ETHBTC, and BTC markets, ...)
on forex (eg. EURUSD , GPBUSD, NZDUSD , ...)
on stocks (eg. NKE, TSLA , AXP, BA, ...)
on commodities (eg. GOLD, SILVER, ...)
This indicator has following options:
edit color and size of label, you can choose your color base on your interedted time frame.
Please Pm me for use of indicator.

NYCOB Kill ZoneThis script plots the H and L of the first 2 hours of the NYC session and shades the space between in which i deem the NYC Order Block
It also maps out the First two hours on the chart as well so you can understand when the OB has formed
Over the past 3 years of trading cryptocurrency i have noticed a phenomena that has occurred nearly every day
The H or L will 90% of the time will be posted in the first two hours of this session
knowing this means you understand if you just wait til this time you can better your odds at not getting stop hunted due to poor entry
A few things to take from this study are these.
1. after the OB is formed
2. whichever side gets taken out first (H/L) will 90% define the bias for the day. I have found that using the m13-m15 TF will add some more confirmation with 1-2 closes outside of range H/L/
3. After general bias has formed 2 things can happen
A) PA just takes off and there is really nothing you can do about it unless you had other studies that told you that will happen
B) PA will dip back INTO the OB and create the OTE which is any retracement below the .5 Fibonacci of the shaded OB
4. Typically OTE happens after the session has ended
5. If you used OTE off of the past days NYCOB then you can use the new (forming or just formed) NYCOB to CONFIRM your initial bias presented from the previous days OTE and bias.
6. When PA cannot close outside the NYCOB it presents a range to range play where PA will visit the opposite side of the range to chase liquidity,
7. When the NYCOB is TIGHT then deviation is more likely to result in price expansion, when the NYCOB is WIDE then deviation tends to present more range to range plays.
8. After bias is formed and OTE has been made your stops should always be outside the NYCOB. I use the m30 or H1 ATR to get a slight cushion from the OB to ensure i dont get stop hunted.
AS of now this about all the information i have but i will continue to update this list in the comment section as more studies and results have been posted.
DM me on how to attain access.
Cheers