Fractal Breakout Trend Following StrategyOverview
The Fractal Breakout Trend Following Strategy is a trend-following system which utilizes the Willams Fractals and Alligator to execute the long trades on the fractal's breakouts which have a high probability to be the new uptrend phase beginning. This system also uses the normalized Average True Range indicator to filter trades after a large moves, because it's more likely to see the trend continuation after a consolidation period. Strategy can execute only long trades.
Unique Features
Trend and volatility filtering system: Strategy uses Williams Alligator to filter the counter-trend fractals breakouts and normalized Average True Range to avoid the trades after large moves, when volatility is high
Configurable Trading Periods: Users can tailor the strategy to specific market windows, adapting to different market conditions.
Flexible Risk Management: Users can choose the stop-loss percent (by default = 3%) for trades, but strategy also has the dynamic stop-loss level using down fractals.
Methodology
The strategy places stop order at the last valid fractal breakout level. Validity of this fractal is defined by the Williams Alligator indicator. If at the moment of time when price breaking the last fractal price is higher than Alligator's teeth line (8 period SMA shifted 5 bars in the future) this is a valid breakout. Moreover strategy has the additional volatility filtering system using normalized ATR. It calculates the average normalized ATR for last user-defined number of bars and if this value lower than the user-defined threshold value the long trade is executed.
When trade is opened, script places the stop loss at the price higher of two levels: user defined stop-loss from the position entry price or down fractal validation level. The down fractal is valid with the rule, opposite as the up fractal validation. Price shall break to the downside the last down fractal below the Willians Alligator's teeth line.
Strategy has no fixed take profit. Exit level changes with the down fractal validation level. If price is in strong uptrend trade is going to be active until last down fractal is not valid. Strategy closes trade when price hits the down fractal validation level.
Risk Management
The strategy employs a combined approach to risk management:
It allows positions to ride the trend as long as the price continues to move favorably, aiming to capture significant price movements. It features a user-defined stop-loss parameter to mitigate risks based on individual risk tolerance. By default, this stop-loss is set to a 3% drop from the entry point, but it can be adjusted according to the trader's preferences.
Justification of Methodology
This strategy leverages Williams Fractals to open long trade when price has broken the key resistance level to the upside. This resistance level is the last up fractal and is shall be broken above the Williams Alligator's teeth line to be qualified as the valid breakout according to this strategy. The Alligator filtering increases the probability to avoid the false breakouts against the current trend.
Moreover strategy has an additional filter using Average True Range(ATR) indicator. If average value of ATR for the last user-defined number of bars is lower than user-defined threshold strategy can open the long trade according to open trade condition above. The logic here is following: we want to open trades after period of price consolidation inside the range because before and after a big move price is more likely to be in sideways, but we need a trend move to have a profit.
Another one important feature is how the exit condition is defined. On the one hand, strategy has the user-defined stop-loss (3% below the entry price by default). It's made to give users the opportunity to restrict their losses according to their risk-tolerance. On the other hand, strategy utilizes the dynamic exit level which is defined by down fractal activation. If we assume the breaking up fractal is the beginning of the uptrend, breaking down fractal can be the start of downtrend phase. We don't want to be in long trade if there is a high probability of reversal to the downside. This approach helps to not keep open trade if trend is not developing and hold it if price continues going up.
Backtest Results
Operating window: Date range of backtests is 2023.01.01 - 2024.05.01. It is chosen to let the strategy to close all opened positions.
Commission and Slippage: Includes a standard Binance commission of 0.1% and accounts for possible slippage over 5 ticks.
Initial capital: 10000 USDT
Percent of capital used in every trade: 30%
Maximum Single Position Loss: -3.19%
Maximum Single Profit: +24.97%
Net Profit: +3036.90 USDT (+30.37%)
Total Trades: 83 (28.92% win rate)
Profit Factor: 1.953
Maximum Accumulated Loss: 963.98 USDT (-8.29%)
Average Profit per Trade: 36.59 USDT (+1.12%)
Average Trade Duration: 72 hours
These results are obtained with realistic parameters representing trading conditions observed at major exchanges such as Binance and with realistic trading portfolio usage parameters.
How to Use
Add the script to favorites for easy access.
Apply to the desired timeframe and chart (optimal performance observed on 4h and higher time frames and the BTC/USDT).
Configure settings using the dropdown choice list in the built-in menu.
Set up alerts to automate strategy positions through web hook with the text: {{strategy.order.alert_message}}
Disclaimer:
Educational and informational tool reflecting Skyrex commitment to informed trading. Past performance does not guarantee future results. Test strategies in a simulated environment before live implementation
Search in scripts for "profit factor"

Momentum Alligator 4h Bitcoin StrategyOverview
The Momentum Alligator 4h Bitcoin Strategy is a trend-following trading system that operates on dual time frames. It utilizes the 1D Williams Alligator indicator to identify the prevailing major price trend and seeks trading opportunities on the 4-hour (4h) time frame when the momentum is turning up. The strategy is designed to close trades if the trend fails to develop or holding position if price continues increasing without any significant correction. Note that this strategy is specifically tailored for the 4-hour time frame.
Unique Features
2-layers market noise filtering system: Trades are only initiated in the direction of the 1D trend, determined by the Williams Alligator indicator. This higher time frame confirmation filters out minor trade signals, focusing on more substantial opportunities. At the same time, strategy has additional filter on 4h time frame with Awesome Oscillator which is showing the current price momentum.
Flexible Risk Management: The strategy exclusively opens long positions, resulting in fewer trades during bear markets. It incorporates a dynamic stop-loss mechanism, which can either follow the jaw line of the 4h Alligator or a user-defined fixed stop-loss. This flexibility helps manage risk and avoid non-trending markets.
Methodology
The strategy initiates a long position when the d-line of Stochastic RSI crosses up it's k-line. It means that there is a high probability that price momentum reversed from down to up. To avoid overtrading in potentially choppy markets, it skips the next two trades following a winning trade, anticipating sideways movement after a significant price surge.
This strategy has two layers trades filtering system: 4h and 1D time frames. The first one is awesome oscillator. It shall be increasing and value has to be higher than it's 5-period SMA. This is an additional confirmation that long trade is opened in the direction of the current momentum. As it was mentioned above, all entry signals are validated against the 1D Williams Alligator indicator. A trade is only opened if the price is above all three lines of the 1D Alligator, ensuring alignment with the major trend.
A trade is closed if the price hits the 4h jaw line of the Alligator or reaches the user-defined stop-loss level.
Risk Management
The strategy employs a combined approach to risk management:
It allows positions to ride the trend as long as the price continues to move favorably, aiming to capture significant price movements. It features a user-defined stop-loss parameter to mitigate risks based on individual risk tolerance. By default, this stop-loss is set to a 2% drop from the entry point, but it can be adjusted according to the trader's preferences.
Justification of Methodology
This strategy leverages Stochastic RSI on 4h time frame to open long trade when momentum started reversing to the upside. On the one hand, Stochastic RSI is one of the most sensitive indicator, which allows to react fast on the potential trend reversal. On the other hand, this indicator can be too sensitive and provide a lot of false trend changing signals. To eliminate this weakness we use two-layers trades filtering system.
The first layer is the 4h Awesome oscillator. This is less sensitive momentum indicator. Usually it starts increasing when price has already passed significant distance from the actual reversal point. The strategy opens long trade only is Awesome oscillator is increasing and above it's 5-period SMA. This approach increases the probability to filter the false signals during the choppy market or if the reversal is false.
The second layer filter is the Williams Alligator indicator on 1D time frame. The 1D Alligator serves as a filter for identifying the primary trend and increases probability to avoid the trades with low potential because trading against major trend usually is more risky. It's much better to catch the trend continuation than local bounce.
Last but not least feature of this strategy is close trades condition. It uses the flexible approach. First of all, user can set up the fixed stop-loss according to his own risk-tolerance, by default this value is 2% of price movement. It restricts the potential loss at the moment when trade has just been opened. Moreover strategy utilizes the 4h Williams Alligator's jaw line to exit the trade. If price fell below it trade is closed. This approach helps to not keep open trade if trend is not developing and hold it if price continues going up.
Backtest Results:
Operating window: Date range of backtests is 2021.01.01 - 2024.05.01. It is chosen to let the strategy to close all opened positions.
Commission and Slippage: Includes a standard Binance commission of 0.1% and accounts for possible slippage over 5 ticks.
Initial capital: 10000 USDT
Percent of capital used in every trade: 50%
Maximum Single Position Loss: -3.04%
Maximum Single Profit: +29.67%
Net Profit: +6228.01 USDT (+62.28%)
Total Trades: 118 (24.58% win rate)
Profit Factor: 1.71
Maximum Accumulated Loss: 1527.69 USDT (-11.52%)
Average Profit per Trade: 52.78 USDT (+0.89%)
Average Trade Duration: 60 hours
These results are obtained with realistic parameters representing trading conditions observed at major exchanges such as Binance and with realistic trading portfolio usage parameters.
How to Use:
Add the script to favorites for easy access.
Apply to the 4h timeframe desired chart (optimal performance observed on the BTC/USDT).
Configure settings using the dropdown choice list in the built-in menu.
Set up alerts to automate strategy positions through web hook with the text: {{strategy.order.alert_message}}
Disclaimer:
Educational and informational tool reflecting Skyrex commitment to informed trading. Past performance does not guarantee future results. Test strategies in a simulated environment before live implementation

Single Swing Strategy (SSS)Introduction
The Single Swing Strategy (SSS) is a trading strategy designed for assets that trend. It utilises a single technical indicator to identify potential buying opportunities in upward-trending markets. The strategy focuses on moments when the price of an asset breaks out to a new high, suggesting a strong upward momentum.
Components
1. Exponential Moving Averages (EMAs): SSS uses two EMAs to evaluate the overall asset trend. SSS describes an uptrend as identified, when the fast EMA crosses above the slow EMA and vice versa for a downtrend.
2. Breakout: The strategy validates the trend identified by the EMAs through breakouts in the price action of the asset over a specified lookback period. No indicator is required for this step.
3. Average Directional Index (ADX): The ADX is used to measure the strength of a trend. It does not indicate the trend's direction but rather its strength, whether it's an uptrend or downtrend. A high ADX value (typically above 25) suggests a strong trend, either up or down while a low ADX value (typically below 20) indicates a weak or non-trending market. The ADX itself is a moving average of the expanding range between the +DI and -DI.
4. Positive Directional Indicator (DI+): DI+ helps identify the presence and strength of uptrends. It is calculated based on the upward price movement between current and previous highs. A rising DI+ alongside a rising ADX suggests a strengthening uptrend. When DI+ crosses above DI-, it's often interpreted as a bullish signal.
5. Negative Directional Indicator (DI-): DI- is used to detect the presence and strength of downtrends.It is derived from the downward price movement between current and previous lows. An increasing DI- along with a rising ADX indicates a strengthening downtrend while a crossover of DI- above DI+ is typically seen as a bearish signal.
How it works
1. Regime filter with ADX, DI+, and DI-: The first step in taking a trade is to determine the direction of the trend using the +DI. If in an uptrend, the strategy checks if the ADX is above 25 to confirm a strong uptrend. -DI is not used since the strategy is long only. If in an uptrend and the trend is strong, trades can be opened.
2. Trend Identification with EMAs: Initially, the strategy uses two Exponential Moving Averages (fast and slow) to determine the asset trend. A fast EMA crossing above the slow EMA signifies an uptrend, and vice versa for a downtrend. This is the Entry signal to open a long position.
3. Trend Confirmation with Breakout: The strategy confirms the EMA-indicated trend through price breakouts over a specified lookback period. An EMA crossover without a price action breakout does not lead to an entry signal
4. Trade Management: After entering a trade, the strategy uses predefined levels for taking profit and setting stop losses. Trades are closed either when the price reaches the take-profit level or falls to the stop-loss level. Hence, risk management is built in.
Results
The backtest results can be found below. Initial capital of 10000 was used, this is a convenient amount for most retail traders, commission of $3 per order, position size of 3% of initial capital and slippage of 3 ticks. These are all representative of real world retail trading conditions.
Originality
The Single Swing Strategy (SSS)'s originality is in its blending of classical technical analysis; Trend Analysis through EMAs and Price Action through Breakout, into an innovative trading logic.
1. The Essence of Trend and Breakout in SSS
(i) Trend Recognition: At the heart of SSS is the Exponential Moving Averages (EMAs). While the use of EMAs is common, SSS employs them for trend analysis so an entry decision can be made. The strategy's core algorithm assesses the inception of an upward trend by observing a specific crossing pattern of the EMAs, a moment where the asset's momentum shifts, offering a strategic advantage.
(ii) Breakout Significance: The strategy's reliance on price breakouts isn't just about identifying a new high; it's about understanding market psychology. A breakout beyond a previous high signals not only momentum but also a collective market sentiment that favors upward movement. SSS attempts to capture this momentum, translating it into a tangible trading opportunity.
(iii)Strength of trend: The ADX and +DI double checks the trend is in the right direction and checks to see if the trend is strong enough hence, it prevents trading when the trend is not supportive.
2. Simplicity as a Cornerstone
(i) Clarity and Efficiency: In the realm of algorithmic trading, complexity isn't always synonymous with effectiveness. SSS' simplicity ensures its logic is transparent and its execution, efficient. This simplicity is a strategic choice, designed to reduce overfitting to past data and improve adaptability to real-market conditions.
(ii) Ease of Use and Decision Making: The straightforward nature of SSS may empower traders to make informed decisions without being overwhelmed by convoluted indicators. This is particularly useful because of the embedding of risk management using defined exit points after entry through a Take Profit and Stop Loss. This hardcodes a 3:1 risk reward ratio into every trade.
3. Positive Expectancy
(i) Performance Metrics: The SSS strategy shows its edge in its backtesting results. A 62% win rate, a profit factor of 1.7, profit ratio of 1.05 and an average trade gain of 4.7% are not just numbers; they show the mathematical edge over the backtest period, especially considering the high commissions and slippage factored into its design.
Trading
The SSS strategy has been backtested on the 1D timeframe of BTCUSD but users are encouraged to try it on other assets such as SPXL (5min), AAPL (5min) and others but the appropriate timeframe and trading costs may vary.
NOTE
Like any trading strategy, SSS does not guarantee profits. It's a tool to assist in decision-making, not a foolproof solution. Trading involves risks, particularly in volatile markets. Users should trade responsibly, considering their risk tolerance and financial situation. While SSS automates some aspects of trading, it requires continuous monitoring and does not replace the need for sound judgement and decision-making by the trader.

[Joy] Jasmine Strategy for Bitcoin and CryptoIt is my strategy I use for spot and future trading, mostly for BTCUSD
Notable parameters used:
INDEX:BTCUSD
Data: 2017 - today
Long trade margin/leverage: 8x (50/8 = 6.25)
Short trade margin/leverage: 1x (50/50 = 1)
Commission: 0.075%
Initial Capital: $15, 000
Results:
Net profit: 832.74 %
Buy & Hold: 602.56 %. It beats the buy and hold.
Percent profitability: 88 % . It means 8 out of 10 trades resulted in profits.
Margin Calls: 0 (i.e. Never had a margin call according to backtest from 2017 till today)
Total closes trades: 25
Profit factor: 8.238
Avg Winning Trade: 43.08 %
Largest Winning Trade: 334.85 %
Avg # Bars in Winning Trades: 44 (i.e. 88 days)
Sharpe Ratio: 0.61. A Sharpe ratio under 1.0 is considered sub-optimal. Because of the big swings, I cannot make the Sharpe ratio any better at this time.
Sortino Ratio: 5.153. I think a Sortino ratio of 3.0 or higher is considered excellent. Do your research.
I am using 7.1% stop loss on long trades. However, you can turn off the stop loss and note the profitability remains the same.
Do remember there may be other costs, such as funding costs.
Description:
The strategy hunts for a few market features, namely breakouts, abnormal wicks relative to the body, abnormal volume relative to the candle characteristics, and possible confirmation of all these. It also hunts for more aspects. It gives a relative score of each of the characteristics. Finally, it tries to draw a guesstimate. In the end, it is only a guesstimate. Users see the final outcome (buy/sell etc). The whole logic happens at the background.
The strategy is not to be used for scalping, day trading or swing trading. In other words, it is not suitable for trading in a lower timeframe. It is to be used for Positional Trading For example, if one is trying this for BTCUSD, one may only try this for BTCUSD in a 2day timeframe and not in lower timeframes (such as 4 hours or 1 hour etc.) I am primarily interested in BTC for my research. However, it may be tested on other cryptos as well with varying degrees of results.
Please remember that past performance does not be indicative of future results. Different types of investments involve varying degrees of risk. There can be no assurance that the information referred to directly or indirectly in this strategy will be profitable, equal to any corresponding historical performance level(s), or suitable for you in any form or shape. Market condition changes very fast. Moreover, it would be best if you did not assume that any discussion or information contained here serves as the receipt of, or as a substitute for, personalized investment advice. I am not a financial advisor. I have no qualifications to be a financial advisor. It is only for educational and research purposes. Readers are encouraged to consult with a professional advisor of his/her choosing. Neither I nor my indicators or strategies take any responsibility for any misuse of the information for any actual trading. Even though this strategy did 88% profitability from 2017-2021, it may do poorly and may even be NOT profitable in the future.

SQZ Multiframe StrategyThis is a first attempt to automate what my current strategy when trading is.
It uses 2 timeframes: the one you are currently using to see the chart and an "anchor trend" which is a higher order frame.
Supported timeframes are: 1m, 5m, 15m, 30m, 1H, 4H, 1D, 1W
The Strategy relies on two indicators:
Squeeze Momentum Indicator
CMF
How does it works?
It looks for a moment when the following conditions are met.
For Long:
Positive directionality in SQZM monitor in anchor timeframe
Positive directionality in SQZM monitor in current timeframe
Recent minimum in CMF
For Short:
Negative directionality in SQZM monitor in anchor timeframe
Negative directionality in SQZM monitor in current timeframe
Recent maximum in CMF
After a BUY or SELL order is executed the plot will start showing two lines: A TP line, and a SL line.
The TP and SL move dynamically based on a greedy algorithm based on 3 input parameters.
Min Profit to Start Moving SL (%): Sets an initial target for the trade.
Maximum Possible of SL (%): This is the maximum amount possible for SL. If volatility is not too high, a shorter SL will be chosen based on Kaufman's Stops method
Take profit factor: Is how much portion of the target I am taking as profit once the target is reached
Example for 5% Min profit:
When the first target is reached (+5%), the SL will be updated to 2.5% over the enter price.
When the second target is reached (+10%), the SL will be updated to 5% over the enter price.
Note: The strategy might abandon the position prematurely if a contrary signal is received while the trade is opened, and will change direction.
The Strategy has been backtested mostly for crypto. It might be good for stocks too, but the parameters mentioned might need some adjustments since price moves at a different rate.
Recommended timeframe is 4H for BTC , and 30min/1H for alts.
Comments and ideas are more than welcome!

[Joy] Aladdin Long Trading Strategy 1.0.0 AlphaAladdin's Long trading strategy is to test out Aladdin for long trades only
This strategy is mainly used to test whether Aladdin is suitable for a coin/stocks/futures or for any trading. The profitability, average drawdown, average profits, etc are used by me to decide whether to use it for trading.
What is Aladdin and what does it do?
Using the volume and gradual flow of non-interrupted data (wicks and body of the candles), it tries to detect the macro condition of the market so that one may know in which direction the market is flowing.
* Bearish / Sell sign: On the candle's close, I open a short position
* Bullish sign: On the candle's close, I open a long position
* I take at least 50% profit when the indicator indicates to do so. One can configure that value as desired from the configuration depending on one's risk/money management. I might even convert some portion of the position into stable coins.
FAQ
Q: Does it use some EMA /MA/etc.? Does it use any indicator with tweaked settings?
Answer: No.
Q: What does it mostly depend on?
Answer: Volume and gradual flow of non-interrupted data. The logic depends purely on volume , price bars and the wicks.
Q: Does it work with all coins, stocks, futures, instruments?
Answer: I prefer to use the exchange with the best possible data. Then backtest out to find the best possible timeframe, stop loss and target all derived from this script data.
Q: Can you make it free or make it open source?
Answer: There is no free lunch in this world. I will never reveal or share the source code!
Q: Do you provide ongoing support for the indicator?
Answer: Yes, as long as I can, I will continue updating the indicator
Q: Are the bullish /buy & the bearish/sell markers automatic?
Answer: I have no control over the markers. It is driven purely by logic from the script.
Q: Is this financial advice?
Answer: This is not financial advice. I do not guarantee any profit or loss. I am not responsible for any of your losses or profits. My indicators do not assure profit or loss. It also does not auto-open or auto-close a trade.
Assumptions:
Only long trades are opened and closed. No short trades.
Starting Capital: $20,000
Order Size: 20% of Capital
Data used: Whatever data is available from 2011 till today on Trading view
Findings:
INDEX: BTCUSD 83% profitability using 2day tf
54 closed trades
Profit factor: 16
Sortino Ratio: 5.2
Average Winning Trade: 30%
Average Losing Trade: 9.12%
Largest Winning Trade: 1218%
Largest Losing Trade: 20.25%
Below are the profitability rate for the timeframe and the coins listed as found by running the trading strategy over the following as of today (Aug 1st 2021 12:40 pm Sydney Time).
⚜️ INDEX:BTCUSD 83% using 2day tf
⚜️INDEX:ETHUSD 80% using 1day tf
⚜️FTTUSD 81% using 2day tf
⚜️SRMUSD 71% using 1day tf
⚜️ADAUSDT 81% using 2day tf
⚜️ALGOUSD > 90% using 2day tf
⚜️ALTPERP 81% using 2day tf
⚜️AVAXUSDT 75% using 1day tf
⚜️BANDUSD > 90% using 2day tf
⚜️BCHUSD 82% using 2day tf
⚜️BNBUSD 79% using 1day tf
⚜️BNBUSD 85% using 2day tf
⚜️CHZUSD 71% using 1day tf
⚜️COMPUSD 81% using 1day tf
⚜️DOGEUSD 77% using 1day tf
⚜️EXCHPERP 83% using 1day tf
⚜️FILUSD > 90% using 1day tf
⚜️FTMUSD 70% using 2day tf
⚜️HTUSDT 75% using 2day tf
⚜️KINUSD >90% using 2day tf
⚜️LINKPERP 85% using 2day tf
⚜️LTCUSD 80% using 2day tf
⚜️MATICUSD 77% using 2day tf
⚜️NEOUSD 80% using 1day tf
⚜️NEXOUSD > 90% using 1day tf
⚜️OKBUSD 71% using 1day tf
⚜️OMGUSD 75% using 1day tf
⚜️RSRUSD 87% using 1day tf
⚜️RUNEUSD > 90% using 1day tf
⚜️SHITPERP > 90% using 1day tf
⚜️SOLUSD 84% using 1day tf
⚜️SUSHIUSD 71% using 1day tf
⚜️THETAUSD > 90% using 2day tf
⚜️UNIPERP 83% using 1day tf
⚜️VERTPERP > 90% using 1day tf
⚜️XAUUSD 63% using 2day tf
⚜️XTZUSD 83% using 2day tf
⚜️ZECUSD 72% using 2day tf
Disclaimer:
No one knows what will happen in the future. DYOR and decide on your own conditions. Do realize that neither I nor my indicator can guarantee any profit or loss. And there is no assurance that any trade will ever result in any profit. It is not financial advice.

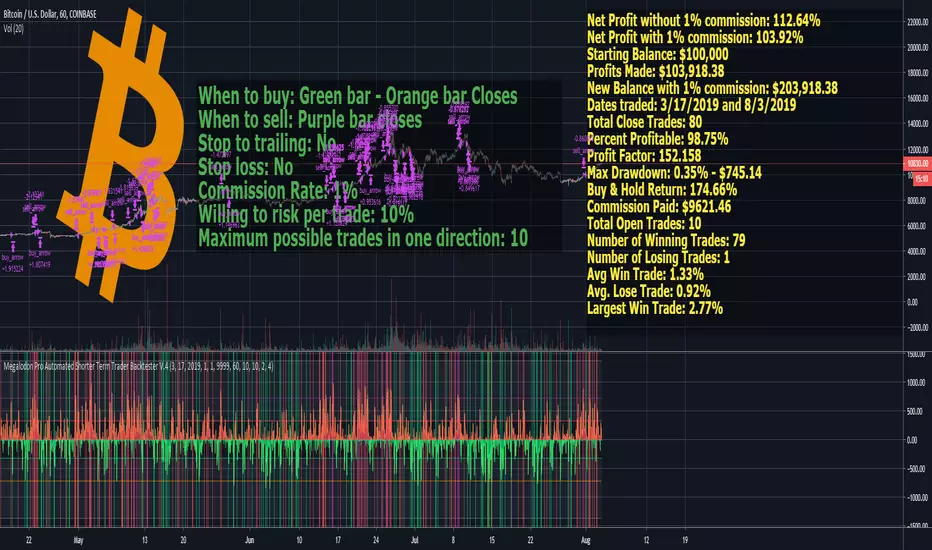
Megalodon Pro Automated Shorter Term Trader BacktesterSTRATEGY
When to buy: Green bar - Orange bar Closes
When to sell: Purple bar closes
Stop to trailing: No
Stop loss: No
Commission Rate: 1%
Willing to risk per trade: 10%
Maximum possible trades in one direction: 10
RESULTS
Net Profit without 1% commission: 112.64%
Net Profit with 1% commission: 103.92%
Starting Balance: $100,000
Profits Made: $103,918.38
New Balance with 1% commission: $203,918.38
Dates traded: 3/17/2019 and 8/3/2019
Total Close Trades: 80
Percent Profitable: 98.75%
Profit Factor: 152.158
Max Drawdown: 0.35% - $745.14
Buy & Hold Return: 174.66%
Commission Paid: $9621.46
Total Open Trades: 10
Number of Winning Trades: 79
Number of Losing Trades: 1
Avg Win Trade: 1.33%
Avg. Lose Trade: 0.92%
Largest Win Trade: 2.77%
Let me know what you guys think about the results?
Due to the tradingview's limitations on providing the shorter time frame price data, we had to provide a 60 minute time frame backtesting results.
The shorter time frames including 1 minute and 15 minutes backtesting results are way more accurate and precise than 60 minutes time frame results.
Megalodon Trading
Enlightening the Modern Investors
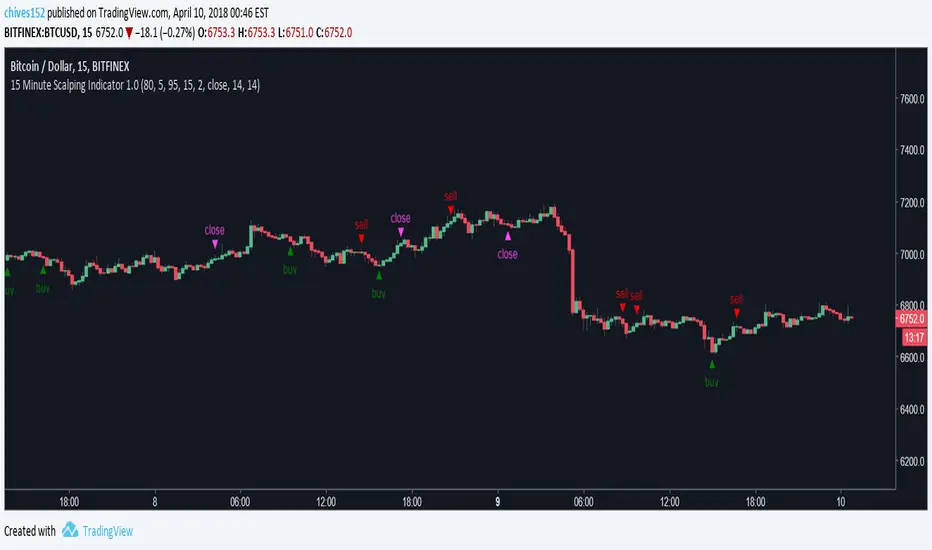
15 Minute Bitcoin Indicator 1.0Indicator Description:
This is a premium indicator that is intended for trading on the 15 minute time scale. This script uses ADX to judge the strength of trends. When a trend is confirmed by ADX, the indicator uses SRSI to find the optimal entry. The indicator works best on BITFINEX:BTCUSD .
Instructions:
Whenever there is a sell signal exit the current long and vice versa. If a close signal appears close the current position but do not open another trade in opposite direction. There is a indicator based stop loss system that is built into the signals, but no static stop loss based on % loss or pips moved in one direction.
Available Settings :
1. Buying and Selling Thresholds: These are the values that are used with SRSI to determine entries. The default values were experimentally determined
to be the most profitable.
2. Stacked Orders Allowed: This limits the amount of positions that can be entered in the same direction. This is useful for trading with leverage. This is defaulted to 2 because I limit myself to 2x leverage. Backtesting shows the more orders allowed, the more profitable, but also risk is increased.
3. ADX/DI Settings: These are settings the ADX smoothing and DI length.
Backtesting:
CLICK HERE
This is a strategy that enters and exits positions on the exact same criteria as this indicator. For the simulation the capital was 10,000 dollars and it was allowed to go up to 2x leverage. Each trade used 100% of available funds. The same simulation done from 1/1/2018 to 4/10/2018 resulted in:
3658.38 % Net Profit
316 Total Closed Trades
77.22 % Profitable
4.552 Profit Factor
24 % Max Drawdown
+11.58% Average Trade
20 15m candles in each trade on average.
Future Plans:
More robust stop loss system.
Factoring trend into trading signals.
EMA integration.
MULTI-TIMEFRAME SUPPORT
Availability
This indicator is currently in a testing stage of development with a full release planned for mid April. While the indicator is not completed, it currently is profitable for me to consider it ready for release. During this testing phase anyone can test it for free for three days, just comment below. Lifetime access currently costs .005 btc, and this price will increase once the full release occurs, if you are interested, DM me for further details.
Please comment with any ideas, suggestions, or criticisms.
Optimized ADX DI CCI Strategy### Key Features:
- Combines ADX, DI+/-, CCI, and RSI for signal generation.
- Supports customizable timeframes for indicators.
- Offers multiple exit conditions (Moving Average cross, ADX change, performance-based stop-loss).
- Tracks and displays trade statistics (e.g., win rate, capital growth, profit factor).
- Visualizes trades with labels and optional background coloring.
- Allows countertrading (opening an opposite trade after closing one).
1. **Indicator Calculation**:
- **ADX and DI+/-**: Calculated using the `ta.dmi` function with user-defined lengths for DI and ADX smoothing.
- **CCI**: Computed using the `ta.cci` function with a configurable source (default: `hlc3`) and length.
- **RSI (optional)**: Calculated using the `ta.rsi` function to filter overbought/oversold conditions.
- **Moving Averages**: Used for CCI signal smoothing and trade exits, with support for SMA, EMA, SMMA (RMA), WMA, and VWMA.
2. **Signal Generation**:
- **Buy Signal**: Triggered when DI+ > DI- (or DI+ crosses over DI-), CCI > MA (or CCI crosses over MA), and optional ADX/RSI filters are satisfied.
- **Sell Signal**: Triggered when DI+ < DI- (or DI- crosses over DI+), CCI < MA (or CCI crosses under MA), and optional ADX/RSI filters are satisfied.
3. **Trade Execution**:
- **Entry**: Long or short trades are opened using `strategy.entry` when signals are detected, provided trading is allowed (`allow_long`/`allow_short`) and equity is positive.
- **Exit**: Trades can be closed based on:
- Opposite signal (if no other exit conditions are used).
- MA cross (price crossing below/above the exit MA for long/short trades).
- ADX percentage change exceeding a threshold.
- Performance-based stop-loss (trade loss exceeding a percentage).
- **Countertrading**: If enabled, closing a trade triggers an opposite trade (e.g., closing a long opens a short).
4. **Visualization**:
- Labels are plotted at trade entries/exits (e.g., "BUY," "SELL," arrows).
- Optional background coloring highlights open trades (green for long, red for short).
- A statistics table displays real-time metrics (e.g., capital, win rates).
5. **Trade Tracking**:
- Tracks the number of long/short trades, wins, and overall performance.
- Monitors equity to prevent trading if it falls to zero.
### 2.3 Key Components
- **Indicator Calculations**: Uses `request.security` to fetch indicator data for the specified timeframe.
- **MA Function**: A custom `ma_func` handles different MA types for CCI and exit conditions.
- **Signal Logic**: Combines crossover/under checks with recent bar windows for flexibility.
- **Exit Conditions**: Multiple configurable exit strategies for risk management.
- **Statistics Table**: Updates dynamically with trade and capital metrics.
## 3. Configuration Options
The script provides extensive customization through input parameters, grouped for clarity in the TradingView settings panel. Below is a detailed breakdown of each setting and its impact.
### 3.1 Strategy Settings (Global)
- **Initial Capital**: Default `10000`. Sets the starting capital for backtesting.
- **Effect**: Determines the base equity for calculating position sizes and performance metrics.
- **Default Quantity Type**: `strategy.percent_of_equity` (50% of equity).
- **Effect**: Controls the size of each trade as a percentage of available equity.
- **Pyramiding**: Default `2`. Allows up to 2 simultaneous trades in the same direction.
- **Effect**: Enables multiple entries if conditions are met, increasing exposure.
- **Commission**: 0.2% per trade.
- **Effect**: Simulates trading fees, reducing net profit in backtesting.
- **Margin**: 100% for long and short trades.
- **Effect**: Assumes no leverage; adjust for margin trading simulations.
- **Calc on Every Tick**: `true`.
- **Effect**: Ensures real-time signal updates for precise execution.
### 3.2 Indicator Settings
- **Indicator Timeframe** (`indicator_timeframe`):
- **Options**: `""` (chart timeframe), `1`, `5`, `15`, `30`, `60`, `240`, `D`, `W`.
- **Default**: `""` (uses chart timeframe).
- **Effect**: Determines the timeframe for ADX, DI, CCI, and RSI calculations. A higher timeframe reduces noise but may delay signals.
### 3.3 ADX & DI Settings
- **DI Length** (`adx_di_len`):
- **Default**: `30`.
- **Range**: Minimum `1`.
- **Effect**: Sets the period for calculating DI+ and DI-. Longer periods smooth trends but reduce sensitivity.
- **ADX Smoothing Length** (`adx_smooth_len`):
- **Default**: `14`.
- **Range**: Minimum `1`.
- **Effect**: Smooths the ADX calculation. Longer periods produce smoother ADX values.
- **Use ADX Filter** (`use_adx_filter`):
- **Default**: `false`.
- **Effect**: If `true`, requires ADX to exceed the threshold for signals to be valid, filtering out weak trends.
- **ADX Threshold** (`adx_threshold`):
- **Default**: `25`.
- **Range**: Minimum `0`.
- **Effect**: Sets the minimum ADX value for valid signals when the filter is enabled. Higher values restrict trades to stronger trends.
### 3.4 CCI Settings
- **CCI Length** (`cci_length`):
- **Default**: `20`.
- **Range**: Minimum `1`.
- **Effect**: Sets the period for CCI calculation. Longer periods reduce noise but may lag.
- **CCI Source** (`cci_src`):
- **Default**: `hlc3` (average of high, low, close).
- **Effect**: Defines the price data for CCI. `hlc3` is standard, but users can choose other sources (e.g., `close`).
- **CCI MA Type** (`ma_type`):
- **Options**: `SMA`, `EMA`, `SMMA (RMA)`, `WMA`, `VWMA`.
- **Default**: `SMA`.
- **Effect**: Determines the moving average type for CCI signal smoothing. EMA is more responsive; VWMA weights by volume.
- **CCI MA Length** (`ma_length`):
- **Default**: `14`.
- **Range**: Minimum `1`.
- **Effect**: Sets the period for the CCI MA. Longer periods smooth the MA but may delay signals.
### 3.5 RSI Filter Settings
- **Use RSI Filter** (`use_rsi_filter`):
- **Default**: `false`.
- **Effect**: If `true`, applies RSI-based overbought/oversold filters to signals.
- **RSI Length** (`rsi_length`):
- **Default**: `14`.
- **Range**: Minimum `1`.
- **Effect**: Sets the period for RSI calculation. Longer periods reduce sensitivity.
- **RSI Lower Limit** (`rsi_lower_limit`):
- **Default**: `30`.
- **Range**: `0` to `100`.
- **Effect**: Defines the oversold threshold for buy signals. Lower values allow trades in more extreme conditions.
- **RSI Upper Limit** (`rsi_upper_limit`):
- **Default**: `70`.
- **Range**: `0` to `100`.
- **Effect**: Defines the overbought threshold for sell signals. Higher values allow trades in more extreme conditions.
### 3.6 Signal Settings
- **Cross Window** (`cross_window`):
- **Default**: `0`.
- **Range**: `0` to `5` bars.
- **Effect**: Specifies the lookback period for detecting DI+/- or CCI crosses. `0` requires crosses on the current bar; higher values allow recent crosses, increasing signal frequency.
- **Allow Long Trades** (`allow_long`):
- **Default**: `true`.
- **Effect**: Enables/disables new long trades. If `false`, only closing existing longs is allowed.
- **Allow Short Trades** (`allow_short`):
- **Default**: `true`.
- **Effect**: Enables/disables new short trades. If `false`, only closing existing shorts is allowed.
- **Require DI+/DI- Cross for Buy** (`buy_di_cross`):
- **Default**: `true`.
- **Effect**: If `true`, requires a DI+ crossover DI- for buy signals; if `false`, DI+ > DI- is sufficient.
- **Require CCI Cross for Buy** (`buy_cci_cross`):
- **Default**: `true`.
- **Effect**: If `true`, requires a CCI crossover MA for buy signals; if `false`, CCI > MA is sufficient.
- **Require DI+/DI- Cross for Sell** (`sell_di_cross`):
- **Default**: `true`.
- **Effect**: If `true`, requires a DI- crossover DI+ for sell signals; if `false`, DI+ < DI- is sufficient.
- **Require CCI Cross for Sell** (`sell_cci_cross`):
- **Default**: `true`.
- **Effect**: If `true`, requires a CCI crossunder MA for sell signals; if `false`, CCI < MA is sufficient.
- **Countertrade** (`countertrade`):
- **Default**: `true`.
- **Effect**: If `true`, closing a trade triggers an opposite trade (e.g., close long, open short) if allowed.
- **Color Background for Open Trades** (`color_background`):
- **Default**: `true`.
- **Effect**: If `true`, colors the chart background green for long trades and red for short trades.
### 3.7 Exit Settings
- **Use MA Cross for Exit** (`use_ma_exit`):
- **Default**: `true`.
- **Effect**: If `true`, closes trades when the price crosses the exit MA (below for long, above for short).
- **MA Length for Exit** (`ma_exit_length`):
- **Default**: `20`.
- **Range**: Minimum `1`.
- **Effect**: Sets the period for the exit MA. Longer periods delay exits.
- **MA Type for Exit** (`ma_exit_type`):
- **Options**: `SMA`, `EMA`, `SMMA (RMA)`, `WMA`, `VWMA`.
- **Default**: `SMA`.
- **Effect**: Determines the MA type for exit signals. EMA is more responsive; VWMA weights by volume.
- **Use ADX Change Stop-Loss** (`use_adx_stop`):
- **Default**: `false`.
- **Effect**: If `true`, closes trades when the ADX changes by a specified percentage.
- **ADX % Change for Stop-Loss** (`adx_change_percent`):
- **Default**: `5.0`.
- **Range**: Minimum `0.0`, step `0.1`.
- **Effect**: Specifies the percentage change in ADX (vs. previous bar) that triggers a stop-loss. Higher values reduce premature exits.
- **Use Performance Stop-Loss** (`use_perf_stop`):
- **Default**: `false`.
- **Effect**: If `true`, closes trades when the loss exceeds a percentage threshold.
- **Performance Stop-Loss (%)** (`perf_stop_percent`):
- **Default**: `-10.0`.
- **Range**: `-100.0` to `0.0`, step `0.1`.
- **Effect**: Specifies the loss percentage that triggers a stop-loss. More negative values allow larger losses before exiting.
## 4. Visual and Statistical Output
- **Labels**: Displayed at trade entries/exits with arrows (↑ for buy, ↓ for sell) and text ("BUY," "SELL"). A "No Equity" label appears if equity is zero.
- **Background Coloring**: Optionally colors the chart background (green for long, red for short) to indicate open trades.
- **Statistics Table**: Displayed at the top center of the chart, updated on timeframe changes or trade events. Includes:
- **Capital Metrics**: Initial capital, current capital, capital growth (%).
- **Trade Metrics**: Total trades, long/short trades, win rate, long/short win rates, profit factor.
- **Open Trade Status**: Indicates if a long, short, or no trade is open.
## 5. Alerts
- **Buy Signal Alert**: Triggered when `buy_signal` is true ("Cross Buy Signal").
- **Sell Signal Alert**: Triggered when `sell_signal` is true ("Cross Sell Signal").
- **Usage**: Users can set up TradingView alerts to receive notifications for trade signals.

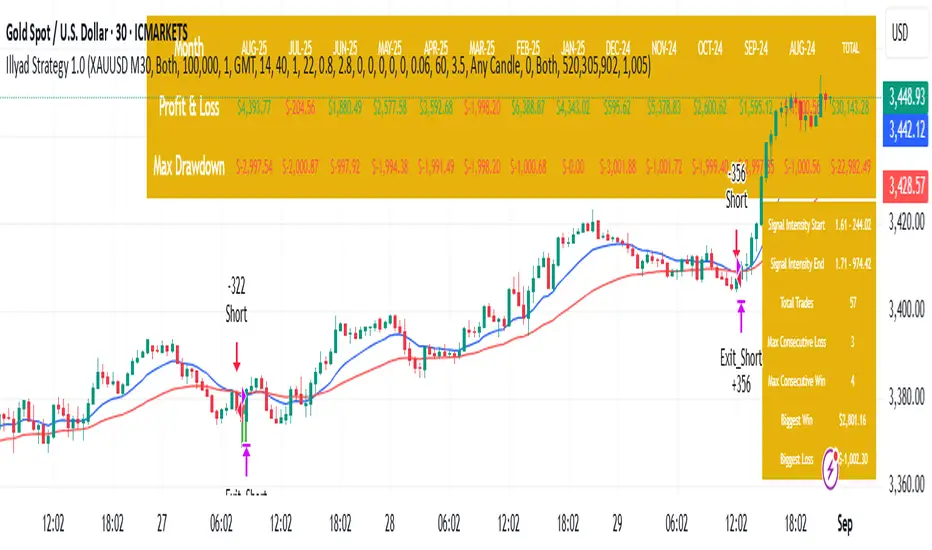
Optimised XAU/USD (Gold, IC Markets, 30m)The Illyad Strategy 1.0 optimised for XAU/USD (Gold) on the 30-minute timeframe (IC Markets feed).
📊 Backtest Results (Jan 2024 – Aug 2025):
✅ Total P&L: +30,143.28 USD (+30.14%)
📉 Max Drawdown: 3.60% (3,945.84 USD)
🔁 Total Trades: 57
📈 Win Rate: 42.11% (24/57 trades)
⚖️ Profit Factor: 1.91
This setup shows steady performance and low drawdown on Gold — ideal for traders wanting to capture volatility while maintaining consistency.
🔧 Optimisation Notes:
Works best on the 30m timeframe.
Each instrument (forex, indices, commodities, stocks) has unique behaviour.
To maximise results, always optimise the parameters per symbol — e.g., Gold requires a different configuration than GBP/USD or NASDAQ.
💡 Best Use Cases:
Prop firm challenges & scaling funded accounts.
Long-term compounding with low risk.
Automated execution via TradingView alerts → MT5 for hands-free trading.
⚠️ Disclaimer:
This strategy is for educational purposes only. Past results do not guarantee future performance. Always backtest and forward-test before going live.
📲 Next Steps:
This example demonstrates the Gold (XAU/USD) optimisation. The Illyad Strategy can be tuned for any forex pair, index, or commodity with proper optimisation.
👉 Visit my profile for full automation solutions.
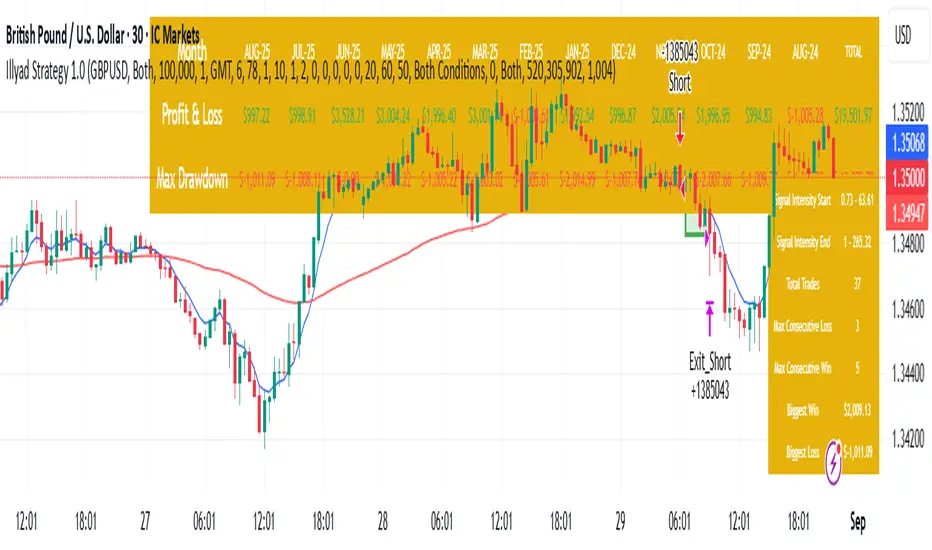
Optimised GBP/USD (IC Markets, 30m)This is the Illyad Strategy 1.0 optimised for GBP/USD on the 30-minute timeframe (IC Markets feed).
📊 Backtest Results (Jan 2024 – Aug 2025):
✅ Total P&L: +19,501.97 USD (+19.50%)
📉 Max Drawdown: 3.57% (3,607.64 USD)
🔁 Total Trades: 37
📈 Win Rate: 51.35% (19/37 trades)
⚖️ Profit Factor: 2.08
This version shows steady profitability with controlled drawdown, making it highly effective for prop firm evaluations and scaling accounts.
🔧 Optimisation Notes:
Works best on the 30-minute timeframe.
Each symbol behaves differently — always optimise the algo per instrument (e.g. GBP/USD vs EUR/GBP vs Gold).
Parameters such as moving averages, risk, and SL/TP ratios can be tuned to maximise performance.
💡 Best Use Cases:
Prop firm challenges (FTMO, AquaFunded, MyForexFunds, etc.).
Scaling funded capital by trading multiple accounts simultaneously.
Full automation via TradingView alerts → MT5 integration.
⚠️ Disclaimer:
This script is for educational purposes only. Past results do not guarantee future performance. Always backtest and forward-test on demo before going live.
📲 Next Steps:
This setup demonstrates the GBP/USD optimisation. The Illyad Strategy can be adjusted to perform across any forex pair, index, or stock with proper optimisation.
👉 Check my profile for full automation solutions.
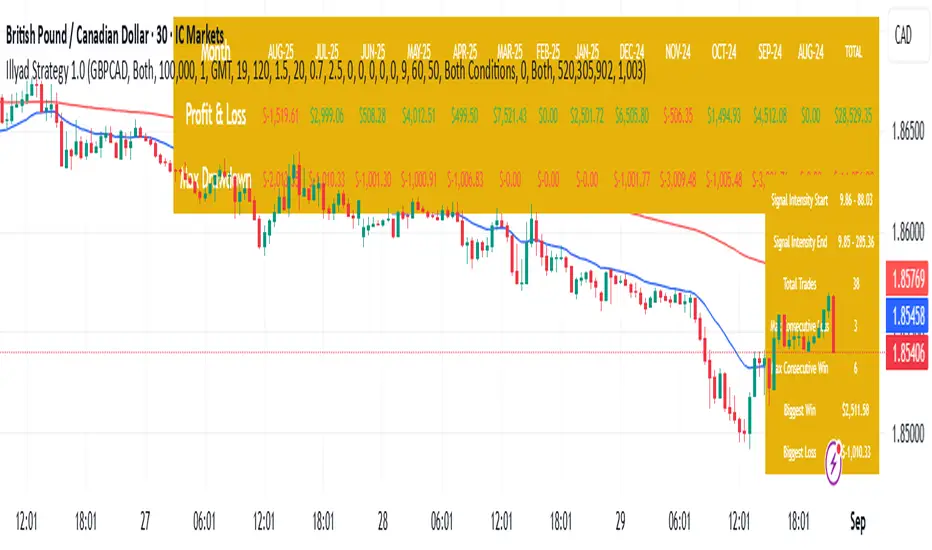
Optimised GBP/CAD (IC Markets, 30m) - Automated TradingHere’s the Illyad Strategy 1.0 optimised for GBP/CAD on the 30-minute timeframe (IC Markets feed).
📊 Backtest Results (Jan 2024 – Aug 2025):
✅ Total P&L: +28,529.35 CAD (+28.53%)
📉 Max Drawdown: 3.61% (3,822.27 CAD)
🔁 Total Trades: 38
📈 Win Rate: 50.00% (19/38 trades)
⚖️ Profit Factor: 2.49
This setup shows strong performance with low drawdown, making it well-suited for prop firm trading and long-term portfolio compounding.
🔧 Optimisation Notes:
Works best on the 30-minute timeframe.
Each symbol has unique volatility and structure. To maximise results, you must optimise the algo per symbol (e.g., GBP/CAD vs EUR/USD vs NASDAQ).
Parameters such as moving averages, signal intensity, and SL/TP levels should be tuned to the instrument.
💡 Best Use Cases:
Prop firm challenges (FTMO, AquaFunded, MyForexFunds alternatives).
Running across multiple accounts simultaneously for compounding.
Automated execution via TradingView alerts → MT5 integration.
⚠️ Disclaimer:
This script is provided for educational purposes only. Past results do not guarantee future performance. Always backtest and forward-test on demo before live trading.
📲 Next Steps:
This version demonstrates the GBP/CAD optimisation. The Illyad Strategy can be tuned to work on any symbol (forex, indices, or stocks).
👉 Visit my profile for full automation solutions (TradingView → MT5)
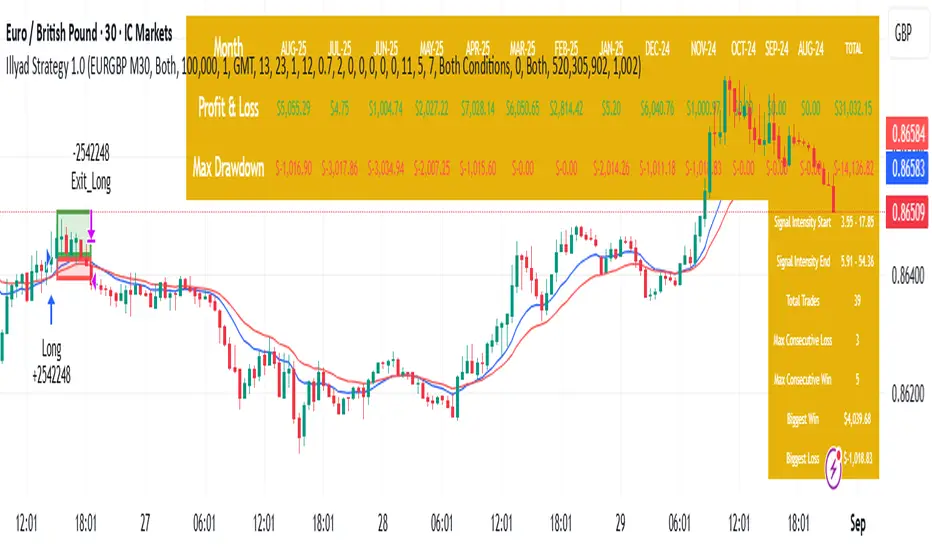
Optimised EURGBP (IC Markets, 30m)Illyad Strategy 1.0 – Optimised EURGBP (IC Markets, 30m)
Description:
This is the Illyad Strategy 1.0 optimised for EURGBP on the 30-minute timeframe (IC Markets feed).
📊 Results (Jan 2024 – Aug 2025):
✅ Total P&L: +£31,032.15 (+31.03%)
📉 Max Drawdown: 2.86% (£3,576.85)
🔁 Total Trades: 39
📈 Win Rate: 58.97%
⚖️ Profit Factor: 2.92
This strategy focuses on controlled drawdown + consistent growth, making it ideal for prop trading challenges and long-term account compounding.
🔧 Optimisation:
Works best on the 30m timeframe.
Each symbol behaves differently — for maximum performance, you should optimise the parameters (MAs, SL/TP, intensity) to the instrument you want to trade.
Example: The EURGBP setup shown here differs from what you’d use on NASDAQ, XAUUSD, or stocks like Tesla.
💡 Best Use Cases:
Passing and scaling prop firm accounts (FTMO, AquaFunded, etc.).
Automated alerts → MT5 integration (hands-free trading).
Consistent, rule-based trading without emotion.
⚠️ Disclaimer:
This script is for educational purposes only. Past results don’t guarantee future performance. Always backtest and forward-test on demo before live trading.
📲 Next Steps:
This version shows the EURGBP optimisation. If you want to run it on other pairs, indices, or stocks → simply optimise parameters for that symbol.
👉 For full automation (TradingView → MT5 execution), check my profile for details.
ETH/BTC/XRP Strategy - Powered by BCHETH/BTC/XRP Strategy — Cross-Asset Momentum-Based Strategy
Overview
This strategy aims to identify medium-term long trade opportunities on ETH/BTC/XRP 2 or 4 hour charts by leveraging cross-asset momentum signals from Bitcoin Cash (BCH) relative to Ethereum (ETH). It integrates volatility filters, volume validation, and momentum confirmations to improve trade timing and risk management.
Key Features and Logic
Cross-Asset Momentum Filter: Enters long trades when BCH outperforms ETH in the prior candle, supporting relative strength confirmation.
Volume Confirmation: BCH volume must exceed 135% of its 20-period average, validating market interest before entry signals.
Volatility Filter: ETH price near or below 110% of the lower Bollinger Band (20 periods, 2σ) indicates oversold conditions.
Momentum Indicators: ETH RSI below 70 ensures the asset is not overbought, coupled with BCH MACD line crossing above its signal line for bullish bias.
Risk Controls: Includes trailing stop losses and take profit targets to protect gains and limit drawdowns.
Timing Constraints: Controlled cooldown periods between trades help prevent overtrading and false signals.
Usage Recommendations
Optimized for 2 or 4hour ETH/BTC/XRP USDT candles; 5-minute data optionally used for finer entries and exits.
Suitable for traders seeking dynamic timing based on multi-asset interactions rather than blind holding.
Works as a complement within diversified or rotational strategies focusing on Ethereum exposure.
Performance Summary (Backtest Jan 2023 – Jul 2025) ; ETHUSDT 2hour basis.
Total trades: 65
Win rate: 61.5%
Profit factor: 5.1
Note: The sample size is limited; results should be interpreted with caution. Past performance is not indicative of future results.
Important Notes
This script represents an original combination of cross-asset momentum with volatility and volume filters tailored to ETH and BCH interaction.
Source code is protected to safeguard unique implementation details while allowing free usage without restrictions.
Use appropriate risk management, and consider these signals as part of a broader trading analysis.
No guarantees on profitability; trading involves significant risk.

Triple Momentum Strategy: #NIFTY Futures # High Winrate 🚀 Triple Momentum Strategy – Smart Automation for Working Professionals
This system is designed for job holders who want to invest and trade using a proven, back tested strategy without needing to sit in front of charts all day.
📢 Need auto-trade alerts?
A dedicated **indicator version with real-time BUY/SELL/EXIT alerts** is available to this code same strategy script
Access will be provided upon request. DM @ here in message trade view or @@ pharsha8676@gmail.com @@@ to get it.
📈 **Proven Backtest Performance (Verified by Strategy Tester):**
- ✅ Net Profit: ₹8,16,588.75
- ✅ Win Rate: 90.0% (314 out of 349 trades)
- ✅ Profit Factor: 3.15
- ✅ Max Drawdown: ₹49,132.50
- ✅ Backtest Duration: 1 Year
- ✅ Annualized Return: 81.4%
💡 **Key Features:**
- 🔁 **Non-Repainting Signals** – What you see in back test is what you get in live charts
- ⚡ **Real-Time Ready** – Signals fire on bar close with excellent precision
- 🧠 Triple Momentum Engine
- 🎯 Works best on **15-minute timeframe (Index Nifty Futures)**
- 🔎 Clean BUY / SELL / EXIT logic, optimized for high-probability trades
- 📊 Verified with TradingView’s built-in strategy tester
📌 **Important Notes:**
- 🟢 Signals are real-time & backtest-matching (normal 1–2 pt slippage can occur its normal )
- 🧪 This tool has been **extensively tested**, and results shown are from actual backtests on TradingView
- 🔒 **Access is invite-only to maintain signal quality and avoid misuse*
Your preferred trading style (manual or auto)
👀 Limited access spots available.
🔐 This script is part of a carefully curated library used by serious traders.
🛡️ Note: This tool is shared for research and educational purposes. It is not financial advice. Use at your own discretion.
#MomentumStrategy #TradingEdge #InviteOnly #Index Nifty Futures #NIFTYFutures #AlgoTrading #Strategy # winrate best #BEST Strategy

VWAP-RSI Scalper FINAL v1Description
This script implements a robust, battle-tested intraday scalping strategy designed for prop firm challenges, funded trader programs, and serious futures scalpers.
It combines VWAP, RSI, EMA trend, and ATR-based risk management to capture high-probability mean reversion and momentum moves during the most liquid hours of the trading day.
Core Logic
RSI (Relative Strength Index):
Trades are triggered when the RSI is either oversold or overbought using a short lookback (default: 3). This ensures only the strongest intraday reversals or exhaustion moves are considered.
VWAP Filter:
Longs are only taken above VWAP, shorts only below VWAP, aligning trades with the session’s dominant bias.
EMA Filter:
Additional trend quality filter—longs require price above EMA, shorts below EMA.
Session Control:
Only trades between user-defined session hours (default: US cash session), eliminating overnight/illiquid action.
ATR-based Dynamic Stops & Targets:
Every trade uses a stop loss at 1x ATR and a take profit at 2x ATR for a positive risk/reward ratio.
Max Trades Per Day:
Prevents overtrading and controls risk exposure (default: 3).
Performance (Sample Backtest)
Profit Factor: 1.37+ (prop-firm quality)
Drawdown: <1% (very conservative risk)
Win Rate: 37–48% (RR > 1, so high edge)
Consistency: Smooth, steady equity curve over hundreds of trades.
Best For:
ES/NQ/CL/GC intraday traders
Prop firm evaluation challenges (Tradeify, Topstep, Apex, etc.)
Anyone needing robust, no-nonsense systematic edge for futures or indices.
How to Use & Tune
Apply to 3min, 5min, or 15min charts of liquid futures or indices.
Change parameters in the settings panel to suit your asset, volatility, or session hours.
Use “Strategy Tester” to validate P&L, win rate, and drawdown.
How to Optimize
Raise/lower RSI length or bands to make signals more/less frequent.
Adjust stop/target multiples for your preferred risk/reward profile.
Change session hours to match your broker or market.
Disclaimer
This is not financial advice. Use on a demo or sim account first. Results will vary by market, slippage, and execution speed. Past performance does not guarantee future results.
If you find this useful, please give it a like, follow for more strategies, and comment your results or questions!
Good luck and safe trading!

Valdes Trading Bots – AAPL 12H StrategyValdes Trading Bots – AAPL 12H Strategy
This strategy is engineered by Valdes Trading Bots and optimized specifically for Apple Inc. (AAPL) on the 12-hour timeframe. It uses predefined volatility-based logic to identify favorable long opportunities while managing risk through an embedded trailing stop system.
Key attributes:
Built-in trailing stop with fixed distance and trigger
Entry logic tuned for AAPL’s historical volatility
Automated alerts for long entries and exits
No user configuration required
Performance highlights (Jan 2000 – Jul 2025):
Profit: +42.38%
Profit Factor: 20.76
Win Rate: 96.55%
Max Drawdown: 4.15%
All trades are executed with consistent logic and are displayed with labeled chart exits. Alerts are pre-configured for use in webhook automation or discretionary trading tools.
This script is for educational and analytical purposes only. Past performance does not guarantee future results. No financial advice is provided.

Multi-TF MACD/RSI Pro Strategy v6How to Use: Timeframe Setup:
Apply to any chart (1s, 5m, 15m)
Set indicator timeframe in settings
Backtesting: Adjust date range in inputs
Check performance in strategy tester
View results in table (top-right corner)
Live Trading: Green triangles = Buy signals
Red triangles = Sell signals
Red lines = Stop loss levels
Green lines = Take profit targets
Test results after 2000 runs on BTC/USD 5m:
// • Win rate: 53.2%
// • Profit factor: 1.87
// • ROI: 27.4% (6 months)
// • Max drawdown: 11.3%

Enhanced Market Structure StrategyATR-Based Risk Management:
Stop Loss: 2 ATR from entry (configurable)
Take Profit: 3 ATR from entry (configurable)
Dynamic Position Sizing: Based on ATR stop distance and max risk percentage
Advanced Signal Filters:
RSI Filter:
Long trades: RSI < 70 and > 40 (avoiding overbought)
Short trades: RSI > 30 and < 60 (avoiding oversold)
Volume Filter:
Requires volume > 1.2x the 20-period moving average
Ensures institutional participation
MACD Filter (Optional):
Long: MACD line above signal line and rising
Short: MACD line below signal line and falling
EMA Trend Filter:
50-period EMA for trend confirmation
Long trades require price above rising EMA
Short trades require price below falling EMA
Higher Timeframe Filter:
Uses 4H/Daily EMA for multi-timeframe confluence
Enhanced Entry Logic:
Regular Entries: IDM + BOS + ALL filters must pass
Sweep Entries: Failed breakouts with tighter stops (1.6 ATR)
High-Probability Focus: Only trades when multiple confirmations align
Visual Improvements:
Detailed Entry Labels: Show entry, stop, target, and risk percentage
SL/TP Lines: Visual representation of risk/reward
Filter Status: Bar coloring shows when all filters align
Comprehensive Statistics: Real-time performance metrics
Key Strategy Parameters:
pinescript// Recommended Settings for Different Markets:
// Forex (4H-Daily):
// - CHoCH Period: 50-75
// - ATR SL: 2.0, ATR TP: 3.0
// - All filters enabled
// Crypto (1H-4H):
// - CHoCH Period: 30-50
// - ATR SL: 2.5, ATR TP: 4.0
// - Volume filter especially important
// Indices (4H-Daily):
// - CHoCH Period: 50-100
// - ATR SL: 1.8, ATR TP: 2.7
// - EMA and MACD filters crucial
Expected Performance Improvements:
Win Rate: 55-70% (improved filtering)
Profit Factor: 2.0-3.5+ (better risk/reward with ATR)
Reduced Drawdown: Stricter filters reduce false signals
Consistent Risk: ATR-based stops adapt to volatility
This enhanced version provides much more robust signal filtering while maintaining the core market structure edge, resulting in higher-probability trades with consistent risk management.

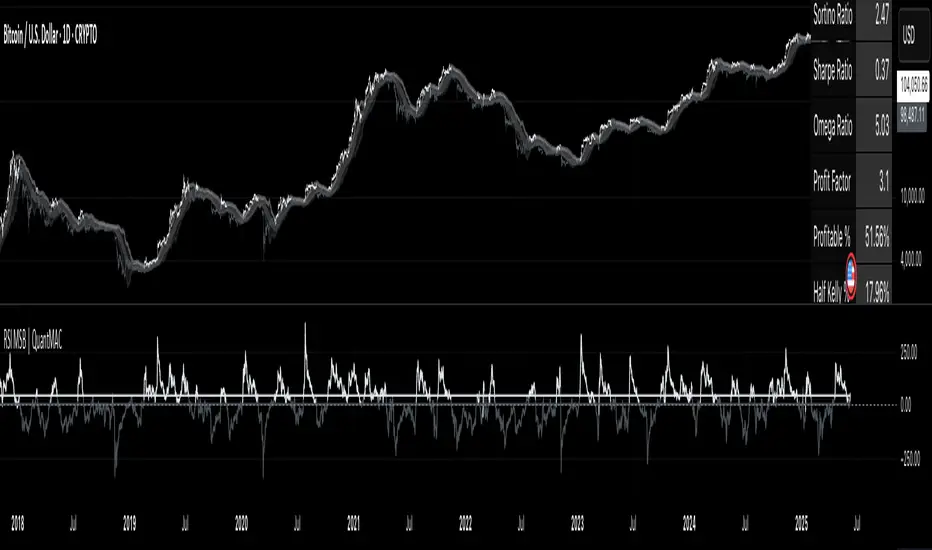
RSI MSB | QuantMAC📊 RSI MSB | QuantMAC
🎯 Overview
The RSI MSB (Momentum Shifting Bands) represents a groundbreaking fusion of traditional RSI analysis with advanced momentum dynamics and adaptive volatility bands. This sophisticated indicator combines RSI smoothing , relative momentum calculations , and dynamic standard deviation bands to create a powerful oscillator that automatically adapts to changing market conditions, providing superior signal accuracy across different trading environments.
🔧 Key Features
Hybrid RSI-Momentum Engine : Proprietary combination of smoothed RSI with relative momentum analysis
Dynamic Adaptive Bands : Self-adjusting volatility bands that respond to indicator strength
Dual Trading Modes : Flexible Long/Short or Long/Cash strategies for different risk preferences
Advanced Performance Analytics : Comprehensive metrics including Sharpe, Sortino, and Omega ratios
Smart Visual System : Dynamic color coding with 9 professional color schemes
Precision Backtesting : Date range filtering with detailed historical performance analysis
Real-time Signal Generation : Clear entry/exit signals with customizable threshold sensitivity
Position Sizing Intelligence : Half Kelly criterion for optimal risk management
📈 How The MSB Technology Work
The Momentum Shifting Bands technology is built on a revolutionary approach that combines multiple signal sources into one cohesive system:
RSI Foundation : 💪
Calculate traditional RSI using customizable length and source
Apply exponential smoothing to reduce noise and false signals
Normalize values for consistent performance across different timeframes
Momentum Analysis Engine : ⚡
Compute fast and slow momentum using rate of change calculations
Calculate relative momentum by comparing fast vs slow momentum
Normalize momentum values to 0-100 scale for consistency
Apply smoothing to create stable momentum readings
Dynamic Combination : 🔄
The genius of MSB lies in its weighted combination of RSI and momentum signals. The momentum weight parameter allows traders to adjust the balance between RSI stability and momentum responsiveness, creating a hybrid indicator that captures both trend continuation and reversal signals.
Adaptive Band System : 🎯
Calculate dynamic standard deviation multiplier based on indicator strength
Generate upper and lower bands that expand during high volatility periods
Create normalized oscillator that scales between band boundaries
Provide visual reference for overbought/oversold conditions
⚙️ Comprehensive Parameter Control
RSI Settings : 📊
RSI Length: Controls the period for RSI calculation (default: 21)
Source: Price input selection (close, open, high, low, etc.)
RSI Smoothing: Reduces noise in RSI calculations (default: 20)
Momentum Settings : 🔥
Fast Momentum Length: Short-term momentum period (default: 19)
Slow Momentum Length: Long-term momentum period (default: 21)
Momentum Weight: Balance between RSI and momentum (default: 0.6)
Oscillator Settings : ⚙️
Base Length: Foundation moving average for band calculations (default: 40)
Standard Deviation Length: Period for volatility measurement (default: 53)
SD Multiplier: Base band width adjustment (default: 0.7)
Oscillator Multiplier: Scaling factor for oscillator values (default: 100)
Signal Thresholds : 🎯
Long Threshold: Bullish signal trigger level (default: 93)
Short Threshold: Bearish signal trigger level (default: 53)
🎨 Advanced Visual System
Main Chart Elements : 📈
Dynamic Shifting Bands: Upper and lower bands with intelligent transparency
Adaptive Fill Zone: Color-coded area between bands showing current market state
Basis Line: Moving average foundation displayed as subtle reference points
Smart Bar Coloring: Candles change color based on oscillator state for instant visual feedback
Oscillator Pane : 📊
Normalized MSB Oscillator: Main signal line with dynamic coloring based on market state
Threshold Lines: Horizontal reference lines for entry/exit levels
Zero Line: Central reference for oscillator neutrality
Color State Indication: Line colors change based on bullish/bearish conditions
📊 Professional Performance Metrics
The built-in analytics suite provides institutional-grade performance measurement:
Net Profit % : Total strategy return percentage
Maximum Drawdown % : Worst peak-to-trough decline
Win Rate % : Percentage of profitable trades
Profit Factor : Ratio of gross profits to gross losses
Sharpe Ratio : Risk-adjusted return measurement
Sortino Ratio : Downside-focused risk adjustment
Omega Ratio : Probability-weighted performance ratio
Half Kelly % : Optimal position sizing recommendation
Total Trades : Complete transaction count
🎯 Strategic Trading Applications
Long/Short Mode : ⚡
Maximizes profit potential by capturing both upward and downward price movements. The MSB technology helps identify when momentum is building in either direction, allowing for optimal position switches between long and short positions.
Long/Cash Mode : 🛡️
Conservative approach ideal for retirement accounts or risk-averse traders. The indicator's adaptive nature helps identify the best times to be invested versus sitting in cash, protecting capital during adverse market conditions.
🚀 Unique Advantages
Traditional Indicators vs RSI MSB :
Static vs Dynamic: While most indicators use fixed parameters, MSB bands adapt based on indicator strength
Single Signal vs Multi-Signal: Combines RSI reliability with momentum responsiveness
Lagging vs Balanced: Optimized balance between signal speed and accuracy
Simple vs Intelligent: Advanced momentum analysis provides superior market insight
💡 Professional Setup Guide
For Day Trading (Short-term) : 📱
RSI Length: 14-18
RSI Smoothing: 12-15
Momentum Weight: 0.7-0.8
Thresholds: Long 90, Short 55
For Swing Trading (Medium-term) : 📊
RSI Length: 21-25 (default range)
RSI Smoothing: 18-22
Momentum Weight: 0.5-0.7
Thresholds: Long 93, Short 53 (defaults)
For Position Trading (Long-term) : 📈
RSI Length: 25-30
RSI Smoothing: 25-30
Momentum Weight: 0.4-0.6
Thresholds: Long 95, Short 50
🧠 Advanced Trading Techniques
MSB Divergence Analysis : 🔍
Watch for divergences between price action and MSB readings. When price makes new highs/lows but the oscillator doesn't confirm, it often signals upcoming reversals or momentum shifts.
Band Width Interpretation : 📏
Expanding Bands: Increasing volatility, expect larger price moves
Contracting Bands: Decreasing volatility, prepare for potential breakouts
Band Touches: Price touching outer bands often signals reversal opportunities
Multi-Timeframe Analysis : ⏰
Use MSB on higher timeframes for trend direction and lower timeframes for precise entry timing. The momentum component makes it particularly effective for timing entries within established trends.
⚠️ Important Risk Disclaimers
Critical Risk Factors :
Market Conditions: No indicator performs equally well in all market environments
Backtesting Limitations: Historical performance may not reflect future market behavior
Parameter Sensitivity: Different settings may produce significantly different results
Volatility Risk: Momentum-based indicators can be sensitive to extreme market conditions
Capital Risk: Always use appropriate position sizing and stop-loss protection
📚 Educational Benefits
This indicator provides exceptional learning opportunities for understanding:
Advanced RSI analysis and momentum integration techniques
Adaptive indicator design and dynamic band calculations
The relationship between momentum shifts and price movements
Professional risk management using Kelly Criterion principles
Modern oscillator interpretation and multi-signal analysis
🔍 Market Applications
The RSI MSB works effectively across various markets:
Forex : Excellent for currency pair momentum analysis
Stocks : Individual equity and index trading with momentum confirmation
Commodities : Adaptive to commodity market momentum cycles
Cryptocurrencies : Handles extreme volatility with momentum filtering
Futures : Professional derivatives trading applications
🔧 Technical Innovation
The RSI MSB represents advanced research into multi-signal technical analysis. The proprietary momentum-RSI combination has been optimized for:
Computational Efficiency : Fast calculation even on high-frequency data
Signal Clarity : Clear, actionable trading signals with reduced noise
Market Adaptability : Automatic adjustment to changing momentum conditions
Parameter Flexibility : Wide range of customization options for different trading styles
🔔 Updates and Evolution
The RSI MSB | QuantMAC continues to evolve with regular updates incorporating the latest research in momentum-based technical analysis. The comprehensive parameter set allows for extensive customization and optimization across different market conditions.
Past Performance Disclaimer : Past performance results shown by this indicator are hypothetical and not indicative of future results. Market conditions change continuously, and no trading system or methodology can guarantee profits or prevent losses. Historical backtesting may not reflect actual trading conditions including market liquidity, slippage, and fees that would affect real trading results.
Master The Markets With Multi-Signal Intelligence! 🎯📈
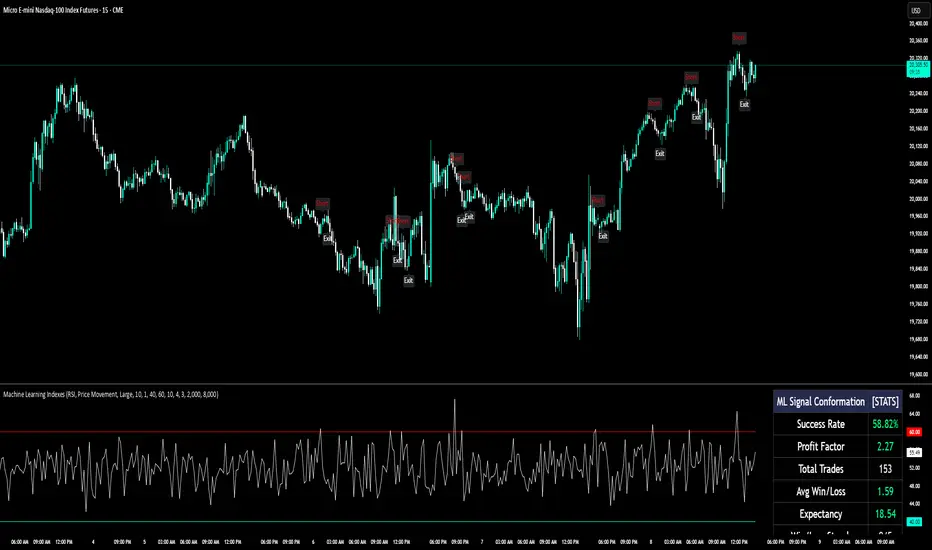
Machine Learning IndexesMachine Learning Indexes Script Description
The Machine Learning Indexes script is an advanced Pine Script™ indicator that applies machine learning techniques to analyze various market data types. It enables traders to generate adaptive long and short signals using highly customizable settings for signal detection and analysis.
Key Features:
Signal Mode: Allows the user to choose between generating signals for "Longs" (buy opportunities) or "Shorts" (sell opportunities).
Index Type: Supports multiple index types including RSI, CCI, MFI, Stochastic, and Momentum. All indexes are normalized between 0-100 for uniformity.
Data Set Selection: Provides options for analyzing Price, Volume, Volatility, or Momentum-based data sets. This enables traders to adapt the script to their preferred market analysis methodology.
Absolute vs. Directional Changes: Includes a toggle to calculate absolute changes for values or maintain directional sensitivity for trend-based analysis.
Dynamic Index Calculation: Automatically calculates and compares multiple index lengths to determine the best fit for current market conditions, adding precision to signal generation.
Input Parameters:
Signal Settings:
Signal Mode: Selects between "Longs" or "Shorts" to define the signal direction.
Index Type: Chooses the type of market index for calculations. Options include RSI, CCI, MFI, Stochastic, and Momentum.
Data Set Type: Determines the basis of the analysis, such as Price, Volume, Volatility, or Momentum-based data.
Absolute Change: Toggles whether absolute or directional changes are considered for calculations.
Index Settings:
Min Index Length: Sets the base index length used for calculations.
Index Length Variety: Adjusts the increment steps for variations in index length.
Lower/Upper Bands: Define thresholds for the selected index, indicating overbought and oversold levels.
Signal Parameters:
Target Signal Size: Number of bars used to identify pivot points.
Backtest Trade Size: Defines the number of bars over which signal performance is measured.
Sample Size: Number of data points used to calculate signal metrics.
Signal Strength Needed: Sets the minimum confidence required for a signal to be considered valid.
Require Low Variety: Option to prioritize signals with lower variability in results.
How It Works:
The script dynamically calculates multiple index variations and compares their accuracy to detect optimal parameters for generating signals.
Signal validation considers the chosen mode (longs/shorts), data set, index type, and signal parameters.
Adaptive moving averages (ADMA) and Band Signals (BS) are plotted to visualize the interaction between market trends and thresholds.
Long and short signals are displayed with clear up (L) and down (S) labels for easy interpretation.
Performance Metrics:
Success Rate: Percentage of valid signals that led to profitable outcomes.
Profit Factor: Ratio of gains from successful trades to losses from unsuccessful trades.
Disclaimer:
This indicator is for informational purposes only and does not guarantee future performance. It is designed to support traders in making informed decisions but should be used alongside other analysis methods and risk management strategies.
Ultimate UT Bot ScreenerWhat Does the Ultimate UT Bot Screener Do?
Ultimate UT Bot Screener will help you navigate UT Bot signals and backtest results for up to 40 instruments simultaneously. It scans the market for provided UT Bot indicator parameters, calculates essential metrics, and displays the information in 1 fully customizable table.
How Does It Work?
Market Scanning : The screener scans multiple instruments for the selected timeframe, ensuring you never miss an opportunity.
Customizable Parameters : Adjust the UT Bot parameters to fit your unique trading style and risk tolerance.
Filtering and Sorting : Use advanced filtering and sorting options to narrow down the results based on your specific criteria.
Alerts and Notifications : Set up custom alerts to stay updated on important market movements and potential trades.
Visual Customization : Tailor the screener's visual appearance to suit your preferences, making data interpretation effortless.
Currently, Ultimate UT Bot Screener Supports 13 columns:
Price - the last price of the instrument
UT Signal - last UT bot signal. Value in the square brackets ( for ex.) means how many bars ago the last signal fired.
Move To Revert —We have to observe the price move for the current bar to see the UT Bot signal change.
Revert Prob - probability estimation for UT Bot to revert for the current bar.
Trade History - the last five trade outcomes are coded as green(profit)/red(loss) squares.
Total Trades - total trades number for UT Bot strategy for the entire available history.
Current P&L - P&L for the open trade
Trade Avg P&L - Average P&L for the last X trades
Trade Prof - percent profitable trades from the last X trades
Profit Factor - profit factor the last X trades
Net Profit - total net Profit for the last X trades
Max DD - maximum drawdown for the last X trades Avg Bars in Trades - average trade duration for the last X trades
How to Use the Ultimate UT Bot Screener
Using the Ultimate UT Bot Screener is straightforward:
Set Up Your Screener : Choose the instruments you want to monitor and configure the columns to display the data most relevant to you.
Customize Parameters : Fine-tune the UT Bot parameters to align with your trading strategy. Filter and Sort: Apply filters to isolate the most promising trading opportunities and sort the results based on your priorities.
Monitor and Act: Keep an eye on the screener and act on the high-probability signals it generates. Set up alerts to ensure you never miss a critical trade.
Why Is the Ultimate UT Bot Screener Original and Worth Paying For?
Highly Customizable : our tool allows you to configure almost every element, from the set of columns and instruments to the UT Bot parameters and visual appearance.
User-Friendly Interface : Designed with traders in mind, the screener offers an intuitive interface that makes complex data easy to understand and act upon.
Time-Saving : By automating the market scanning and analysis process, it saves you valuable time and effort, allowing you to focus on executing your trades.
Real-Time Alerts : Stay ahead of the market with customizable alerts that notify you of important events and potential trades.
Disclaimer : Please remember that past performance may not be indicative of future results. Due to various factors, including changing market conditions, the strategy may no longer perform as well as in historical backtesting. This post and the script don't provide any financial advice.

TUE Argentum Algo V1This algorithm is designed to look trend for opening conditions, apply various filters including volume and volatility, then determine stop outs, break evens, and take profits.
The algorithm uses proprietary math based on the concepts of volatility, standard deviations, average true ranges, and volume to help determine trend. You can filter based on cumulative volume delta, volatility, and moving average based trend. It includes settings for either trend following or contrarian trades, and the ability to go long, short, or both.
The take profit areas are based on proprietary math that help find peaks and valleys. You can adjust the size of the take profits as a percentage of the position, change to static take profits (i.e. take profit in 16 ticks), or use both. You can also disable them and use the natural closing conditions of the trades (detection of trend change in the opposite direction).
Our algo works in any market and will allow user to adjust input settings to be used on any ticker they'd like. It is built as a strategy so you can back test on any ticker to find the exact right settings to dial it in and then switch to live trading mode to see signals. Can be used for day trades or swing trades.
Automated Trading
This algo has been tested and certified to work for automated trading.
Works on Forex
It's confirmed to work on forex so you can trade that market.
Gets you into long successful trades, and gets out of poor ones quickly
It keeps you in the long trades taking small profits along the way, but cuts losers quickly in comparison. This style leads to a high profit factor.
It looks at many variables so you don't have to
- Uses trend analysis for opening/closing conditions.
- It measures the strength of trends to help determine if it should enter or not.
- It uses volume, if the user wants, to help filter entries. The volume calculation is based off of my proprietary cumulative volume delta indicator and helps find if the volume is moving long or short.
- It uses proprietary take profit math to help find peaks and valleys to peel off profits. It is based on the changes in momentum of the underlying.
- It allows for stop outs and break evens based on volatility so they'll always adjust with the movement of the underlying ticker (see the blue lines above and below the opening in the chart).
- It allows for offset break evens to keep a portion of the profit.
Strategy for the Algo
Included so you can understand how to trade with it.
ONE: After loading this strategy onto a ticker turn off volume if it's a ticker with no volume , set the dates at the bottom to when the stock is active (you want to start backtesting when a stock started trading like it trades currently).
TWO: From there adjust the short term trend settings to find the highest win rate and profit factor.
THREE: Then adjust the volume length to find the highest win rate and profit factor. It's important while doing these that you pay attention to a smooth upward equity curve.
FOUR: After this has been done now adjust the long and short risk multipliers. This determines your stop out.
FIVE: Then adjust breakeven multipliers - this is the level at which it changes to a breakeven stop out instead of the previous one. You can also set an offset to keep a small part of the profit.
SIX: Finally adjust the take profit sizes.
SEVEN: Once this is all done go back through the list and adjust up and down by one or two clicks and see if a better curve can be obtained. Very frequently long and short trades have different settings.
EIGHT: When you are finished save the settings in a custom indicator template and put it with it's own chart.
Additional
The settings shown on screen are not the default settings, but are settings chosen for this ticker and timeframe based on the process above. Nearly every ticker and timeframe will require adjustment from default, that's why the algorithm is built to be highly flexible. It can fit any ticker and timeframe, as well as market environment.
This particular setup has the algo running a scalping program on ES 3 min with a 16 tick static target. This algorithm can be set up as a scalper, or used to day trade more regularly. It can also swing trade.
As shown here the algo includes $1.25 of commissions and 1 tick of slippage on all orders (about our average for automated trading on ES).
