Open Interest Ribbon Trend [Orderflowing]Open Interest Data Aggregation | Multiple Exchange Sources | Open Interest Delta & Relative Volume | Ribbon Trend Analysis & Forecasting
Built using Pine Script V5.
Introduction
The Open Interest Ribbon Trend Indicator is designed to offer traders analysis of Open Interest across multiple exchanges, merging volume-based analysis with Ribbon Trend. Practically Integrating Open Interest data with customizable trend detection.
This Indicator pulls Open Interest data from major cryptocurrency exchanges Binance, Bybit, BitMEX, Kraken, and Bitfinex, combining these sources into a aggregated format. With Ribbon Trend logic, the tool can potentially help identify trend shifts in the open interest data.
Use of Open-Source Code
Specific parts of this Indicator's code have been inspired by & further developed from publicly available code originally developed for the MetaTrader platform.
All such integrations have been wired to work within the TradingView environment, specifically using Pine Script Version 5.
Elements have been made to benefit the overall functionality, the code logic, to make sure it offers unique value to TradingView's users.
Innovation and Inspiration
This Indicator builds on Open Interest analysis by integrating the Ribbon Trend component. It is inspired by the potential need for traders to aggregate volume data with trend-following methods to see potential direction, strength, and reversals. It combines Open Interest Delta with relative volume analysis.
How To Use Open Interest - Cheat Sheet
The Open Interest Cheat Sheet outlines four primary scenarios based on the relationship between Price Action and Open Interest.
Bullish Market
Price Up + Open Interest Up
This indicates that long positions are being opened, signaling a strong market.
The uptrend is likely to continue as traders increase their positions in the direction of the price movement.
A strong market where the uptrend should persist.
Neutral Bullish (Long Squeeze)
Price Down + Open Interest Down
Positions are being closed, particularly long positions, which are being squeezed out of the market.
This suggests a neutral or slightly bullish outlook as the downtrend weakens.
The market is neutral or slightly bullish, with a potential weakening of the downtrend.
Neutral Bearish (Short Squeeze)
Price Up + Open Interest Down
Short positions are being closed, indicating a short squeeze.
While price is increasing, the decrease in OI reflects weakening momentum.
The uptrend could be losing strength.
Neutral to slightly bearish, as the uptrend may be weakening.
Bearish Market
Price Down + Open Interest Up
Short positions are being opened, indicating a weak market.
The downtrend is likely to continue as traders open new positions betting on further price declines.
A weak market where the downtrend is expected to continue.
OI Going Up usually means traders are opening new positions in the direction of price action.
OI Going Down often indicates positions are being closed, which could signal a potential price reversal.
Core Features
Multi-Exchange Open Interest Data
Aggregates Open Interest from multiple exchanges
Open Interest Delta & Relative Volume
Example
1st Oscillation: Open Interest Delta & 2nd Oscillation Relative Volume
Includes options to display Open Interest Delta alongside Relative Volume, allowing traders to monitor market participation and volume pressure.
Ribbon Trend Analysis
Uses customizable MAs to create a Ribbon Trend visualization. The goal is to visualize trends in the aggregated Open Interest data.
High Market Activity Visuals
Option to highlight relatively significant increases or decreases in the Open Interest, color-coded for identification.
Forecasting Feature
Includes Ribbon Trend's forecasting feature that projects future trends based on current market conditions, providing a forward-looking view of potential market movements.
Application
Open Interest Aggregation
The Indicator pulls Open Interest data from cryptocurrency exchanges: Binance, Bybit, BitMEX, Kraken, and Bitfinex, aggregating this information to offer a view of volume participation.
Ribbon Trend Logic
The Ribbon Trend visually tracks direction, with customizable smoothing options. This feature allows traders to detect potential trend shifts and market momentum.
Delta & Relative Volume Analysis
By visualizing the Open Interest Delta alongside relative volume, traders can identify moments of intense buying or selling pressure, giving potential clues on how market participants are positioned.
High-Volume Visuals
Traders can receive visual cues for significant changes in Open Interest, potentially helping to spot large market movements before they happen.
Customization
Moving Average Types. Select from EMA, DEMA, HMA, Laguerre, and others for Ribbon Trend logic.
Color Customization. Set different colors for uptrends and downtrends, making it easier to follow the Ribbon Trend.
Thresholds & Alerts. Customize the thresholds for significant Open Interest changes to suit your trading style.
Conclusion
The Open Interest Ribbon Trend Indicator is a tool for traders looking to integrate Open Interest data with trend analysis. Its multi-exchange aggregation and integrated trend logic offers a different perspective, providing visuals potentially useful for trend following, market reversals, and volume-based trading strategies.
Disclaimer
While the Indicator is a tool to analyzing trends in open interest & volume, traders should not solely rely on it for trading decisions. As with all trading tools, it should be used as part of a complete trading strategy.
Note that the is independent from the script. This Indicator focuses specifically on analyzing Open Interest and volume trends.
Search in scripts for "relative volume"

BX-Volume Trend and OscillatorBX-Volume Trend and Oscillator (VTO)
This is my second indicator. I created this indicator for myself. I was inspired by the indicators created by Bjorgum, Duyck and QuantTherapy and decided to create multiple indicators that either work well combined with their indicators or something new that applies some of their indicator concepts. I decided to share this because I believe in learning and earing together as a community. I will later share the rest of the indicators I have created. If you guys have any questions or suggestions write them.
The BX-Volume Trend and Oscillator (VTO) is a comprehensive trading indicator designed to help traders identify trends, momentum shifts, and potential reversals by analyzing volume and price action through various metrics. This indicator combines relative volume analysis with custom Xtrender oscillators and moving averages to provide valuable insights into market behavior.
Image: BX-Volume Trend and Oscillator (VTO)
Features:
Relative Volume Analysis: Measures the current volume relative to the average volume over a specified period, helping traders understand if the current trading activity is unusually high or low.
Short-Term Xtrender Oscillator: This oscillator analyzes the difference between two short-term Exponential Moving Averages (EMAs) and smooths it with a custom RSI, highlighting short-term trends and potential reversal points.
Long-Term Xtrender Oscillator: Similar to the short-term oscillator but uses longer-term EMAs and RSI for identifying more sustained trends and shifts.
T3 Moving Average: A smoothed version of the Xtrender oscillator that helps in detecting trend changes more clearly.
Volume Trend Plot: Shows the smoothed relative volume to understand how trading activity aligns with the trend.
Visual Indicators: Uses colors and shapes to highlight significant changes and trends, such as circles to mark potential reversal points.
How to Use the Indicator
Analyze Relative Volume:
Relative Volume Plot: The smoothed relative volume is displayed in white, helping you assess if current trading volumes are above or below the historical average.
High Relative Volume: Indicates strong trading interest, which could support or contradict the prevailing trend.
Image above: is set to daily timeframe
Monitor Short-Term Xtrender Oscillator
Short-Term Xtrender: Plotted as a column histogram with colors changing from green to red based on the oscillator's movement and momentum. Green and lime colors indicate bullish trends, while maroon and red suggest bearish conditions.
Smoothed Short-Term Xtrender (T3): Plotted as a line that adjusts color based on the short-term Xtrender's trend. The line changes color to match the histogram's color, providing a clearer view of momentum shifts.
Reversal Markers: Small circles indicate potential short-term trend reversals, where changes in the T3 moving average suggest shifts in momentum.
Assess Long-Term Xtrender Oscillator:
Long-Term Xtrender: Plotted as a histogram, with color changes similar to the short-term Xtrender. It shows longer-term trends and shifts.
Color Indicators: Lime and green colors suggest an uptrend, while red and maroon indicate a downtrend.
Look for Zero Line Crossings:
The zero line serves as a reference point. Crossings above the zero line may indicate bullish trends, while crossings below may signal bearish trends.
Image above: is set to daily timeframe, and it showcases the Short-Term Xtrender (T3) applied.
Image above: is set to 8hr timeframe: Using the lower timeframe you can spot better details of pullbacks and potential reversals.
Example of Use:
Identify Trend and Momentum: Use the combination of the short-term and long-term Xtrender oscillators to gauge the prevailing market trend. For instance, if both oscillators are above zero and showing upward momentum, it suggests a strong bullish trend.
Spot Reversals: Observe the short-term Xtrender and its smoothed T3 version. If the T3 line changes direction and crosses through previous peaks and troughs, it could signal a potential reversal.
Volume Confirmation: Check the relative volume and its smoothed version to confirm the strength of price movements. Significant changes in volume can validate the trends indicated by the Xtrender oscillators.
By combining these elements, the BX-Volume Trend and Oscillator (VTO) provides a holistic view of market dynamics, helping traders make more informed decisions based on trend strength, potential reversals, and volume activity.
Lastly, my Scripts/Indicators/Ideas /Systems that I share are only for educational purposes!

Volatility Volume IndicatorIntroducing the Volatility Volume Indicator (𝓥𝓥𝓘) , a sophisticated tool designed to provide traders and investors with deeper insights into market dynamics by analyzing the interplay between price movements and trading volume. This indicator, built with the latest Pine Script version 5, leverages advanced calculations to deliver a clear, visual representation of market volatility and volume trends. Whether you are a day trader looking for intraday opportunities or a long-term investor seeking to understand market behavior, the 𝓥𝓥𝓘 is an invaluable addition to your trading arsenal.
Explanation of the Logic
The Volatility Volume Indicator (𝓥𝓥𝓘) is constructed on a foundation of key market metrics: high, low, open, and close prices, along with volume data. It begins by breaking down each price bar into its upper, lower, and body components, which are then used to calculate the proportional contributions of these segments to the overall price movement. This analysis allows the indicator to distinguish between different types of price action, whether bullish or bearish.
Volume normalization is a crucial aspect of the 𝓥𝓥𝓘, where the current volume is compared against its exponential moving average to gauge relative volume strength. This normalized volume is then used to compute bullish and bearish volumes separately, providing a granular view of market sentiment. These volumes are smoothed over a specified period to reduce noise and highlight significant trends.
The volatility component of the 𝓥𝓥𝓘 is integrated by analyzing the relationship between price range and volume. The indicator calculates the range of each price bar (the difference between the high and low) and breaks it down into upper and lower segments relative to the open and close prices. By examining how much of the total price movement is due to the body of the candlestick versus the wicks, the 𝓥𝓥𝓘 can determine periods of high and low volatility. When combined with volume data, this approach provides a comprehensive view of how volatile price movements are supported or contradicted by trading volume.
The final output is a visual plot that color-codes the combined volume difference, offering clear signals based on the balance between bullish and bearish pressures. The bar coloring adds another layer of interpretation:
Bright Blue: Indicates strong volume and volatility to the upside, signaling robust bullish activity.
Dark Blue: Indicates weak volume and volatility to the upside, suggesting less intense bullish movements.
Dark Red: Indicates weak volume and volatility to the downside, pointing to subdued bearish activity.
Bright Red: Indicates strong volume and volatility to the downside, highlighting significant bearish pressure.
Use Cases for This Indicator in Trading and Investing
The 𝓥𝓥𝓘 is versatile and can be applied in various trading and investing scenarios. Day traders can use it to identify periods of high volatility and volume, which are often associated with potential breakout or breakdown points. By understanding the underlying volume dynamics, traders can make more informed decisions about entry and exit points, improving their chances of capturing significant price moves.
For swing traders and long-term investors, the 𝓥𝓥𝓘 helps in spotting sustained trends and potential reversals. By analyzing the cumulative bullish and bearish volumes, investors can better gauge market sentiment and the strength of ongoing trends. This can aid in confirming the viability of trend-following strategies or in identifying overbought or oversold conditions, thus enhancing risk management and strategic planning.
Main flaw :
Why Do I Keep It Closed Source
The decision to keep the Volatility Volume Indicator (𝓥𝓥𝓘) closed source stems from several important considerations. First and foremost, this indicator encapsulates a unique methodology and proprietary calculations that differentiate it from other tools available in the market. By keeping the source code private, we protect the intellectual property and maintain the competitive edge that this sophisticated analysis provides.
Additionally, a closed-source approach ensures that the integrity of the indicator remains intact. Users can trust that the 𝓥𝓥𝓘 they are using is free from unauthorized modifications or errors introduced by third-party alterations. This guarantees consistent performance and reliability, which is critical for making accurate trading and investing decisions. Finally, keeping the code closed source allows for controlled updates and enhancements, ensuring that users always have access to the most refined and effective version of the indicator.

Volume PlusVolume plus provides volume insights to identify increase or decrease in relative volume or sudden volume expansion that exceeds the average. Based on the period selected the script displays the color code.
Features
1. Two different sensitivity levels can be selected for volumes and coloring.
2. Whenever the volume is higher than the selected SMA, volume bars will change color.
3. Can Plot 20 SMA (can be changed)

Hopiplaka Goldbach System with SignalsThis tool builds a dynamic price framework around the current market using a PO3 range and a set of mathematically derived Goldbach levels. It then scores nearby levels for quality (reliability) and produces Buy/Sell signals only when multiple, independent factors line up (price level quality, trend/“Tesla Vortex” state, ICT AMD phase, time confluence, volume bias, and momentum). The goal is to identify high-confluence inflection points rather than constant signals.
Core Concepts & Why They’re Combined
1. PO3 Range Framework
Price is segmented into a primary range (lower → upper) determined by a configurable size (3× ladder: 3, 9, 27, …, 2187).
⦁ If price sits near a boundary (configurable sensitivity), the range can auto-expand to the next 3× size to better fit current volatility.
⦁ This gives a stable “map” of the active trading area and its boundaries.
2. Goldbach Levels (Pure Hopiplaka implementation)
For each even number ≤ your precision limit, the script evaluates all prime-sum partitions (Goldbach partitions) and converts their prime ratios into price levels inside the PO3 range.
⦁ Levels are classified as Premium / Standard / Discount based on properties of the prime pair and a mathematical weighting.
⦁ Strict minimum spacing rules (exact %, OB %, liquidity-void %) prevent clutter and keep only the most meaningful levels.
3. Tesla Vortex (trend/phase strength)
A volatility/trend-aware state machine estimates whether market is in MMxM (accumulation/mean-revert like) or TREND conditions and maps price interaction with high-quality levels to phases (e.g., Order Block Formation, Distribution).
⦁ This helps filter signals: buys favored in MMxM near supportive levels; sells favored in TREND near premium/liquidity levels, etc.
4. ICT Integration (AMD, IPDA bias hooks)
A lightweight AMD phase detector classifies the recent window into Accumulation / Manipulation / Distribution and marks market structure bias. This is used as confluence with level quality and trend state.
5. Time Confluence (Goldbach time)
Swing highs/lows are checked against Goldbach-valid timestamps (based on hour+minute sums decomposable into prime pairs). Repeated alignment adds time-bias confidence. When price and time align, level reliability is boosted.
6. Volume & Liquidity Context
A rolling volume baseline marks High/Low Volume Bias; levels can be volume-weighted (raising or lowering their reliability). Proximity to PO3 extremes flags pending liquidity sweeps.
Why this mashup?
The system blends price geometry (PO3 + Goldbach), state/trend (Tesla Vortex), market-microstructure (ICT AMD), time confluence, and volume/liquidity into one numerically scored signal. Each component answers a different question; together they reduce false positives and favor high-quality trades near meaningful levels.
What You’ll See on the Chart
⦁ PO3 Range Boundaries: two dashed lines (“lower” and “upper”). Auto-expand darkens the boundary style slightly.
⦁ Goldbach Levels: horizontal lines colored by classification and context:
⦁ Premium (strong premium band), Standard, Discount
⦁ OB (Order-Block candidate), LV (Liquidity Void)
⦁ TESLA node (trend/phase aligned)
⦁ Heavier width = higher reliability; dashed/dotted styles encode class differences.
⦁ PO3 Liquidity Boxes: narrow yellow shaded bands above/below each level (configurable pip distance).
⦁ Markers
⦁ ▲ Buy arrow below bar when a Buy signal triggers
⦁ ▼ Sell arrow above bar when a Sell signal triggers
⦁ ● Small dot when price touches a Goldbach level
⦁ Data-window plots:
⦁ Tesla Vortex Strength (numeric)
⦁ Time Bias (positive = bullish, negative = bearish)
⦁ Volume Bias (+1 high / −1 low)
⦁ Signal Strength (+ for buy / − for sell, zero when no signal)
⦁ Label Legend (on level tags)
⦁ TESLA – Tesla-aligned level node
⦁ OB – Order-block-quality zone
⦁ LV – Liquidity-void zone
⦁ Premium / Standard / Discount – Level class
⦁ Gxx – Even number used to build the level (Goldbach reference)
⦁ Reliability – Final score after time/volume/tesla weighting
⦁ Optional extras: Vol (relative volume weight), Time (time-confluence strength)
How Signals Are Generated
A signal is proposed when price comes within a minimum distance of a high-reliability level. It is then accepted only if enough of these independent checks pass (you control the required count):
1. Tesla Vortex state matches direction (e.g., MMxM with buy; TREND with sell).
2. ICT AMD phase aligns (Accumulation → buy bias; Distribution → sell bias).
3. Goldbach time bias supports the direction.
4. Volume bias supportive (high-volume context boosts conviction).
5. Level quality (TESLA node or Premium class) is high.
6. Momentum alignment (recent 2–3 bars in the same direction).
Only when confluence ≥ your threshold and confidence ≥ 0.5 (scaled by sensitivity) will a Buy/Sell arrow print. Cooldown prevents rapid repeats.
Inputs (key ones)
⦁ PO3 Settings: range size, auto-expansion toggle, expansion sensitivity, liquidity band distance.
⦁ Goldbach Mathematics: precision limit, exact spacing rules, spacing for OB/LV classes.
⦁ Trading Signals: master toggle, sensitivity, min reliability, confluence required, cooldown, min distance to level, markers on/off.
⦁ Tesla Vortex / ICT: enable Vortex, sensitivity; enable AMD/IPDA analysis and lookback.
⦁ Time & Volume: enable Goldbach time and weighting; volume lookback; liquidity-pool detection.
⦁ Display: show historical/future projections, number of future bars, labels, path/phase overlays.
⦁ Colors: full palette per class/context (premium/discount/OB/LV/Tesla/time/volume, buy/sell/goldbach hit).
Alerts Included
⦁ Signals: “BUY Signal Generated”, “SELL Signal Generated”
⦁ Level Interactions: “Goldbach Level Hit”; “Near Goldbach Level”; “Tesla Vortex Node”; “Premium Level Alert”
⦁ PO3: “PO3 Upper Break”, “PO3 Lower Break”, “PO3 Range Expansion”
⦁ State Changes: “Tesla Vortex Phase Change”
⦁ Context: “Liquidity Sweep Imminent”, “Strong Time Confluence”
You can wire these to webhooks or notifications.
Suggested Workflow
1. Choose PO3 size that matches your instrument’s volatility; keep Auto-Expansion ON initially.
2. Set confluence threshold (start at 3–4) and cooldown (e.g., 10 bars).
3. Keep Time and Volume modules ON for additional reliability weighting.
4. Use arrows as filters, not blind entries—confirm with your execution plan and risk rules.
5. Prefer signals near Premium/Discount TESLA nodes that also show time confluence and supportive volume.
Practical Notes & Limitations
⦁ The mathematical framework is deterministic, but market execution is not—always manage risk.
⦁ Future projections and heavy labeling can be resource-intensive; tune visibility if performance drops.
⦁ If a market is extremely illiquid or gap-prone, spacing/filters may hide many levels (by design).
Disclaimer
This script is for educational and research purposes only and is not financial advice. Trading involves risk. You are responsible for your own decisions.

Low Volatility Breakout Detector)This indicator is designed to visually identify potential breakouts from consolidation during periods of low volatility. It is based on classic Bollinger Bands and relative volume. Its primary purpose is not to generate buy or sell signals but to assist in spotting moments when the market exits a stagnation phase.
Arrows appear only when the price breaks above the upper or below the lower Bollinger Band, the band width is below a specified threshold (expressed in percentage), and volume is above its moving average multiplied by a chosen multiplier (default is 1). This combination may indicate the start of a new impulse following a period of low activity.
The chart background during low volatility is colored based on volume strength—the lower the volume during stagnation, the less transparent the background. This helps quickly spot unusual market behavior under seemingly calm conditions. The background opacity is dynamically scaled relative to the range of volumes over a selected period, which can be set manually (default is 50 bars).
The indicator works best in classic horizontal consolidations, where price moves within a narrow range and volatility and volume clearly decline. It is not intended to detect breakouts from formations such as triangles or wedges, which may not always exhibit low volatility relative to Bollinger Bands.
Settings allow you to adjust:
Bollinger Band length and multiplier,
Volatility threshold (in %),
Background and arrow colors,
Volume moving average length and multiplier,
Bar range used for background opacity scaling.
Note: For reliable results, it’s advisable to tailor the volatility threshold and volume/background ranges to the specific market and timeframe, as different instruments have distinct dynamics. If you want the background color to closely match the color of breakout arrows, you should set the same volume analysis period as the volume moving average length.
Additional note: To achieve a cleaner chart and focus solely on breakout signals, you can disable the background and Bollinger Bands display in the settings. This will leave only the breakout arrows visible on the chart, providing a clearer and more readable market picture.

SwingTrade VWAP Strategy[TiamatCrypto]V1.1This Pine Script® code creates a trading strategy called "SwingTrade VWAP Strategy V1.1." This strategy incorporates various trading tools, such as VWAP (Volume Weighted Average Price), ADX (Average Directional Index), and volume signals. Below is an explanation of the components and logic within the script:
### Overview of Features
- **VWAP:** A volume-weighted moving average that assesses price trends relative to the VWAP level.
- **ADX:** A trend strength indicator that helps confirm the strength of bullish or bearish trends.
- **Volume Analysis:** Leverages volume data to gauge momentum and identify volume-weighted buy/sell conditions.
- **Dynamic Entry/Exit Signals:** Combines the above indicators to produce actionable buy/sell or exit signals.
- **Customizable Inputs:** Inputs for tuning parameters like VWAP period, ADX thresholds, and volume sensitivity.
---
### **Code Breakdown**
#### **Input Parameters**
The script begins by defining several user-configurable variables under groups. These include indicators' on/off switches (`showVWAP`, `enableADX`, `enableVolume`) and input parameters for VWAP, ADX thresholds, and volume sensitivity:
- **VWAP Period and Threshold:** Controls sensitivity for VWAP signal generation.
- **ADX Settings:** Allows users to configure the ADX period and strength threshold.
- **Volume Ratio:** Detects bullish/bearish conditions based on relative volume patterns.
---
#### **VWAP Calculation**
The script calculates VWAP using the formula:
\
Where `P` is the typical price (`(high + low + close)/3`) and `V` is the volume.
- It resets cumulative values (`sumPV` and `sumV`) at the start of each day.
- Delta percentage (`deltaPercent`) is calculated as the percentage difference between the close price and the VWAP.
---
#### **Indicators and Signals**
1. **VWAP Trend Signals:**
- Identifies bullish/bearish conditions based on price movement (`aboveVWAP`, `belowVWAP`) and whether the price is crossing the VWAP level (`crossingUp`, `crossingDown`).
- Also detects rising/falling delta changes based on the VWAP threshold.
2. **ADX Calculation:**
- Calculates the directional movement (`PlusDM`, `MinusDM`) and smoothed values for `PlusDI`, `MinusDI`, and `ADX`.
- Confirms strong bullish/bearish trends when ADX crosses the defined threshold.
3. **Volume-Based Signals:**
- Evaluates the ratio of bullish volume (when `close > VWAP`) to bearish volume (when `close < VWAP`) over a specified lookback period.
---
#### **Trade Signals**
The buy and sell signals are determined by combining conditions from the VWAP, ADX, and volume signals:
- **Buy Signal:** Triggered when price upward crossover VWAP, delta rises above the threshold, ADX indicates a strong bullish trend, and volume confirms bullish momentum.
- **Sell Signal:** Triggered under inverse conditions.
- Additionally, exit conditions (`exitLong` and `exitShort`) are based on VWAP crossovers combined with the reversal of delta values.
---
#### **Plotting and Display**
The strategy plots VWAP on the chart and adds signal markers for:
- **Buy/Long Entry:** Green triangle below bars.
- **Sell/Short Entry:** Red triangle above bars.
- **Exit Signals:** Lime or orange "X" shapes for exits from long/short positions.
- Additionally, optional text labels are displayed to indicate the type of signal.
---
#### **Trading Logic**
The script's trading logic executes as follows:
- **Entries:**
- Executes long trades when the `buySignal` condition is true.
- Executes short trades when the `sellSignal` condition is true.
- **Exits:**
- Closes long positions upon `exitLong` conditions.
- Closes short positions upon `exitShort` conditions.
- The strategy calculates profits and visualizes the trade entry, exit, and running profit within the chart.
---
#### **Alerts**
Alerts are set up to notify traders via custom signals for buy and sell trades.
---
### **Use Case**
This script is suitable for day traders, swing traders, or algorithmic traders who rely on confluence signals from VWAP, ADX, and volume momentum. Its modular structure (e.g., the ability to enable/disable specific indicators) makes it highly customizable for various trading styles and financial instruments.
#### **Customizability**
- Adjust VWAP, ADX, and volume sensitivity levels to fit unique market conditions or asset classes.
- Turn off specific criteria to focus only on VWAP or ADX signals if desired.
#### **Caution**
As with all trading strategies, this script should be used for backtesting and analysis before live implementation. It's essential to validate its performance on historical data while considering factors like slippage and transaction costs.

Quantum VRSIThe VRSI indicator is another in the suite of volume indicators we have developed and one that complements our volume price analysis methodology perfectly. and was developed out of a desire to build further on our cornerstone of VPA by peeling back the layers of volume and considering the relative aspect of volume. Hence, the acronym of Volume Relative Strength Index indicator encapsulates what the indicator is all about.
By analyzing relative volume, we are able to see a visual representation of the pressure in a trend, or indeed the lack of pressure, and in doing so, present in a clear, intuitive, and colorful way whether the trend we are trading or considering joining is being driven with constant or rising pressure as it develops. If so, the indicator gives us that all-important ingredient: confidence—namely, the confidence to continue maintaining the position for as long as possible. However, equally important is when we see a trend that is tiring, with falling pressure, sending a strong signal it is time to close out. Alternatively, when there is little or no pressure in the trend, this is a signal to wait and be patient.
These signals are delivered in a variety of ways, primarily through a color change sequence of brighter or darker colors, but equally importantly, based on the height of each pressure bar and its relationship to its neighbor or groups of bars. And herein lies the close relationship to the volume price analysis methodology since the interpretation of both is about judging bars against one in terms of confirmation of trends, such as rising volume and rising pressure bars, or alternatively falling volume and falling pressure bars signaling that the trend is weakening.
The Volume Relative Strength Index indicator, or VRSI, embodies the core concept of volume-price analysis. It blends trading volume data with price to create an indicator for all the various markets and instruments, whether stocks, ETFs, futures, forex, or cryptocurrencies. The result is an intuitive visual representation of the market’s underlying bullish and bearish pressure in the form of an oscillating histogram with varying colors, with the central fulcrum at zero giving a clear indication when sentiment is shifting from bullish to bearish, or vice versa.
Now, for the first time, you can see the strength of the trend represented visually and clearly based on our two leading indicators of relative volume and price, giving you that essential ingredient we all seek: confidence. And just as with all our other indicators, we urge you to use it in multiple timeframes.

Exceptional Volume Spike - Potential Trend Reversal IndicatorWhat the Script Does:
The indicator aims to identify potential trend reversal points using the following steps:
Input Parameters: The script has three main input parameters that you can adjust:
relative_volume_threshold: This parameter sets the threshold for what is considered an exceptional volume spike in relation to the average volume.
ema_length: The length of the exponential moving average (EMA) used for smoothing calculations.
lookback_period: The period over which the script calculates potential support and resistance levels.
Relative Volume Calculation: The script calculates the relative volume by dividing the current volume by the average volume over the specified lookback_period.
Exceptional Volume Spikes: The script identifies exceptional volume spikes when the calculated relative volume exceeds the specified relative_volume_threshold.
EMA of Exceptional Volume Spikes: The script calculates the exponential moving average (EMA) of volume spikes. This EMA smooths out the volume spikes over the chosen ema_length.
Trend Direction: The script determines the trend direction using the crossovers of the EMA of exceptional volume spikes. If the EMA crosses above the EMA of regular volume (not spikes), it suggests a potential upward trend reversal. Conversely, if the EMA crosses below, it suggests a potential downward trend reversal.
Support and Resistance Levels: The script calculates potential support and resistance levels based on the highest high (hh) and lowest low (ll) over the specified lookback_period. These levels are then plotted on the chart.
Plot Shapes and EMA: The script plots triangle shapes below the bars for potential upward reversals and above the bars for potential downward reversals. Additionally, it plots the EMA of the closing price with different colors based on the trend direction.
By using this script as an indicator on your chart, you can visually assess potential trend reversal points based on exceptional volume spikes, trend direction crossovers, and support/resistance levels. Remember that this script serves as a tool to assist your analysis, and it's important to combine it with other technical analysis tools and strategies before making trading decisions.

AutoLevels3.0AutoLevels is a script based on the ATR ( Average True Range ) of price action over the past 14 days. It calculates those and includes Fibonacci Extensions to create Levels that are Automatically created each morning. These are not based on past price action but are well respected and easily show patterns throughout the day.
Levels are made up of a BULL BAR , a BEAR BAR ( Go long above Bull, short below Bear Bar ) and the various extensions beyond them. Common Liquidity areas are also highlighted as tan/yellow bars. These are common reversal and contention levels should price action approach them.
Also included are 4 EMAs that have been transformed into 2 separate EMA clouds. These clouds will change color when bearish / bullish and crossing and signal up and downtrends and compress during chop. They are 100% customizable with your own EMA preference. Colors as well.
The Candles are Volume Based Candles. They default to Hollow candles when Volume is below the 24 moving average ( customizable ) and are filled solid when the volume for that time period has HIGH RELATIVE VOLUME. These are GREAT SIGNALS as price action approaches the levels that the AUTOLEVEL indicator generate. When a candle is filled and approaching a level it is likely to break through or attempting to. Low volume candles, hollow, show low conviction in price movement.
Aside from the Fibonacci Levels generated, the EMA Clouds and the Volume Candles you can also select how full or minimal your chart is. ( more levels to only a few ) Also you can extend all levels to the right for future charting or leave that selection off to only generate the static daily levels a few bars ahead.
You can also adjust the timeframe the Autolevels are generating levels for. 1 day is the current day. 1 month plots out a month of levels and is best used with the 1D timeframe.
You can look up my Twitter account for hundreds of examples of daily use.

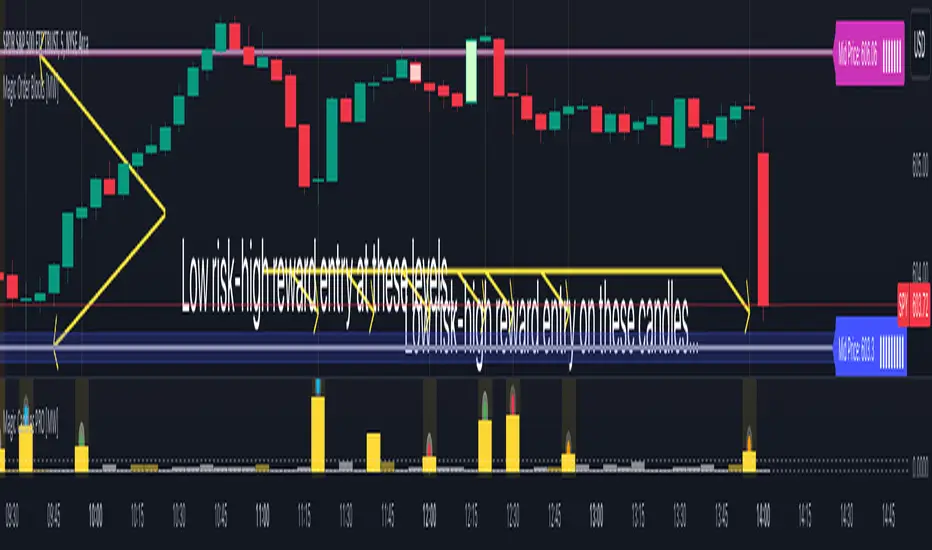
Weis Wave Volume NumbersWhat is it?
This is an indicator to complement @modhelius' Weis Wave Volume Indicator.
Original code has been modified to display wave volume (cumulative) numbers above or below the latest candle of the corresponding wave on the main pane. Since we are concerned only with relative volume, VOLUME NUMBERS HAVE BEEN SCALED DOWN. (If you need actual volume numbers, uncheck "Scale Down Volume" option in Settings). Rising wave volume is denoted in green. Falling wave volume is denoted in red. Developing wave volume is postfixed with a '_'. Confirmed wave volumes won't have this.
Who is it for?
This indicator is useful if you already use Weis Waves in your analysis and could do with an additional numerical representation of the wave volume on the main pane. Can be used in conjunciton with @modhelius' Weis Wave Volume (WWV) indicator (need to be added separately) to complement the visual representation of the waves. Can be used independently as well.
Pelase note that if you use any other Weis Wave indicator (other than @modhelius'), the numbers and the waveforms might not match.
Neglected Volume by DGTVolume is one piece of information that is often neglected, however, learning to interpret volume brings many advantages and could be of tremendous help when it comes to analyzing the markets. In addition to technicians, fundamental investors also take notice of the numbers of shares traded for a given security.
What is Volume?
The volume represents all the recorded trades for a security that occurs in a given time interval. It is a measurement of the participation, enthusiasm, and interest in a given security. Think of volume as the force that drives the market. Volume substantiates, energizes, and empowers price. When volume increases, it confirms price direction; when volume decreases, it contradicts price direction.
In theory, increases in volume generally precede significant price movements. However, If the price is rising in an uptrend but the volume is reducing or unchanged, it may show that there’s little interest in the security, and the price may reverse.
A high volume usually indicates more interest in the security and the presence of institutional traders. However, a rapidly rising price in an uptrend accompanied by a huge volume may be a sign of exhaustion.
Traders usually look for breaks of support and resistance to enter positions. When security break critical levels without volume, you should consider the breakout suspect and prime for a reversal off the highs/lows
Volume spikes are often the result of news-driven events. Volume spike will often lead to sharp reversals since the moves are unsustainable due to the imbalance of supply and demand
note : there’s no centralized exchange where trades are recorded, so the volume data represents what happens at a particular exchange only
In most charting platforms, the volume indicator is presented as color-coded bars, green if the security closes up and red if the security closed lower, where the height of the bars show the amount of the recorded trades
Within this study, Relative Volume , Volume Weighted Bars and Volume Moving Average are presented, where Relative Volume relates current trading volume to past trading volume over long period, Volume Weighted Bars presents price bars colored based on short period past trading volume average, and Volume Moving Average is average of volume over shot period
Relative Volume is presented as color-coded bars similar to regular Volume indicator but uses four color codes instead two. Notable increases of volume are presented in green and red while average values with back and gray, hence adding ability to emphasis notable increases in the volume. It is kind of a like a radar for how "in-play" a security is. Users are allowed to change the threshold, default value is set to Fibonacci golden ration standard deviation away from its moving average.
Volume Weighted Bars, a study of Kıvanç Özbilgiç, aims to present if price movements are supported by Volume. Volume Weighted Bars are calculated based on shot period volume moving average which will reflect more recent changes in volume. Price actions with high volume will be displayed with darker colors, average volume values will remain as they are and low volume values will be indicated with lighter colors.
Volume Moving Average, Is short period volume moving average, aims to display visually the volume changes. Please not that Relative Volume bars are calculated based on standard deviation of long volume moving average.
What Else?
Apart from the volume itself, your ability to assess what volume is telling you in conjunction with price action can be a key factor in your ability to turn a profit in the market. It makes little sense to analyze the volume alone. To correctly interpret the volume data, it shall be seen in the light of what the price is doing. there are a lot of other indicators that are based on the volume data as well as price action. Analysing those volume indicators has always helped traders and investors to better understand what is happening in the market.
Here are the ones adapted with this study. Some of them used as a source for our aim, some adapted as they are with slight changes to fit visually to this study and please note that the numerical presentation may differ from their regular use
• On Balance Volume
• Divergence Indicator
• Correlation Coefficient
• Chaikin Money Flow
Shortly;
On Balance Volume
The On Balance Volume indicator, is a technical analysis indicator that relates volume flow to changes in a security’s price. It uses a cumulative total of positive and negative trading volume to predict the direction of price. The OBV is a volume-based momentum oscillator, so it is a leading indicator — it changes direction before the price
Granville, creator of OBV, proposed the theory that changes in volume precede price movements in a measurable way. He believed that volume was the main force behind major market moves and thought of OBV’s prediction of price changes as a compressed spring that expands rapidly when released.
It is believed that the OBV shows the interactions between the institutional and retail traders in the market
If the price makes a new high, the OBV should also make a new high. If the OBV makes a lower high when the price makes a higher high, there’s a classical bearish divergence — indicating that only the retail traders are buying. Another type of bearish divergence occurs when the price remains relatively quiet and fails to make a higher high but the OBV soars higher than the previous high — indicating that the institutional traders are accumulating short positions. On the other hand, if the price makes a lower low and the OBV makes a higher low, there is a classical bullish divergence, showing that the institutional traders don’t believe in that move
With this study, Momentum and Acceleration (optional) of OBV is calculated and presented, where momentum is most commonly referred to as a rate and measures the acceleration of the price and/or volume of a security. It is also referred to as a technical analysis indicator and oscillator that is able to determine market trends.
Additionally, smoothing functionality with Least Squares Method is added
Divergences especially, should always be noted as a possible reversal in the current trend, so the divergence indicator is adapted with this study where the Momentum of OBV is assumed as Oscillator with similar usages as to RSI. Divergence is most often used to track and analyze the momentum in an asset’s price and the odds of a price reversal within the current trend. The divergence indicator warns traders and technical analysts of changes in a price/volume trend, oftentimes that it is weakening or changing direction.
Correlation Coefficient
The correlation coefficient is a statistical measure of the strength of the relationship between the relative movements of two variables. A correlation of -1.0 shows a perfect negative correlation, while a correlation of 1.0 shows a perfect positive correlation. A correlation of 0.0 shows no linear relationship between the movement of the two variables. In other words, the closer the Correlation Coefficient is to 1.0, indicates the instruments will move up and down together as it is mostly expected with volume and price. So the Correlation Coefficient Indicator aims to display when the price and volume (on balance volume) is in correlation and when not. With this study blue represent positive correlation while orange negative correlation. The strength of the correlation is determined by the width of the bands, to emphasis the effect horizontal lines are drawn with values set to 0.5 and -0.5. the values above 0.5 (or below -0.5) shows stronger correlation.
Chaikin Money Flow , provide optionally as a companion indicator
The Chaikin money flow indicator (CMF) is a volume indicator that measures the money flow volume over a chosen period. The money flow volume is a measure of the volume and where the price closed relative to the trading session’s range. It comes from the idea that buying pressure is indicated by a rising volume and recurrent closes in the upper part of the session’s price range while selling pressure is demonstrated by an increasing volume and repeated closes in the lower part of the price range.
Both buying and selling pressures are accompanied by an increase in volume, but the location of the closing prices are in accordance with the direction of price
Special thanks to @InvestCHK and @hjsjshs , who have enormously contributed while preparing this study
related studies:
Disclaimer:
Trading success is all about following your trading strategy and the indicators should fit within your trading strategy, and not to be traded upon solely
The script is for informational and educational purposes only. Use of the script does not constitute professional and/or financial advice. You alone have the sole responsibility of evaluating the script output and risks associated with the use of the script. In exchange for using the script, you agree not to hold dgtrd TradingView user liable for any possible claim for damages arising from any decision you make based on use of the script

Cnagda Liquidit Trading SystemCnagda Liquidit Trading System helps spot where price is likely to trap traders and reverse, then gives simple, actionable Level to entry, place SL, and take profits with confidence. It blends imbalance zones, trend bias, order blocks, liquidity pools, high-probability fake Signal, and context-aware candle patterns into one clean workflow.
🟩🟥 Imbalance boxes: “Crowd rushed, gaps left”
What it is: Green/red boxes mark fast, one-sided moves where price “skipped” orders—think FVG-like zones that often get revisited.
Why it helps: Price frequently pulls back to “fill” these zones, creating clean retest entries with logical stops.
⏩How to use:
Green box = potential demand retest; Red box = potential supply retest. Enter on pullback into box, not on first impulse. Put stop on far side of box and aim first targets at recent swing points.
↕️ Swing bias (HH/HL vs LH/LL): “Which way is the road?”
What it is: Higher-highs/higher-lows = up-bias; Lower-highs/lower-lows = down-bias. system plots Buy/Sell OB levels aligned with that bias.
Why it helps: Trading with the broader flow reduces “hero trades” against institutions. Bias gives clearer entries and cleaner drawdowns.
⏩How to use:
Up-bias: look for long on Buy OB retests. Down-bias: look for short on Sell OB retests. Wait for a small rejection/engulfing to confirm before triggering.
🧱Order blocks: “Where big players remember”
What it is: last opposite-colored candle before an impulsive move—these zones often hold memory and reaction. system plots these as Buy/Sell OB lines.
Why it helps: Many breakouts pull back to the origin. Good entries often happen on retest, not on the breakout chase.
⏩ How to use:
Let price return into the OB, show wick rejection, and decent volume. Enter with stop beyond OB; define risk-reward before entry.
📊Volume coloring: “How Volume is move?”
What it is: Bar color reflects relative volume; inside bars are black. The dashboard also shows Volume and “Volume vs Prev.”
Why it helps: Patterns without volume often fade; volume validates strength and intent of moves.
⏩ How to use:
Favor entries where imbalance/OB/liquidity-grab coincide with higher volume. If volume is weak, reduce size or skip.
🧲 BSL/SSL liquidity pools: “Fishing for stops”
What it is: Equal highs cluster stops above (BSL); equal lows cluster stops below (SSL). system plots these and highlights the nearest one (“magnet”).
Why it helps: Price often sweeps these pools to trigger stops before reversing. This is a prime trap-reversal location.
⏩ How to use:
Watch nearest BSL/SSL. If price wicks through and closes back inside, anticipate a reversal. Trade reaction, not first poke. When price closes beyond, consider that pool mitigated and move on.
🟢🔴 Advanced liquidity grab: “Catch fakeout”
What it is: Bullish grab = makes a new low beyond a prior low but closes back above it, with a long lower wick, small body, and higher volume. Bearish is mirror. Labeled automatically.
Why it helps: It exposes trap moves (stop hunts) and often precedes true direction.
⏩ How to use:
Best when it aligns with a nearby imbalance/OB and supportive volume. Enter on reversal candle break or on retest. Stop goes beyond sweep wick.
🧠 Smart candlestick patterns (only in right place)
What it is: Engulfing, Hammer, Shooting Star, Hanging Man, Doji (with high volume), Morning/Evening Star, Piercing—but marked “effective” only if context (swing/trend/location) agrees.
Why it helps: same pattern in the wrong place is noise; in the right place, it’s signal.
⏩ How to use:
Location first (BSL/SSL/OB/imbalance), then pattern. Treat pattern as trigger/confirmation—one fresh label shows to keep chart clean.
🧭 Dashboard: “Context in a glance”
⏩ Reversal Level: current swing anchor—expect turns or reactions nearby; great for alerts and planning.
⏩ Volume vs Prev + Volume: Strength meter for signal candle—higher adds conviction.
⏩ Nearest Pool: next “magnet” area—look for sweeps/rejections there.
🧩Step-by-step trading flow (with mindset)
⏩ Set bias: HH/HL = long bias, LH/LL = short bias. Counter-trend only on clean sweeps with strong confirmation.
⏩ Find magnet: Check Nearest Pool (BSL/SSL). Focus attention there; it saves screen time.
⏩ Wait for event: Look for a sweep/grab label, or sharp rejection at pool/OB/imbalance. Avoid FOMO.
⏩ Add confluence: Stack 2–3 of these—imbalance box, OB, contextual pattern, supportive volume.
⏩Plan entry: Bullish: trigger above reversal candle high or take retest of FVG/OB. Stop below sweep wick/zone. Target at least 1:1.5–1:2.
Bearish: mirror above.
⏩Manage smartly: Take partials, move to breakeven or trail thoughtfully. Don’t drag stops inside zone out of emotion.
🎛️ Parameter tuning (to reduce human error)
⏩ swingLen: Smaller = faster but noisier; larger = cleaner but slower. Backtest first, then go live.
⏩ Tolerance (ATR or percent): ATR tolerance adapts to volatility (good for fast markets and lower TFs). Start around 0.15–0.30. In calm markets, try percent 0.05–0.15%.
⏩ minBarsGap: Start with 3–5 so equal highs/lows are truly equal—reduces false pools.
❌Common mistakes → ✅ Better habits
⏩Chasing every breakout → Wait for sweep/rejection, then confirm.
⏩Ignoring volume → Validate strength; cut size or skip on weak volume.
⏩Losing history of pools → If reviewing/backtesting, keep mitigated pools visible (dashed/faded).
⏩Over-tight tolerance/too small swingLen → Increases false signals; backtest to find balance.
📝 checklist (before entry)
⏩ Is there a nearby BSL/SSL and did a sweep/grab happen there?
⏩ Is there a close imbalance/OB that price can retest?
⏩ Do we have an effective pattern plus supportive volume?
⏩Is the stop beyond the wick/zone and RR ≥ 1:1.5?
•?((¯°·._.• 🎀 𝐻𝒶𝓅𝓅𝓎 𝒯𝓇𝒶𝒹𝒾𝓃𝑔 🎀 •._.·°¯((?•

Diamond Peaks [EdgeTerminal]The Diamond Peaks indicator is a comprehensive technical analysis tool that uses a few mathematical models to identify high-probability trading opportunities. This indicator goes beyond traditional support and resistance identification by incorporating volume analysis, momentum divergences, advanced price action patterns, and market sentiment indicators to generate premium-quality buy and sell signals.
Dynamic Support/Resistance Calculation
The indicator employs an adaptive algorithm that calculates support and resistance levels using a volatility-adjusted lookback period. The base calculation uses ta.highest(length) and ta.lowest(length) functions, where the length parameter is dynamically adjusted using the formula: adjusted_length = base_length * (1 + (volatility_ratio - 1) * volatility_factor). The volatility ratio is computed as current_ATR / average_ATR over a 50-period window, ensuring the lookback period expands during volatile conditions and contracts during calm periods. This mathematical approach prevents the indicator from using fixed periods that may become irrelevant during different market regimes.
Momentum Divergence Detection Algorithm
The divergence detection system uses a mathematical comparison between price series and oscillator values over a specified lookback period. For bullish divergences, the algorithm identifies when recent_low < previous_low while simultaneously indicator_at_recent_low > indicator_at_previous_low. The inverse logic applies to bearish divergences. The system tracks both RSI (calculated using Pine Script's standard ta.rsi() function with Wilder's smoothing) and MACD (using ta.macd() with exponential moving averages). The mathematical rigor ensures that divergences are only flagged when there's a clear mathematical relationship between price momentum and the underlying oscillator momentum, eliminating false signals from minor price fluctuations.
Volume Analysis Mathematical Framework
The volume analysis component uses multiple mathematical transformations to assess market participation. The Cumulative Volume Delta (CVD) is calculated as ∑(buying_volume - selling_volume) where buying_volume occurs when close > open and selling_volume when close < open. The relative volume calculation uses current_volume / ta.sma(volume, period) to normalize current activity against historical averages. Volume Rate of Change employs ta.roc(volume, period) = (current_volume - volume ) / volume * 100 to measure volume acceleration. Large trade detection uses a threshold multiplier against the volume moving average, mathematically identifying institutional activity when relative_volume > threshold_multiplier.
Advanced Price Action Mathematics
The Wyckoff analysis component uses mathematical volume climax detection by comparing current volume against ta.highest(volume, 50) * 0.8, while price compression is measured using (high - low) < ta.atr(20) * 0.5. Liquidity sweep detection employs percentage-based calculations: bullish sweeps occur when low < recent_low * (1 - threshold_percentage/100) followed by close > recent_low. Supply and demand zones are mathematically validated by tracking subsequent price action over a defined period, with zone strength calculated as the count of bars where price respects the zone boundaries. Fair value gaps are identified using ATR-based thresholds: gap_size > ta.atr(14) * 0.5.
Sentiment and Market Regime Mathematics
The sentiment analysis employs a multi-factor mathematical model. The fear/greed index uses volatility normalization: 100 - min(100, stdev(price_changes, period) * scaling_factor). Market regime classification uses EMA crossover mathematics with additional ADX-based trend strength validation. The trend strength calculation implements a modified ADX algorithm: DX = |+DI - -DI| / (+DI + -DI) * 100, then ADX = RMA(DX, period). Bull regime requires short_EMA > long_EMA AND ADX > 25 AND +DI > -DI. The mathematical framework ensures objective regime classification without subjective interpretation.
Confluence Scoring Mathematical Model
The confluence scoring system uses a weighted linear combination: Score = (divergence_component * 0.25) + (volume_component * 0.25) + (price_action_component * 0.25) + (sentiment_component * 0.25) + contextual_bonuses. Each component is normalized to a 0-100 scale using percentile rankings and threshold comparisons. The mathematical model ensures that no single component can dominate the score, while contextual bonuses (regime alignment, volume confirmation, etc.) provide additional mathematical weight when multiple factors align. The final score is bounded using math.min(100, math.max(0, calculated_score)) to maintain mathematical consistency.
Vitality Field Mathematical Implementation
The vitality field uses a multi-factor scoring algorithm that combines trend direction (EMA crossover: trend_score = fast_EMA > slow_EMA ? 1 : -1), momentum (RSI-based: momentum_score = RSI > 50 ? 1 : -1), MACD position (macd_score = MACD_line > 0 ? 1 : -1), and volume confirmation. The final vitality score uses weighted mathematics: vitality_score = (trend * 0.4) + (momentum * 0.3) + (macd * 0.2) + (volume * 0.1). The field boundaries are calculated using ATR-based dynamic ranges: upper_boundary = price_center + (ATR * user_defined_multiplier), with EMA smoothing applied to prevent erratic boundary movements. The gradient effect uses mathematical transparency interpolation across multiple zones.
Signal Generation Mathematical Logic
The signal generation employs boolean algebra with multiple mathematical conditions that must simultaneously evaluate to true. Buy signals require: (confluence_score ≥ threshold) AND (divergence_detected = true) AND (relative_volume > 1.5) AND (volume_ROC > 25%) AND (RSI < 35) AND (trend_strength > minimum_ADX) AND (regime = bullish) AND (cooldown_expired = true) AND (last_signal ≠ buy). The mathematical precision ensures that signals only generate when all quantitative conditions are met, eliminating subjective interpretation. The cooldown mechanism uses bar counting mathematics: bars_since_last_signal = current_bar_index - last_signal_bar_index ≥ cooldown_period. This mathematical framework provides objective, repeatable signal generation that can be backtested and validated statistically.
This mathematical foundation ensures the indicator operates on objective, quantifiable principles rather than subjective interpretation, making it suitable for algorithmic trading and systematic analysis while maintaining transparency in its computational methodology.
* for now, we're planning to keep the source code private as we try to improve the models used here and allow a small group to test them. My goal is to eventually use the multiple models in this indicator as their own free and open source indicators. If you'd like to use this indicator, please send me a message to get access.
Advanced Confluence Scoring System
Each support and resistance level receives a comprehensive confluence score (0-100) based on four weighted components:
Momentum Divergences (25% weight)
RSI and MACD divergence detection
Identifies momentum shifts before price reversals
Bullish/bearish divergence confirmation
Volume Analysis (25% weight)
Cumulative Volume Delta (CVD) analysis
Volume Rate of Change monitoring
Large trade detection (institutional activity)
Volume profile strength assessment
Advanced Price Action (25% weight)
Supply and demand zone identification
Liquidity sweep detection (stop hunts)
Wyckoff accumulation/distribution patterns
Fair value gap analysis
Market Sentiment (25% weight)
Fear/Greed index calculation
Market regime classification (Bull/Bear/Sideways)
Trend strength measurement (ADX-like)
Momentum regime alignment
Dynamic Support and Resistance Detection
The indicator uses an adaptive algorithm to identify significant support and resistance levels based on recent market highs and lows. Unlike static levels, these zones adjust dynamically to market volatility using the Average True Range (ATR), ensuring the levels remain relevant across different market conditions.
Vitality Field Background
The indicator features a unique vitality field that provides instant visual feedback about market sentiment:
Green zones: Bullish market conditions with strong momentum
Red zones: Bearish market conditions with weak momentum
Gray zones: Neutral/sideways market conditions
The vitality field uses a sophisticated gradient system that fades from the center outward, creating a clean, professional appearance that doesn't overwhelm the chart while providing valuable context.
Buy Signals (🚀 BUY)
Buy signals are generated when ALL of the following conditions are met:
Valid support level with confluence score ≥ 80
Bullish momentum divergence detected (RSI or MACD)
Volume confirmation (1.5x average volume + 25% volume ROC)
Bull market regime environment
RSI below 35 (oversold conditions)
Price action confirmation (Wyckoff accumulation, liquidity sweep, or large buying volume)
Minimum trend strength (ADX > 25)
Signal alternation check (prevents consecutive buy signals)
Cooldown period expired (default 10 bars)
Sell Signals (🔻 SELL)
Sell signals are generated when ALL of the following conditions are met:
Valid resistance level with confluence score ≥ 80
Bearish momentum divergence detected (RSI or MACD)
Volume confirmation (1.5x average volume + 25% volume ROC)
Bear market regime environment
RSI above 65 (overbought conditions)
Price action confirmation (Wyckoff distribution, liquidity sweep, or large selling volume)
Minimum trend strength (ADX > 25)
Signal alternation check (prevents consecutive sell signals)
Cooldown period expired (default 10 bars)
How to Use the Indicator
1. Signal Quality Assessment
Monitor the confluence scores in the information table:
Score 90-100: Exceptional quality levels (A+ grade)
Score 80-89: High quality levels (A grade)
Score 70-79: Good quality levels (B grade)
Score below 70: Weak levels (filtered out by default)
2. Market Context Analysis
Use the vitality field and market regime information to understand the broader market context:
Trade buy signals in green vitality zones during bull regimes
Trade sell signals in red vitality zones during bear regimes
Exercise caution in gray zones (sideways markets)
3. Entry and Exit Strategy
For Buy Signals:
Enter long positions when premium buy signals appear
Place stop loss below the support confluence zone
Target the next resistance level or use a risk/reward ratio of 2:1 or higher
For Sell Signals:
Enter short positions when premium sell signals appear
Place stop loss above the resistance confluence zone
Target the next support level or use a risk/reward ratio of 2:1 or higher
4. Risk Management
Only trade signals with confluence scores above 80
Respect the signal alternation system (no overtrading)
Use appropriate position sizing based on signal quality
Consider the overall market regime before taking trades
Customizable Settings
Signal Generation Controls
Signal Filtering: Enable/disable advanced filtering
Confluence Threshold: Adjust minimum score requirement (70-95)
Cooldown Period: Set bars between signals (5-50)
Volume/Momentum Requirements: Toggle confirmation requirements
Trend Strength: Minimum ADX requirement (15-40)
Vitality Field Options
Enable/Disable: Control background field display
Transparency Settings: Adjust opacity for center and edges
Field Size: Control the field boundaries (3.0-20.0)
Color Customization: Set custom colors for bullish/bearish/neutral states
Weight Adjustments
Divergence Weight: Adjust momentum component influence (10-40%)
Volume Weight: Adjust volume component influence (10-40%)
Price Action Weight: Adjust price action component influence (10-40%)
Sentiment Weight: Adjust sentiment component influence (10-40%)
Best Practices
Always wait for complete signal confirmation before entering trades
Use higher timeframes for signal validation and context
Combine with proper risk management and position sizing
Monitor the information table for real-time market analysis
Pay attention to volume confirmation for higher probability trades
Respect market regime alignment for optimal results
Basic Settings
Base Length (Default: 25)
Controls the lookback period for identifying support and resistance levels
Range: 5-100 bars
Lower values = More responsive, shorter-term levels
Higher values = More stable, longer-term levels
Recommendation: 25 for intraday, 50 for swing trading
Enable Adaptive Length (Default: True)
Automatically adjusts the base length based on market volatility
When enabled, length increases in volatile markets and decreases in calm markets
Helps maintain relevant levels across different market conditions
Volatility Factor (Default: 1.5)
Controls how much the adaptive length responds to volatility changes
Range: 0.5-3.0
Higher values = More aggressive length adjustments
Lower values = More conservative length adjustments
Volume Profile Settings
VWAP Length (Default: 200)
Sets the calculation period for the Volume Weighted Average Price
Range: 50-500 bars
Shorter periods = More responsive to recent price action
Longer periods = More stable reference line
Used for volume profile analysis and confluence scoring
Volume MA Length (Default: 50)
Period for calculating the volume moving average baseline
Range: 10-200 bars
Used to determine relative volume (current volume vs. average)
Shorter periods = More sensitive to volume changes
Longer periods = More stable volume baseline
High Volume Node Threshold (Default: 1.5)
Multiplier for identifying significant volume spikes
Range: 1.0-3.0
Values above this threshold mark high-volume nodes with diamond shapes
Lower values = More frequent high-volume signals
Higher values = Only extreme volume events marked
Momentum Divergence Settings
Enable Divergence Detection (Default: True)
Master switch for momentum divergence analysis
When disabled, removes divergence from confluence scoring
Significantly impacts signal generation quality
RSI Length (Default: 14)
Period for RSI calculation used in divergence detection
Range: 5-50
Standard RSI settings apply (14 is most common)
Shorter periods = More sensitive, more signals
Longer periods = Smoother, fewer but more reliable signals
MACD Settings
Fast (Default: 12): Fast EMA period for MACD calculation (5-50)
Slow (Default: 26): Slow EMA period for MACD calculation (10-100)
Signal (Default: 9): Signal line EMA period (3-20)
Standard MACD settings for divergence detection
Divergence Lookback (Default: 5)
Number of bars to look back when detecting divergences
Range: 3-20
Shorter periods = More frequent divergence signals
Longer periods = More significant divergence signals
Volume Analysis Enhancement Settings
Enable Advanced Volume Analysis (Default: True)
Master control for sophisticated volume calculations
Includes CVD, volume ROC, and large trade detection
Critical for signal accuracy
Cumulative Volume Delta Length (Default: 20)
Period for CVD smoothing calculation
Range: 10-100
Tracks buying vs. selling pressure over time
Shorter periods = More reactive to recent flows
Longer periods = Broader trend perspective
Volume ROC Length (Default: 10)
Period for Volume Rate of Change calculation
Range: 5-50
Measures volume acceleration/deceleration
Key component in volume confirmation requirements
Large Trade Volume Threshold (Default: 2.0)
Multiplier for identifying institutional-size trades
Range: 1.5-5.0
Trades above this threshold marked as large trades
Lower values = More frequent large trade signals
Higher values = Only extreme institutional activity
Advanced Price Action Settings
Enable Wyckoff Analysis (Default: True)
Activates simplified Wyckoff accumulation/distribution detection
Identifies potential smart money positioning
Important for high-quality signal generation
Enable Supply/Demand Zones (Default: True)
Identifies fresh supply and demand zones
Tracks zone strength based on subsequent price action
Enhances confluence scoring accuracy
Enable Liquidity Analysis (Default: True)
Detects liquidity sweeps and stop hunts
Identifies fake breakouts vs. genuine moves
Critical for avoiding false signals
Zone Strength Period (Default: 20)
Bars used to assess supply/demand zone strength
Range: 10-50
Longer periods = More thorough zone validation
Shorter periods = Faster zone assessment
Liquidity Sweep Threshold (Default: 0.5%)
Percentage move required to confirm liquidity sweep
Range: 0.1-2.0%
Lower values = More sensitive sweep detection
Higher values = Only significant sweeps detected
Sentiment and Flow Settings
Enable Sentiment Analysis (Default: True)
Master control for market sentiment calculations
Includes fear/greed index and regime classification
Important for market context assessment
Fear/Greed Period (Default: 20)
Calculation period for market sentiment indicator
Range: 10-50
Based on price volatility and momentum
Shorter periods = More reactive sentiment readings
Momentum Regime Length (Default: 50)
Period for determining overall market regime
Range: 20-100
Classifies market as Bull/Bear/Sideways
Longer periods = More stable regime classification
Trend Strength Length (Default: 30)
Period for ADX-like trend strength calculation
Range: 10-100
Measures directional momentum intensity
Used in signal filtering requirements
Advanced Signal Generation Settings
Enable Signal Filtering (Default: True)
Master control for premium signal generation system
When disabled, uses basic signal conditions
Highly recommended to keep enabled
Minimum Signal Confluence Score (Default: 80)
Required confluence score for signal generation
Range: 70-95
Higher values = Fewer but higher quality signals
Lower values = More frequent but potentially lower quality signals
Signal Cooldown (Default: 10 bars)
Minimum bars between signals of same type
Range: 5-50
Prevents signal spam and overtrading
Higher values = More conservative signal spacing
Require Volume Confirmation (Default: True)
Mandates volume requirements for signal generation
Requires 1.5x average volume + 25% volume ROC
Critical for signal quality
Require Momentum Confirmation (Default: True)
Mandates divergence detection for signals
Ensures momentum backing for directional moves
Essential for high-probability setups
Minimum Trend Strength (Default: 25)
Required ADX level for signal generation
Range: 15-40
Ensures signals occur in trending markets
Higher values = Only strong trending conditions
Confluence Scoring Settings
Minimum Confluence Score (Default: 70)
Threshold for displaying support/resistance levels
Range: 50-90
Levels below this score are filtered out
Higher values = Only strongest levels shown
Component Weights (Default: 25% each)
Divergence Weight: Momentum component influence (10-40%)
Volume Weight: Volume analysis influence (10-40%)
Price Action Weight: Price patterns influence (10-40%)
Sentiment Weight: Market sentiment influence (10-40%)
Must total 100% for balanced scoring
Vitality Field Settings
Enable Vitality Field (Default: True)
Controls the background gradient field display
Provides instant visual market sentiment feedback
Enhances chart readability and context
Vitality Center Transparency (Default: 85%)
Opacity at the center of the vitality field
Range: 70-95%
Lower values = More opaque center
Higher values = More transparent center
Vitality Edge Transparency (Default: 98%)
Opacity at the edges of the vitality field
Range: 95-99%
Creates smooth fade effect from center to edges
Higher values = More subtle edge appearance
Vitality Field Size (Default: 8.0)
Controls the overall size of the vitality field
Range: 3.0-20.0
Based on ATR multiples for dynamic sizing
Lower values = Tighter field around price
Higher values = Broader field coverage
Recommended Settings by Trading Style
Scalping (1-5 minutes)
Base Length: 15
Volume MA Length: 20
Signal Cooldown: 5 bars
Vitality Field Size: 5.0
Higher sensitivity for quick moves
Day Trading (15-60 minutes)
Base Length: 25 (default)
Volume MA Length: 50 (default)
Signal Cooldown: 10 bars (default)
Vitality Field Size: 8.0 (default)
Balanced settings for intraday moves
Swing Trading (4H-Daily)
Base Length: 50
Volume MA Length: 100
Signal Cooldown: 20 bars
Vitality Field Size: 12.0
Longer-term perspective for multi-day moves
Conservative Trading
Minimum Signal Confluence: 85
Minimum Confluence Score: 80
Require all confirmations: True
Higher thresholds for maximum quality
Aggressive Trading
Minimum Signal Confluence: 75
Minimum Confluence Score: 65
Signal Cooldown: 5 bars
Lower thresholds for more opportunities

RED-E Fakeout Prevention Tool 🔺 RED-E Fakeout Prevention Tool – Volume-Based Confirmation Filter
Overview
The RED-E Fakeout Prevention Tool is designed to filter out unreliable price action by validating moves based on volume strength. It helps traders avoid fakeouts—false breakouts or breakdowns—by requiring that volume meets specific criteria before considering a move legitimate.
Key Settings & How It Works
🔊 Volume Threshold (8,900,000)
This sets a fixed minimum volume requirement. If a candle’s volume is below this threshold, it’s considered too weak to confirm a move.
📈 Use Relative Volume (Enabled)
When enabled, the tool compares current volume against the average volume over a specified period rather than relying solely on raw volume. This makes the tool adaptable across assets with different liquidity levels.
📊 Relative % (100%)
This defines the multiplier for relative volume. A 100% setting means volume must be at least equal to the average to trigger a confirmation. For example, if the average volume is 5 million, the current candle must also exceed 5 million.
⏱️ Periods for Avg (20)
This sets the number of previous candles used to calculate the average volume. A 20-period average ensures that only meaningful deviations from recent volume norms trigger signals.
Use Case
Traders can use this tool in conjunction with price patterns, breakouts, or trend-based strategies to confirm the validity of price moves. By focusing only on high-volume moves, the tool reduces the risk of acting on low-volume traps or fake signals

Advanced Moving Average ChannelAdvanced Moving Average Channel (MAC) is a comprehensive technical analysis tool that combines multiple moving average types with volume analysis to provide a complete market perspective.
Key Features:
1. Dynamic Channel Formation
- Configurable moving average types (SMA, EMA, WMA, VWMA, HMA, TEMA)
- Separate upper and lower band calculations
- Customizable band offsets for precise channel adjustment
2. Volume Analysis Integration
- Multi-timeframe volume analysis (1H, 24H, 7D)
- Relative volume comparison against historical averages
- Volume trend detection with visual indicators
- Price-level volume distribution profile
3. Market Context Indicators
- RSI integration for overbought/oversold conditions
- Channel position percentage
- Volume-weighted price levels
- Breakout detection with visual signals
Usage Guidelines:
1. Channel Interpretation
- Price within channel: Normal market conditions
- Price above upper band: Potential overbought condition
- Price below lower band: Potential oversold condition
- Channel width: Indicates market volatility
2. Volume Analysis
- High relative volume (>150%): Strong market interest
- Low relative volume (<50%): Weak market interest
- Volume trend arrows: Indicate increasing/decreasing market participation
- Volume profile: Shows price levels with highest trading activity
3. Trading Signals
- Breakout arrows: Potential trend continuation
- RSI extremes: Confirmation of overbought/oversold conditions
- Volume confirmation: Validates price movements
Customization:
- Adjust MA length for different market conditions
- Modify band offsets for tighter/looser channels
- Fine-tune volume analysis parameters
- Customize visual appearance
This indicator is designed for traders who want to combine price action, volume analysis, and market structure in a single, comprehensive tool.

SuperTrend Confluence Signals [AlgoAlpha]OVERVIEW
This script enhances the classic SuperTrend indicator by integrating volume dynamics, retracement detection, and a multi-asset trend matrix—alongside an automatic mitigation-level drawing system. It's designed for traders who want to see not just trend direction, but the confluence of trend strength, volatility-adjusted retracements, and capital flow through volume pressure. It visually maps key transitions in market structure while offering a clean, color-coded overview of multiple symbols and timeframes in a single chart.
CONCEPTS
At the core is the traditional SuperTrend , which determines directional bias using Average True Range (ATR) with a volatility multiplier. This script overlays that with a dynamic volume histogram that scales relative to recent volume standard deviation, coloring volume bursts within the trend. Retracement signals are triggered when price pulls back toward the SuperTrend level but respects it—quantified through normalized distance sensitivity. On top of that, the indicator automatically draws and manages horizontal support/resistance zones that appear at key trend shifts. These levels persist and are cleared based on configurable rules such as wick/body sweeps or consecutive candle closes. A multi-asset, multi-timeframe table then gives an instant snapshot of trend status across five user-defined symbols and timeframes.
FEATURES
SuperTrend : Configurable ATR length and multiplier for flexible trend sensitivity.
Volumetric Histogram : Gradient-filled candles anchored to SuperTrend bands, scaled by relative volume to indicate activity intensity during trends.
Retracement Arrows : Signals printed when price nears the SuperTrend level without breaking it, allowing identification of high-probability continuation zones.
Volume TP Markers : Diamond markers flag high-volume events, contextualizing price moves with liquidity bursts.
Automatic Structure Levels : Draws clean horizontal lines at significant trend transitions, with optional volatility-based band fills. These levels self-update and clear based on price interaction logic.
Trend Table : Displays trend direction (▲/▼) across five assets and five timeframes. Each cell is colored according to trend bias, providing a compact overview for multi-market confluence.
USAGE
Start by loading the indicator on your main chart and adjusting the ATR Length and Multiplier to match your strategy timeframe. Use lower values for scalping and higher values for swing trading. The histogram bars will appear as colored candles above or below the SuperTrend level, indicating how strong volume is within that trend. Arrow signals suggest minor pullbacks within the trend, which can act as entry opportunities. The level system will automatically plot key price zones during trend flips; if "Body" is selected for mitigation, price must close through the level to invalidate it. If "Wick" is chosen, a single wick breach is enough. Adjust expiry and rejection settings to fine-tune how long levels stay on chart. Finally, enable the Multi-Asset Table to view live trend signals across popular symbols like AAPL or NVDA in different timeframes, helping spot macro-to-micro alignment for higher-confidence trades.

CVD Divergence Insights📘 CVD Divergence Insights – by Colicoid
Pine Script v6 | Volume Delta Divergence Oscillator with Spike Detection
⸻
🔍 Overview
CVD Divergence Insights is a volume-aware oscillator and divergence spike detector that helps you spot smart money activity, absorption, failed pressure, and hidden strength or weakness — even when price action alone gives little away.
It works by comparing normalized Cumulative Volume Delta (CVD) against normalized price movement, and optionally applying a volume-weighting layer to highlight when aggressive participation is truly behind the divergence. The result is a dynamic visual tool that identifies tension in the market, and helps you trade based on how that tension resolves.
⸻
🧠 Core Concept
• When price moves one way and CVD moves another, it reflects imbalance between aggression and result.
• Divergence is not a trigger — it’s a build-up of pressure.
• The real edge lies in the resolution of that pressure.
• Optional volume-weighting helps you ignore noise and focus on high-conviction moves only.
⸻
⚙️ How It Works
1. CVD Calculation
CVD is generated using lower-timeframe delta volume (buy vs. sell pressure), accumulated per bar.
2. Oscillator
A normalized divergence between the smoothed CVD and smoothed price.
3. Volume Weighting (optional)
Emphasizes divergences occurring on higher-than-normal volume, deprioritizes low-volume noise.
4. Signal Line (optional)
A short EMA of the oscillator to help track momentum shifts (hidden by default).
5. Divergence Spikes
Statistical spike detection using standard deviation — green/red dots highlight unusually large divergence activity.
⸻
🎛️ Inputs
Anchor Period
Higher timeframe where the CVD is accumulated and processed.
Lower Timeframe
Optional override for granularity of buy/sell volume data.
SMA Length
Used for smoothing both price and CVD before divergence is calculated.
Volume Weighted?
Enables adaptive weighting based on relative volume size.
Volume Normalization Length
Lookback period used to define what is “normal” volume.
Divergence Spike Threshold
StdDev-based threshold to detect abnormally large divergences.
Signal Line Length
Controls the EMA smoothing of the optional signal line (hidden by default).
⸻
📈 Trade Setup Example: Hidden Bullish Divergence
1. Price forms a higher low, but CVD forms a lower low — hidden bullish divergence.
2. This shows aggressive sellers are trying, but price is resilient — likely absorption.
3. You wait for a "convergent signal bar":
• A bullish candle with strong structure or body
• Confirmed by CVD starting to turn upward
4. That’s your trigger bar — the tension resolves upward.
⸻
🤝 Recommended Pairings
For best results, combine CVD Divergence Insights with the companion script:
🔗 Cumulative Volume Delta Line (also by Colicoid)
This lets you:
• See the raw CVD line and its SMA visually
• Spot standard and hidden divergences in price/CVD directly
• Use the Insights indicator to evaluate divergence quality and flag aggressive bull/bear behavior
• Use the same SMA length on both indicators for alignment
👉 Tip: To save screen space, drag the CVD Line indicator into the same panel as CVD Divergence Insights.
⸻
🧰 Why Use This?
• ✅ Catch absorption setups and failed pressure zones
• ✅ Filter out low-quality divergences using volume context
• ✅ Understand why price is hesitating or breaking out
• ✅ Add smart confirmation to breakout/reversal trades
• ✅ Align your execution with who’s actually in control
⸻
📎 Created by Colicoid
Built in Pine Script v6 for advanced price-volume analysis, with focus on effort vs result, market psychology, and smart money detection.

Volume Metrics & Market CapitalizationThis Pine Script indicator provides a comparative view of volume metrics and market capitalization to help traders analyze relative volume strength in the context of a stock’s overall size.
Key Features:
Volume Formatting:
Converts numerical values into readable units (K for thousand, M for million, B for billion, T for trillion).
Volume Metrics:
Displays current bar volume, cumulative daily volume, and 30-day average volume.
Market Capitalization Calculation:
Uses the outstanding shares multiplied by closing price to estimate market cap.
Table Display:
Shows all these values in an easy-to-read table in the bottom-right of the chart.
How It Helps Compare Relative Volume to Market Cap
Relative Volume Strength
By comparing current volume and 30-day average volume, traders can quickly gauge if today’s volume is unusually high or low.
If daily volume exceeds the 30-day average, it suggests increased market interest in the stock.
Market Cap Context
Market cap provides a reference for whether a stock is large-cap, mid-cap, or small-cap, influencing how volume should be interpreted.
A high volume surge in a low market cap stock may indicate stronger momentum compared to the same volume change in a large-cap stock.
Liquidity and Volatility Signals
Comparing volume to market cap helps determine liquidity—stocks with low market cap but high volume may be more volatile.
Example: A small-cap stock with $50M market cap trading $20M daily volume is seeing 40% turnover, a significant indicator of strong movement.
Practical Use Case
Day Traders: Spot stocks experiencing unusual volume surges relative to their market cap, identifying potential breakout or momentum plays.
Swing Traders: Assess if a stock is trading at above-average volume levels, confirming strength in trends.
Investors: Understand liquidity and potential institutional interest in stocks, as larger players typically trade in high market-cap names with sustained volume.
This indicator is a quick-glance tool for identifying high-volume stocks relative to their size, helping traders make more informed decisions on potential opportunities. 🚀

RELATIVE VOLThis script, titled "Relative Vol," is designed to visualize and analyze volume data on TradingView. It calculates and displays the relative volume based on the average volume over a set lookback period, with volume expressed as a percentage of the average. Key features include:
Volume Percentage Calculation: The script calculates the volume percentage relative to the average volume over a specified lookback period (default of 20). It compares the current volume to the historical average and plots it as a percentage on the chart.
Volume Color Coding: The bars are color-coded based on the relationship between price action and volume:
Bullish volume above average: Green
Bearish volume above average: Red
Bullish volume below average: Light gray
Bearish volume below average: Dark gray
Daily Data Integration: It pulls in daily average volume and daily Average True Range (ATR) data:
Displays the daily average volume and ATR values in a table on the top-right of the chart.
Colors in the table reflect whether the daily average volume is high (greater than 1,000,000) and if the daily ATR is above 2.
Custom Timeframe Calculation: The script adjusts the lookback period and volume calculation based on the timeframe of the chart (1-minute, 5-minute, 15-minute, 30-minute, 60-minute, or daily).
This script provides traders with a visual representation of relative volume, helping them identify whether current trading activity is above or below average and how it correlates with price movement. Additionally, the integration of daily volume and ATR data helps assess overall market volatility and liquidity trends.

Volume PressureDraws the candle chart with colors to represent low, medium and high volumes. You get 3 colors for downward and 3 colors for upward movement. This will aid with immediately seeing the relative volume pushing the stock candle in the direction of movement.
You can control the percentage threshold for low and high volume. You also can change the colors to represent each volume level for upward and downward movement.
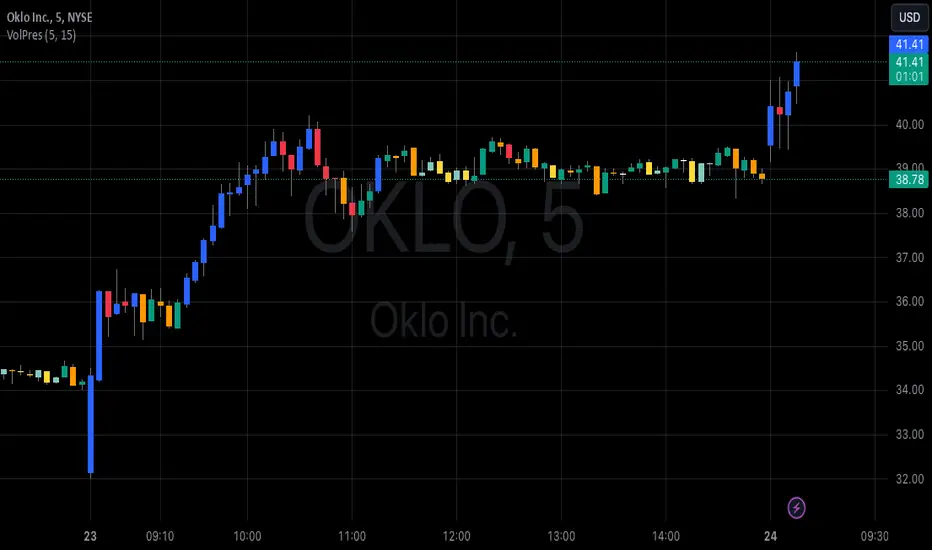
Comprehensive Volume and Metrics with Pre-Market Volume Data
This script is designed for traders who want a detailed view of market activity, including regular market and pre-market volume, dollar volume, relative volume (RVOL), average daily range (ADR), average true range (ATR), relative strength index (RSI), and the QQQ’s percentage change.
The script includes customizable metrics displayed in tables on the chart for easy analysis, with the option to toggle the visibility of each metric.
Key Features:
Volume and Dollar Volume:
Displays the volume of shares traded during the current day (or pre-market, if enabled).
Includes a calculation of dollar volume, representing the total dollar amount of trades (Volume × Close Price).
Relative Volume (RVOL):
Displays RVOL Day, which is the relative volume of the current day compared to the 2-day moving average.
Shows RVOL 90D, indicating relative volume over the past 90 days.
Both RVOL metrics are calculated as percentages and display the percentage change compared to the standard (100%).
Pre-Market Data:
Includes pre-market volume (PVOL) and pre-market dollar volume (P$ VOL) which are displayed only if pre-market data is enabled.
Tracks volume and dollar volume during pre-market hours (4:00 AM to 9:30 AM Eastern Time) for more in-depth analysis.
Optionally, shows pre-market RSI based on volume-weighted close prices.
Average Daily Range (ADR):
Displays the percentage change between the highest and lowest prices over the defined ADR period (default is 20 days).
Average True Range (ATR):
Shows the ATR, a popular volatility indicator, for a given period (default is 14 bars).
RSI (Relative Strength Index):
Displays RSI for the given period (default is 14).
RSI is calculated using pre-market data when available.
QQQ:
Shows the percentage change of the QQQ ETF from the previous day’s close.
The QQQ percentage change is color-coded: green for positive, red for negative, and gray for no change.
Customizable Inputs:
Visibility Options: Toggle the visibility of each metric, such as volume, dollar volume, RVOL, ADR, ATR, RSI, and QQQ.
Pre-Market Data: Enable or disable the display of pre-market data for volume and dollar volume.
Table Positioning: Adjust the position of tables displaying the metrics either at the bottom-left or bottom-right of the chart.
Text Color and Table Background: Choose between white or black text for the tables and customize the background color.
Tables:
The script utilizes tables to display multiple metrics in an organized and easy-to-read format.
The values are updated dynamically, reflecting real-time data as the market moves.
Pre-Market Data:
The script calculates pre-market volume and dollar volume, along with other key metrics like RSI and RVOL, to help assess market sentiment before the market officially opens.
The pre-market data is accumulated from 4:00 AM to 9:30 AM ET, allowing for pre-market analysis and comparison to regular market hours.
User-Friendly and Flexible:
This script is designed to be highly customizable, giving you the ability to toggle which metrics to display and where they appear on the chart. You can easily focus on the data that matters most to your trading strategy.

Magic Candles PRO [MW]The Magic Candles indicator provides users with low risk/high reward entries on small candles with big volume. It uses calculations that uniquely define high volume/low price movement (volume hammer) candles and engulfing pattern candles. In theory, measuring a volume hammer candle seems relatively simple, but it is in the definition of high and low with respect to volume and price movement, and with respect to each other that requires a novel method of defining the relationship. The definition that is ultimately used gives users the ability to identify candles that typically precede large price movements, because the volume necessary to drive the price exists by definition even though it is not reflected in the size of the current candle.
Similarly, engulfing candle patterns are useful because they show an acceleration of price movement from the previous candle. The difficulty in calculating engulfing candles, as with volume hammer candles, is in the interpretation of candle size, or “engulfing”. In many cases, engulfing simply means that a candle has reversed direction from the previous candle, and the body of the previous candle sits between the open and close of the new candle. Sometimes wicks are used, sometimes they aren’t. Our differentiation is that we allow the user to change “engulfing” to their preference, so that it can include candle bodies, full candles, dojis, and candle patterns where the body of the previous candle is not necessarily in between the open and close of the new candle. It also uses a double stochastic calculation on ATRs that filter out engulfing candles that may not be as meaningful.
Settings
Volume Hammer Candles
ATR Period: The ATR period that is used to compare the candle size against. (Default: 5)
Candle Portion to Use: The candle size can be defined as just the body, or the entire candle. (Default: Candle Body)
Volume Absorption Threshold: The threshold for the volume ratio relative to the candle size ratio. (Default: 4.5)
Volume ATR Period: The ATR period that is used to compare the volume against. (Default: 3)
3 Consecutive Volume increases and 3 Bullish Candles: (Default: ON)
3 Consecutive Volume Increases and 3 Bearish Candles: (Default: ON)
2 Consecutive Volume increases Prior to Current Candle: (Default: ON)
Engulfing Pattern Candles
Show Engulfing Candles: (Default: ON)
Include Candle Wicks in Calculation: (Default: ON)
Show Bullish Candles: (Default: ON)
Show Bearish Candles: (Default: ON)
Use Dojis for Reversed Candles: Typically engulfing candles are compared against candles that are in the opposite direction of the new candle. However, dojis, or candles with small candle bodies and relatively large wicks, can be optionally used to measure against. (Default: OFF)
ATR Period 1: We use 2 levels of stochastic calculation to compare against in order to determine if an engulfing candle is valid. This is the shorter period ATR. (Default: 14)
ATR Period 2: The 2nd of 2 ATR periods used in a 2-level stochastic calculation that’s used to evaluate valid engulfing candles. (Default: 21)
Stochastic Period: The Stochastic Period used for both levels of ATR calculations. (Default: 14)
Smoothing: The period used to “smooth” the stochastic curves. (Default: 3)
Calculations
This indicator uses a comparison between relative volume (raw volume compared to its average true range) and relative price action as determined by candle size (specifically, candle size compared to the average true range of the candle size). The ratio between the relative volume and relative price action are compared as a ratio. Once that ratio hits a defined threshold a signal is generated in the form of a bright yellow bar, which we refer to as a “volume hammer”, because of the heavy volume acting on an unmoving object (price).
The indicator also identifies engulfing candle patterns by
Determining the candle body size or full candle size.
Checking to see if there was a reversal of direction, or checking to see if the first candle was a doji (small body with relatively large wicks).
Calculating the stochastic ATR patterns across two periods in order to normalize the ATR behavior for comparison.
Calculating the delta between those stochastic ATRs
Calculating the stochastic patterns of the delta between the stochastic ATRs to add further sensitivity to the comparison between candles.
How to Use
Volume Hammer
When a bright yellow bar appears in the lower window it means that the ratio of relative volume to relative price movement is very high, which indicates that a volatile move will occur within the next candle or so. In this scenario using a small risk that is not much larger than the candle itself can be paired with a large reward/risk ratio when setting a take profit target.
For example, if the body of a candle has a range of less than $0.02 and the full candle is less than $0.10 in range, then a $0.10 stop can be used with the expectation that the large volume will generate a volatile move in one direction or the other. The expected move is generally 3x the size of the full candle, but typically more.
Sometimes, however, that 3x move will reverse and turn into even a larger move in the opposite direction if a key support or resistance level is hit. So, it is very useful to use this indicator with a tool that can identify key support/demand zones and resistance/supply zones such as the Magic Order Blocks or QQQ and SPY Price Levels for equities based on the NASDAQ and S&P 500. It can also be combined with indicators that provide upper and lower bounds like Magic Linear Regression Channel , ATR Bands (Keltner Channel) Wick and SRSI Signals , and/or Bollinger Band Wick and SRSI Signals .
Additionally, the bright yellow candles have color-coded indicators that reflect the behavior of preceding volume behavior.
- Orange Dot - 3 consecutive candles of increasing volume
- Green Dot - 3 consecutive candles of increasing volume with a bullish candle pattern
- Red Dot - 3 consecutive candles of increasing volume with a bearish candle pattern
- Blue Dot - 2 consecutive candles of increasing volume followed by a candle with volume that is greater than the starting candle.
These only reflect the volume and candle pattern. They can provide insight, but should not be used as buy or sell signals, especially when encountered at key price levels.
Engulfing Candle Pattern
Frequently, the bright yellow bar in the lower window will be followed by an engulfing candle in the main chart. Engulfing candle patterns can themselves be useful on their own in a market that is not highly volatile. They tend to be indicative of price reversals, or trend continuations following consolidation. Following an engulfing candle, risk can be set at the “far end” of the candle with the expectation that if it does accurately define the direction, then the price will be less likely to go back to the candle’s starting price.
Other Usage Notes and Limitations
Occasionally a large gray bar will appear that is above the relative volume to relative candle size threshold. This indicates that although there is little price movement when compared to the volume, the actual volume is trailing off. This could lead to a quick move in a bullish or bearish direction, but it potentially would not be as sustained as in the case where volume has been consistently rising.
There are also faded yellow bars that appear when volume is increasing when the relative price movement is small. However, when the ratio of the relative volume is not large enough when compared to the price movement (i.e. it does not meet the threshold requirement) its color remains a dim yellow color.
It's important for traders to be aware of the limitations of any indicator and to use them as part of a broader, well-rounded trading strategy that includes risk management, fundamental analysis, and other tools that can help with reducing false signals, determining trend direction, and providing additional confirmation for a trade decision. Diversifying strategies and not relying solely on one type of indicator or analysis can help mitigate some of these risks.