SPY to ES / MESSPY to ES is an indicator that converts SPY price targets to ES / MES futures price targets.
This indicator is helpful when you have price targets for SPY but trade ES or MES futures instead of SPY. It coverts the SPY price targets to ES / MES futures, and draws the SPY VWAP line on your ES / MES chart.
It supports the following lines
Bullish Above
Bearish Below
Long PT1
Long PT2
Long PT3
Short PT1
Short PT2
Short PT3
It also converts the SPY VWAP to it's current ES / MES value.
Note: The conversion do not work during pre and after market and the lines are only correct during market hours.
Search in scripts for "spy"

SPY VWAPSPY VWAP adds the VWAP indicator for SPY on your current chart, and shows the current SPY VWAP level converted to ES / MES value. It uses the last close price of SPY and ES / MES to calculate the level.
By adding the regular VWAP indicator to your MES / ES chart, you will clearly see the difference between the VWAP of SPY and the futures chart. This is helpful when trading as price may respect both VWAP levels.
This indicator should only be used on ES and MES futures chart. It will behave weirdly if used on different tickers and it is not supported in the current version.

SPY/VXX/TLT RSI crisscrossAre treasuries moving with VIX or are they correlated with equities?
Who's changing faster, VXX or SPY?
The indicator displays the RSI's of SPY, VXX and TLT so you can see how they are moving relative to each other.

SPY to ES or QQQ to NQThis indicator is used to automatically map SPY VWAP and 10 levels of your choice to ES / MES or map QQQ VWAP and 10 levels of your choice to NQ / MNQ . Since SPY and QQQ have the same price action as their futures iteration, there seems to a direct correlation between their levels and VWAP. This indicator is made to easily map the key levels of your choice to the appropriate futures instrument.

SPY/QQQ Customizable Price ConverterThis is a minimalist utility tool designed for Index traders (SPX, NDX, RUT). It allows you to monitor the price of a reference asset (like SPY, QQQ) directly on your main chart without cluttering your screen.
Key Features:
1.🖱️ Crosshair Sync for Historical Data (Highlight): Unlike simple info tables that only show the latest price, this script allows for historical inspection.
· How it works: Simply move your mouse crosshair over ANY historical candle on your chart.
· The script will instantly display the closing price of the reference asset (e.g., SPY) for that specific time in the Status Line (top-left) or the Data Window. Perfect for backtesting and reviewing price action.
2.🔄 Fully Customizable Ticker: Default is set to SPY, but you can change it to anything in the settings.
e.g.
· Trading NDX Change it to QQQ.
· Trading RUT Change it to IWM.
3.📊 Clean Real-Time Dashboard:
· A floating table displays the current real-time price of your reference asset.
· Color-coded text (Green/Red) indicates price movement.
· Fully customizable size, position, and colors to fit your layout.

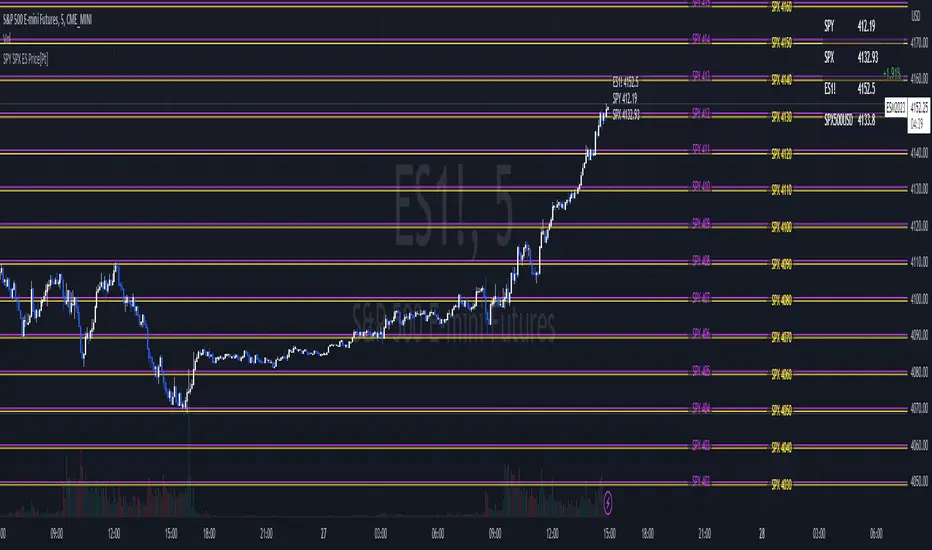
SPY SPX ES Price Converter [Pt]A must have tool for SPY SPX ES traders~!!!
Description
The SPY SPX ES Price Converter is a powerful and easy-to-use tool that allows traders to view corresponding price levels for linked instruments in real-time. This includes SPY, SPX, ES, and SPX500USD. Although these instruments often move in sync, differences in price movements, volume, and trading hours can create unique key levels and support/resistance areas for each. By mapping these levels on the same chart, traders can more easily spot trading opportunities and improve their chances of success.
Customizable features
- multiplier from the closest whole number price level
- line color
- line style
- label position / size
- # of levels to display
- toggle current price display table
SPY Master v1.0This is a simple swing trading algorithm that uses a fast RSI-EMA to trigger buy/cover signals and a slow RSI-EMA to trigger sell/short signals for SPY, an xchange-traded fund for the S&P 500.
The idea behind this strategy follows the premise that most profitable momentum trades usually occur during periods when price is trending up or down. Periods of flat price actions are usually where most unprofitable trades occur. Because we cannot predict exactly when trending periods will occur, the algorithm basically bets money on all trade opportunities during all market conditions. Despite an accuracy rate of only 40%, the algorithm's asymmetric risk/reward profile allows the average winner to be 2x the average loser. The end result is a positive (profitable) net payout.
TRADING RULES:
Buy/Cover = EMA3(RSI2) cross> 50
Sell/Short = EMA5(RSI2) cross< 50
BACKTEST SETTINGS:
- Period = March 2011 - Present
- Initial capital = $10,000
- Dividends excluded
- Trading costs excluded
PERFORMANCE COMPARISON:
There are 657 trades, which means 1,314 orders. Assuming each order costs $2 (what I pay for at Interactive Brokers), total trading costs should be $2,628.
-SPY (buy & hold) = 132.73 ---> 193.22 = +45.57% (dividends excluded)
-SPY Master v1.0 = $12,649 - $2,628 = $10,021 = +100.21%
DISCLAIMER: None of my ideas and posts are investment advice. Past performance is not an indication of future results. This strategy was constructed with the benefit of hindsight and its future performance cannot be guaranteed.

SPY Daily Gamma Levels [Manual Input With Alerts]Overview This indicator plots key options-based support and resistance levels (Gamma Exposure / GEX) directly on your chart. Unlike standard technical analysis, these levels (Call Wall, Gamma Flip, Put Support, and Volatility Trigger) represent where Market Makers are positioned, often acting as "magnets" or "repellents" for price action.
Important Note: TradingView Pine Script cannot currently access external options open interest data natively. Therefore, this is a Manual Input Indicator. You must update the four price levels in the settings each morning before the market opens.
Key Features:
4 Key Levels: Plots the Call Wall, Gamma Flip (Zero Gamma), Put Support, and Volatility Trigger.
Auto-Cleaning: Automatically deletes yesterday's lines to keep your chart clean; lines only show for the current session.
Alerts Included: Built-in alert conditions allow you to set notifications when price crosses the Gamma Flip or breaks the Vol Trigger.
Customization: Fully customizable colors and line styles.
Best Practices:
Timeframe: Works best on 15-minute charts for trend identification and 5-minute charts for entry execution.
Strategy:
Above Gamma Flip: Market generally stabilizes; dealers buy dips.
Below Gamma Flip: Volatility expands; dealers sell rips.
Below Vol Trigger: "Danger Zone" – expect accelerated selling pressure.
How to Get the Data (The AI Workflow)
Since these numbers change daily, I use Google Gemini to fetch the data and remind me every morning. Here is how you can set up the same automated workflow:
1. The Prompt You can ask Gemini (or your preferred AI) the following prompt manually each morning:
"Find the daily SPY Call Wall, Gamma Flip, Put Support, and Vol Trigger levels for today to input into my TradingView indicator."
2. Automating the Routine I have set up a scheduled daily reminder with Gemini. To do this yourself, simply ask Gemini:
"Can you schedule a daily task to search for these SPY Gamma levels and send them to me every morning at 8:00 AM?"
3. Updating the Chart
Receive the notification from the AI.
Open the Indicator Settings in TradingView.
Type in the new numbers.
The chart updates instantly.
Disclaimer: This tool is for educational purposes only. Gamma levels are estimates based on Open Interest and Dealer Gamma exposure models. Always manage your risk.

SPY Expected Move by VIXThis indicator shows 1 and 2 standard deviation price move from the VWAP based on VIX. Implied Volatility (IV) is being used extensively in the Option world to project the Expected Move for the underlying instrument. VIX is used as a proxy for SPY's IV for 30 days.
This indicator is meaningful only for SPY but can be used in any other instrument which has a strong correlation to SPY.

SPY BackgroundColors background green if AMEX:SPY 1 day performance is positive
Colors background red if AMEX:SPY 1 day performance is negative

SPY/TLT Strategy█ STRATEGY OVERVIEW
The "SPY/TLT Strategy" is a trend-following crossover strategy designed to trade the relationship between TLT and its Simple Moving Average (SMA). The default configuration uses TLT (iShares 20+ Year Treasury Bond ETF) with a 20-period SMA, entering long positions on bullish crossovers and exiting on bearish crossunders. **This strategy is NOT optimized and performs best in trending markets.**
█ KEY FEATURES
SMA Crossover System: Uses price/SMA relationship for signal generation (Default: 20-period)
Dynamic Time Window: Configurable backtesting period (Default: 2014-2099)
Equity-Based Position Sizing: Default 100% equity allocation per trade
Real-Time Visual Feedback: Price/SMA plot with trend-state background coloring
Event-Driven Execution: Processes orders at bar close for accurate backtesting
█ SIGNAL GENERATION
1. LONG ENTRY CONDITION
TLT closing price crosses ABOVE SMA
Occurs within specified time window
Generates market order at next bar open
2. EXIT CONDITION
TLT closing price crosses BELOW SMA
Closes all open positions immediately
█ ADDITIONAL SETTINGS
SMA Period: Simple Moving Average length (Default: 20)
Start Time and End Time: The time window for trade execution (Default: 1 Jan 2014 - 1 Jan 2099)
Security Symbol: Ticker for analysis (Default: TLT)
█ PERFORMANCE OVERVIEW
Ideal Market Conditions: Strong trending environments
Potential Drawbacks: Whipsaws in range-bound markets
Backtesting results should be analyzed to optimize the MA Period and EMA Filter settings for specific instruments

SPY Sub-Sector Daily Money Flow TableThis calculates the dollar volume per candlestick (2nd row) and cumulative (3rd row) of the entire trading day for each subsector of the SPY.
The 'Total' column is the total of all the subsectors combined. It is calculated separately from SPY volume.
The money flow is calculated with (open+close)/2 which means different timeframes yield different results and won't be especially accurate day-by-day. This is useful to quickly see rotation and possible divergences.
Enjoy!

SPY RelativeShows an instrument's sentiment in a day (or week) compared to the market (SPY default). The Red line shows bearish sentiment compared to the market and the green is bullish. Technically this works like a proxy for Alpha/Beta factor.

QQQ and SPY Price Levels [MW]Introduction:
Don’t let SPY and QQQ resistance levels hurt your futures trading anymore. The QQQ and SPY Price Levels indicator automagically provides easily accessible QQQ price levels for NASDAQ-related charts such as QQQ, /NQ and /MNQ futures, and leveraged ETFs such as TQQQ and SQQQ as well as for SPY price levels for S&P 500-related charts such as SPY, /ES and /MES futures, SPX, and leveraged ETFs such as UPRO and SPXU. If you’ve ever traded futures, or anything QQQ- or SPY-related and wanted to know at what price would the corresponding asset reach a key whole number level of QQQ or SPY, like 400, 440, 445, or even 447.50, this tool is for you. Key 10x, 5x, and even 2.5x multiples of QQQ and SPY can act as support or resistance for other related-assets. Until now, there hasn’t been an indicator that can serve as an easy visual cue to know exactly when that is about to happen across assets.
This indicator is a fork of the original SPY Price Levels indicator, which only considered SPY-related assets.
Settings:
QQQ/SPY 2.5x: Show closest levels above and below that are multiples of 2.5 on QQQ
QQQ/SPY 5x: Show closest levels above and below that are multiples of 5 on QQQ
QQQ/SPY 10x: Show closest levels above and below that are multiples of 10 on QQQ
Show QQQ/SPY Price Label: Show the current QQQ/SPY price
Extend lines to the left: Extend label lines for each price level to the beginning of the chart
Calculations:
This indicator defines the ratio between the price of QQQ/SPY and another NASDAQ/S&P-related asset and uses that multiplier once the user-defined price increments are defined. For example, if /MNQ is at 19000 and QQQ is at 465, then the ratio would be 40.8.
The incremental QQQ levels that are above and below the QQQ price are calculated using the following equations:
qqqLevelUp = _multiplier * math.ceil(_qqqClose / _multiplier)
qqqLevelDown = _multiplier * math.floor(_qqqClose / _multiplier)
The conversion ratio is then multiplied by that amount to get the final estimated corresponding price using the calculation:
levelUp := _conversion * qqqLevelUp
levelDown := _conversion * qqqLevelDown
For leveraged assets, the conversion must be used on the difference between the current QQQ price and the incremental upper and lower levels.
For example, the calculation for the next level up looks like the following:
levelUpDelta := math.abs(_qqqClose - qqqLevelUp)
levelUp := close + _conversion * (levelUpDelta * _leverage)
This logic is identical for SPY-related assets.
How to Use:
The QQQ and SPY Price Levels indicator aims to be as unobtrusive as possible. The default view shows 3 labels and 2 lines that are all aligned to the right of the main chart, so that it interferes as little as possible with any other indicators. It can be added to any /NQ or /MNQ futures chart, SQQQ, TQQQ, and, of course, QQQ as well as any /ES /MES futures chart, SPXU, UPRO, SPX, and of course SPY. The most immediate price levels for each multiplier appears above and below the current price along with the price of QQQ/SPY.
For example, MNQU2024 is currently at 19594. By looking at the indicator the next QQQ increment below is at 475, or 19556 on the MNQU2024 chart. This potential support is marked with a green label that shows both prices. The next increment above is at QQQ 477.50, or 19659 on the MESU2024 chart. And the QQQ price itself, is also shown (and can be removed) at 475.92.
QQQ and SPY price increments of 2.5, 5, and 10 tend to consistently act at the very least as emotional support and resistance levels. Weak, or weakening volume and/or momentum when these levels are hit can trigger a strong rejection, and can sometimes precipitate lengthy consolidation periods at those levels. Watching an NASDAQ- and S&P 500-related asset come to a halt, fall off a cliff, or react in some other unintuitive way could very well be the result of a QQQ/SPY level being reached. Even though many of us know that this relationship exists, it’s easy to forget. So, this indicator helps to ensure that its users keep that relationship front and center.
By extending the lines into the past on QQQ/SPY and their related assets, you can see what reactions happened at these key levels.
Other Usage Notes and Limitations:
The calculations used only provide an estimated relationship or a close approximation, and are not exact.
It's important for traders to be aware of the limitations of any indicator and to use them as part of a broader, well-rounded trading strategy that includes risk management, fundamental analysis, and other tools that can help with reducing false signals, determining trend direction, and providing additional confirmation for a trade decision. Diversifying strategies and not relying solely on one type of indicator or analysis can help mitigate some of these risks.

TwinPulse Q Lead SPY x QQQ Intermarket Pulse 1HTwinPulse Q Lead is a concise one hour indicator for SPY and QQQ that converts three sources of market information into a single pulse line, a mode readout with BUY SELL WAIT, and compact alerts. It blends intermarket leadership between QQQ and SPY, intraday flow from the slope of session VWAP, and where the current price sits inside the regular trading hours range. The three components are normalized, fused, compressed to a stable range, and smoothed for clear thresholds. The aim is a readable intraday regime signal that helps you decide when to participate and when to stand aside.
The script is built with Pine v6, uses request security with lookahead off, and does not repaint. It is an indicator, not a strategy. It does not contain any solicitation, links, or outside references. The description is self contained and explains both logic and use so that any trader can understand the design without reading code.
What makes this original and useful
Intermarket leadership is measured directly from QQQ and SPY on your working timeframe using a Z score of the return spread. When growth is leading value heavy large caps, leadership turns positive. When it lags, leadership turns negative. This gives a real time read of the Nasdaq versus S and P tug of war that most day traders watch informally.
Intraday flow is taken from the slope of the session VWAP. A linear regression of VWAP over a short window captures whether value is rising or falling inside the day. Dividing by ATR normalizes slope by typical movement so that the signal is comparable across weeks.
Session position places price inside the current regular hours high to low. It answers whether the day is trading in the top half, the bottom half, or the middle. This is a simple but powerful context filter for breakouts and fades.
The three components are fused into one pulse, compressed with either hyperbolic tangent or softsign to keep values bounded, and then smoothed by a short EMA. This yields a stable range with a zero line so the eye can read shifts quickly.
The panel shows a human readable mode with reasons and a strength score. Traders who do not want to read lines can rely on a simple state and a compact justification that explains why the state is set.
This is not a mashup that simply overlays unrelated indicators. Each component was chosen to answer a distinct question that is common to SPY and QQQ intraday decision making. Leadership answers who is in charge, flow answers whether value inside the session is building or leaking, and position answers if price is pressing the extremes or circling the middle. The pulse ties the three together and prevents any single component from dominating.
How the calculations work
Leadership. Compute a short rate of change for SPY and QQQ. Subtract SPY from QQQ to get spread returns, then compute a rolling Z score over a longer window. Positive values mean QQQ is leading. Negative values mean SPY is leading.
Flow. Compute session VWAP on the active symbol. Regress VWAP over a short window to obtain a slope estimate. Divide by ATR to scale slope by current volatility so that a small rise on a quiet day is not treated the same as a small rise on a wild day.
Position. Track the highest high and lowest low since the start of regular hours. Place the current close inside that range on a zero to one scale, then recenter to a minus one to plus one scale. Positive means the top half of the day, negative means the bottom half.
Fusion. Multiply each component by a weight so users can emphasize or de emphasize leadership, flow, or position. Sum to a raw pulse.
Compression. Pass the raw pulse through a bounded function. Hyperbolic tangent is smooth and has natural saturation near the extremes. Softsign is faster and behaves like a smoother version of sign near zero. Compression avoids unbounded excursions and makes thresholds meaningful across days.
Smoothing. Apply a short EMA to the compressed pulse to reduce noise. This creates the main line called TwinPulse in the plot.
Thresholds. You can use static symmetric levels or adaptive levels. The adaptive option computes a mean and a standard deviation of the smoothed pulse over a user window, then sets upper and lower thresholds as mean plus or minus sigma times standard deviation. This allows thresholds to adjust across regimes. Static levels are still available for traders who want repeatable levels.
Events and mode. A long event fires when the smoothed pulse crosses the upper threshold with positive flow and any optional filters agree. A short event fires on the symmetric condition. The mode reads the current state rather than fire and forget. It returns BUY when the smoothed pulse is above the upper threshold with positive flow, SELL when the smoothed pulse is below the lower threshold with negative flow, otherwise WAIT. A cooldown controls how often events can fire so alerts do not spam during choppy periods.
Inputs and default values
The script ships with defaults chosen for SPY and QQQ on one hour charts.
Symbols. SPY and QQQ by default. You can switch to any pair. Many users may test IWM versus SPY for small cap reads.
Regular hours selector. On by default. This restricts the position factor to New York regular hours. Turn it off if you prefer full session behavior.
ROC length is three bars. Z score length is fifty bars. VWAP slope window is ten bars. ATR length is fourteen bars. Pulse smoothing length is three bars.
Compression mode. Choose hyperbolic tangent or softsign. Hyperbolic tangent is default.
Weights. Leadership and flow are one by default. Position is set to zero point seven to give a modest influence to where price sits inside the day.
Thresholds. Adaptive thresholds are on by default with a lookback of one hundred bars and a sigma width of zero point eight. Static levels at plus or minus zero point six are ready if you disable adaptive mode.
Filters. ADX filter is off by default. If you enable it, the script requires ADX above a user minimum before it will signal. Higher time frame confirmation is off by default. When enabled it compares the smoothed pulse on the confirm timeframe to zero and requires alignment for longs or shorts.
Cooldown. Three bars by default so that alerts do not trigger too frequently.
UI. Bar coloring is on by default. The panel is on by default and sits at the top right.
All request security calls use lookahead off and will not request future data. All persistent state variables are assigned in a way that prevents repainting. The indicator does not use non standard chart types in its logic.
How to use the indicator
Load a one hour chart of SPY or QQQ. Keep a clean chart so that the script output is easy to read.
Turn on regular hours if you want the session position to reflect the cash session. This is recommended for SPY and QQQ.
Watch the panel. Mode reads BUY or SELL or WAIT. The strength value is a simple vote based score that ranges from zero to one hundred. It counts leadership, flow, ADX if enabled, and higher time frame confirmation if enabled. You can use strength to filter weak states.
Consider action only when mode is BUY or SELL and the signal has not just fired on the last bar. The triangles mark where an event fired. Alerts use the same logic as the events. WAIT means stand aside.
To slow the system, enable ADX and set a higher minimum or enable higher time frame confirmation. To speed it up, disable the filters, disable adaptive thresholds, or tighten the sigma width.
When publishing, use a clean chart with only this indicator. Show the symbol and timeframe clearly and make sure the plot legend is visible. If you add drawings on the chart, only include ones that help readers understand the output.
Publication notes and compliance
This description is written in English. The title uses ASCII and only uses capital letters for common abbreviations. The script is original and explains how and why the components work together. There are no links or promotional material. The script does not claim performance. It does not use lookahead. The panel and alerts exist to help a human read and act with discipline. The indicator can be published as open source or as protected. If you choose protected, the description still allows readers to understand how the logic works without access to the code.
If you later convert the logic into a strategy for publication, use realistic commission and slippage, risk no more than a small share of equity per trade, and choose a dataset that yields a large enough sample. Explain any deviations from these default recommendations in your strategy description. Do not publish results from non standard chart types since they can mislead readers on signal timing.
Limitations and risks
Intermarket leadership is a relative measure. There are hours when both SPY and QQQ fall while leadership remains positive. Treat leadership as a context, not a stand alone trigger.
VWAP slope is a path measure inside the session. It can flip several times on a choppy day. That is why the script uses a short smoothing and an optional cooldown. Use ADX or higher time frame confirmation to avoid the worst chop.
Session position assumes a meaningful regular hours range. On half days or around openings with gaps the position factor can be less informative. If this bothers you, reduce the weight of position or turn it off.
Compression and smoothing introduce lag by design. The goal is stability and clarity. If you want earlier but noisier signals, reduce smoothing and weights, and use static thresholds.
No indicator guarantees future results. TwinPulse Q Lead is a decision aid. It should be combined with your risk rules, position size policy, and a clear exit plan. Past behavior is not a promise for the future.
Frequently asked questions
What symbols are supported. Any symbol can be used as the chart symbol. Leadership uses the two user symbols which default to SPY and QQQ. Many traders may try IWM versus SPY or DIA versus SPY.
Can I change the timeframe. Yes, but the design target is one hour. On very short timeframes the VWAP slope becomes very sensitive and you should consider stronger filters.
Does the script repaint. No. It uses request security with lookahead off and the panel updates on the last bar only. Events are based on bar close conditions unless you attach alerts on any alert function call which will still respect the logic without looking into the future.
How are the strength numbers built. The strength score is the share of aligned votes across leadership, flow, ADX if enabled, and higher time frame confirmation if enabled. A value near one hundred means many filters agree. A value near fifty means partial alignment. It is not a probability or an accuracy number.
Can I use non standard chart types. You can view the indicator on them but do not publish signals from non standard chart types because that can mislead readers about timing. Use classic candles or bars when you publish and when you test.
Why do I sometimes see BUY but the price is not moving. A BUY mode requires pulse above the upper threshold and positive flow. It does not require higher highs immediately. Treat BUY as a permission to look for entries using your own execution rules.

Top 40 High Low Strategy for SPY, 5minThis strategy is developed based on my High Low Index SPY Top 40 indicator
Notes:
- this strategy is only developed for SPY on the 5 min chart . It seems to work with QQQ as well, but it isn't optimized for it
- P/L shown is based on 10 SPY option contracts, call or put, with strike price closest to the entry SPY price and expiry of 0 to 1 day. This includes commissions (can be changed). This is only an estimate calculated using an arbitrary multiplier factor, this can be changed in the setting
- P/L is based on $5000 initial capital
- Works with both regular / extended trading session turned on/off. However, max drawdown is 1/2 with extended trading session ON
- there is still a bug that doesn't allow alert to be created due to calculation error, will update once fixed
This strategy combines signals from the following indicators to determine entry signals:
- High Low Index SPY Top 40
- MACD
- Linear Regression Slope
Entry signal is triggered when:
- High Low Index line crosses the EMA line
- MACD trending in the same direction
- Linear Regression slope is accelerating above a threshold in the same direction, indicating a strong trend
Profit target(PT) and stop loss(SL) are determined using ATR value, with 2:1 Reward to Risk ratio as default.
Exit signal may be triggered prior to PT or SL trigger when:
- High Low Index SPY Top 40 shows a reversal after overbought or oversold conditions (optional)
- Opposite entry signal is triggered
There are a number of optional settings:
- Turn on/off "option trading", P/L will be calculated using share price only without multiplication factor for trading option contracts
- # of options per trade, default to 10
- Reinvest with profit made
- Trade with trailing SL after PT hit
- Take profit early based on Top 40 overbought/oversold
- Trade 0/1 day expiry. This will signal exit by the end of the day on Mon/Wed/Fri, and only exits 1/2 of positions (if in profit) on Tues/Thurs
- Can reduce the SL level without impacting PT
- No entry between 10:05 - 10:20 (don't ask me why, but statistically it performs better)
Consider donating me some of your profit if you make $$$ hahaha~ ;)
Enjoy~~

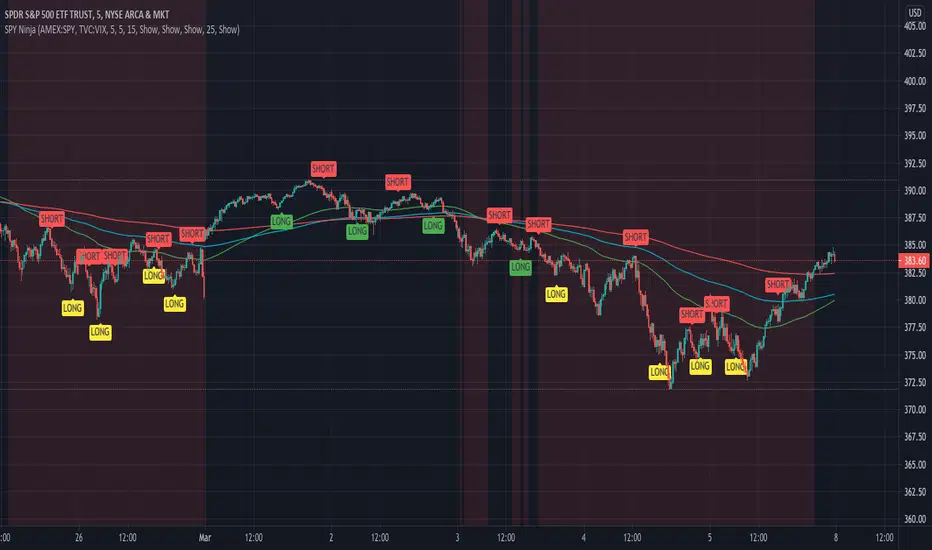
SPY Ninja
SPY Ninja correlates the true strength index exponential moving averages of SPY and VIX together. In doing so we can determine the start of trend shifts via SPY / VIX convergence in addition to crossover, with potential market entries and exits represented by the LONG and SELL signals.
SMMA 50,100, and 200 have been added to chart due to the historic SPY market reactivity to these moving averages. They often act as natural support and resistance levels with SPY, and when coinciding LONG and SHORT signals appear touching any of these levels, it adds an extra layer of confidence for traders' decisions. Also, by highlighting the areas on our SPY chart (red background areas) that represent a VIX threshold higher than 25, we can bring attention to areas with potentially higher volatility immediately so that traders know to proceed with caution.
SPY Ninja works harmoniously with the SPY Ninja Oscillator; Ninja provides the signals highlighting risky VIX areas of concern, while the Ninja Oscillator adds an additional 3 levels of potential confirmation for your trade decisions.
TICK Scalping strategy, SPY 1 min1 min chart scalping version of my other TICK strategy with adjusted parameters and additional entry and exit conditions better suited for 1 min SPY chart. Please refer to my original TICK strategy for explanation.
Important notes:
1. This strategy is designed for same day SPY option scalping on the 1 min chart . All profit shown in back testing report is based on Profit/Loss (P/L) estimates from trading options with approximately 6 weeks of data. By default, it is set to 10 option contracts. By default the initial capital is set to $5000. Pyramiding is set to 3.
2. This strategy works better with non-extended market data .
3. This strategy is mainly developed for SPY trading on 1 min chart, it probably will not be very profitable with other tickers or time frame without tweaking all the parameters first.
Cheers and enjoy~! Let's all make money~!!

US/SPY- Financial Regime Index Swing Strategy Credits: concept inspired by EdgeTools Bloomberg Financial Conditions Index (Proxy)
Improvements: eight component basket, inverse volatility weights, winsorization option( statistical technique used to limit the influence of outliers in a dataset by replacing extreme values with less extreme ones, rather than removing them entirely), slope and price gates, exit guards, table and gradients.
Summary in one paragraph
A macro regime swing strategy for index ETFs, futures, FX majors, and large cap equities on daily calculation with optional lower time execution. It acts only when a composite Financial Conditions proxy plus slope and an optional price filter align. Originality comes from an eight component macro basket with inverse volatility weights and winsorized return z scores that produce a portable yardstick.
Scope and intent
Markets: SPY and peers, ES futures, ACWI, liquid FX majors, BTC, large cap equities.
Timeframes: calculation daily by default, trade on any chart.
Default demo: SPY on Daily.
Purpose: convert broad financial conditions into clear swing bias and exits.
Originality and usefulness
Unique fusion: return z scores for eight liquid proxies with inverse volatility weighting and optional winsorization, then slope and price gates.
Failure mode addressed: false starts in chop and early shorts during easy liquidity.
Testability: all knobs are inputs and the table shows components and weights.
Portable yardstick: z scores center at zero so thresholds transfer across symbols.
Method overview in plain language
Base measures
Return basis: natural log return over a configurable window, standardized to a z score. Winsorization optional to cap extremes.
Components
EQ US and EQ GLB measure equity tone.
CREDIT uses LQD over HYG. Higher credit quality outperformance is risk off so sign is flipped after z score.
RATES2Y uses two year yield, sign flipped.
SLOPE uses ten minus two year yield spread.
USD uses DXY, sign flipped.
VOL uses VIX, sign flipped.
LIQ uses BIL over SPY, sign flipped.
Each component is smoothed by the composite EMA.
Fusion rule
Weighted sum where weights are equal or inverse volatility with exponent gamma, normalized to percent so they sum to one.
Signal rule
Long when composite crosses up the long threshold and its slope is positive and price is above the SMA filter, or when composite is above the configured always long floor.
Short when composite crosses down the short threshold and its slope is negative and price is below the SMA filter.
Long exit on cross down of the long exit line or on a fresh short signal.
Short exit on cross up of the short exit line or on a fresh long signal, or when composite falls below the force short exit guard.
What you will see on the chart
Markers on suggestion bars: L for long, S for short, LX and SX for exits.
Reference lines at zero and soft regime bands at plus one and minus one.
Optional background gradient by regime intensity.
Compact table with component z, weight percent, and composite readout.
Table fields and quick reading guide
Component: EQ US, EQ GLB, CREDIT, RATES2Y, SLOPE, USD, VOL, LIQ.
Z: current standardized value, green for positive risk tone where applicable.
Weight: contribution percent after normalization.
Composite: current index value.
Reading tip: a broadly green Z column with slope positive often precedes better long context.
Inputs with guidance
Setup
Calc timeframe: default Daily. Leave blank to inherit chart.
Lookback: 50 to 1500. Larger length stabilizes regimes and delays turns.
EMA smoothing: 1 to 200. Higher smooths noise and delays signals.
Normalization
Winsorize z at ±3: caps extremes to reduce one off shocks.
Return window for equities: 5 to 260. Shorter reacts faster.
Weighting
Weight lookback: 20 to 520.
Weight mode: Equal or InvVol.
InvVol exponent gamma: 0.1 to 3. Higher compresses noisy components more.
Signals
Trade side: Long Short or Both.
Entry threshold long and short: portable z thresholds.
Exit line long and short: soft exits that give back less.
Slope lookback bars: 1 to 20.
Always long floor bfci ≥ X: macro easy mode keep long.
Force short exit when bfci < Y: macro stress guard.
Confirm
Use price trend filter and Price SMA length.
View
Glow line and Show component table.
Symbols
SPY ACWI HYG LQD VIX DXY US02Y US10Y BIL are defaults and can be changed.
Realism and responsible publication
No performance claims. Past is not future.
Shapes can move intrabar and settle on close.
Execution is on standard candles only.
Honest limitations and failure modes
Major economic releases and illiquid sessions can break assumptions.
Very quiet regimes reduce contrast. Use longer windows or higher thresholds.
Component proxies are ETFs and indexes and cannot match a proprietary FCI exactly.
Strategy notice
Orders are simulated on standard candles. All security calls use lookahead off. Nonstandard chart types are not supported for strategies.
Entries and exits
Long rule: bfci cross above long threshold with positive slope and optional price filter OR bfci above the always long floor.
Short rule: bfci cross below short threshold with negative slope and optional price filter.
Exit rules: long exit on bfci cross below long exit or on a short signal. Short exit on bfci cross above short exit or on a long signal or on force close guard.
Position sizing
Percent of equity by default. Keep target risk per trade low. One percent is a sensible starting point. For this example we used 3% of the total capital
Commisions
We used a 0.05% comission and 5 tick slippage
Legal
Education and research only. Not investment advice. Test in simulation first. Use realistic costs.

TriAnchor Elastic Reversion US Market SPY and QQQ adaptedSummary in one paragraph
Mean-reversion strategy for liquid ETFs, index futures, large-cap equities, and major crypto on intraday to daily timeframes. It waits for three anchored VWAP stretches to become statistically extreme, aligns with bar-shape and breadth, and fades the move. Originality comes from fusing daily, weekly, and monthly AVWAP distances into a single ATR-normalized energy percentile, then gating with a robust Z-score and a session-safe gap filter.
Scope and intent
• Markets: SPY QQQ IWM NDX large caps liquid futures liquid crypto
• Timeframes: 5 min to 1 day
• Default demo: SPY on 60 min
• Purpose: fade stretched moves only when multi-anchor context and breadth agree
• Limits: strategy uses standard candles for signals and orders only
Originality and usefulness
• Unique fusion: tri-anchor AVWAP energy percentile plus robust Z of close plus shape-in-range gate plus breadth Z of SPY QQQ IWM
• Failure mode addressed: chasing extended moves and fading during index-wide thrusts
• Testability: each component is an input and visible in orders list via L and S tags
• Portable yardstick: distances are ATR-normalized so thresholds transfer across symbols
• Open source: method and implementation are disclosed for community review
Method overview in plain language
Base measures
• Range basis: ATR(length = atr_len) as the normalization unit
• Return basis: not used directly; we use rank statistics for stability
Components
• Tri-Anchor Energy: squared distances of price from daily, weekly, monthly AVWAPs, each divided by ATR, then summed and ranked to a percentile over base_len
• Robust Z of Close: median and MAD based Z to avoid outliers
• Shape Gate: position of close inside bar range to require capitulation for longs and exhaustion for shorts
• Breadth Gate: average robust Z of SPY QQQ IWM to avoid fading when the tape is one-sided
• Gap Shock: skip signals after large session gaps
Fusion rule
• All required gates must be true: Energy ≥ energy_trig_prc, |Robust Z| ≥ z_trig, Shape satisfied, Breadth confirmed, Gap filter clear
Signal rule
• Long: energy extreme, Z negative beyond threshold, close near bar low, breadth Z ≤ −breadth_z_ok
• Short: energy extreme, Z positive beyond threshold, close near bar high, breadth Z ≥ +breadth_z_ok
What you will see on the chart
• Standard strategy arrows for entries and exits
• Optional short-side brackets: ATR stop and ATR take profit if enabled
Inputs with guidance
Setup
• Base length: window for percentile ranks and medians. Typical 40 to 80. Longer smooths, shorter reacts.
• ATR length: normalization unit. Typical 10 to 20. Higher reduces noise.
• VWAP band stdev: volatility bands for anchors. Typical 2.0 to 4.0.
• Robust Z window: 40 to 100. Larger for stability.
• Robust Z entry magnitude: 1.2 to 2.2. Higher means stronger extremes only.
• Energy percentile trigger: 90 to 99.5. Higher limits signals to rare stretches.
• Bar close in range gate long: 0.05 to 0.25. Larger requires deeper capitulation for longs.
Regime and Breadth
• Use breadth gate: on when trading indices or broad ETFs.
• Breadth Z confirm magnitude: 0.8 to 1.8. Higher avoids fighting thrusts.
• Gap shock percent: 1.0 to 5.0. Larger allows more gaps to trade.
Risk — Short only
• Enable short SL TP: on to bracket shorts.
• Short ATR stop mult: 1.0 to 3.0.
• Short ATR take profit mult: 1.0 to 6.0.
Properties visible in this publication
• Initial capital: 25000USD
• Default order size: Percent of total equity 3%
• Pyramiding: 0
• Commission: 0.03 percent
• Slippage: 5 ticks
• Process orders on close: OFF
• Bar magnifier: OFF
• Recalculate after order is filled: OFF
• Calc on every tick: OFF
• request.security lookahead off where used
Realism and responsible publication
• No performance claims. Past results never guarantee future outcomes
• Fills and slippage vary by venue
• Shapes can move during bar formation and settle on close
• Standard candles only for strategies
Honest limitations and failure modes
• Economic releases or very thin liquidity can overwhelm mean-reversion logic
• Heavy gap regimes may require larger gap filter or TR-based tuning
• Very quiet regimes reduce signal contrast; extend windows or raise thresholds
Open source reuse and credits
• None
Strategy notice
Orders are simulated by TradingView on standard candles. request.security uses lookahead off where applicable. Non-standard charts are not supported for execution.
Entries and exits
• Entry logic: as in Signal rule above
• Exit logic: short side optional ATR stop and ATR take profit via brackets; long side closes on opposite setup
• Risk model: ATR-based brackets on shorts when enabled
• Tie handling: stop first when both could be touched inside one bar
Dataset and sample size
• Test across your visible history. For robust inference prefer 100 plus trades.

Multi-Ticker RS vs SPYThis Pine Script, titled "Multi-Ticker RS vs SPY," is a clean and efficient indicator designed for TradingView, enabling traders to monitor the relative strength (RS) of up to 10 ticker symbols compared to the S&P 500 ETF (SPY) on a single chart. Ideal for options traders, such as those managing a $1,400 account, it provides a simple way to assess which stocks are outperforming or underperforming the broader market. As of February 26, 2025, the script supports any chart timeframe, such as 5-minute or daily intervals, and calculates RS based on a user-defined lookback period, defaulting to 1 bar for real-time insights.
Users can input ticker symbols via customizable settings, with defaults set to popular stocks like AAPL, TSLA, NVDA, GOOGL, AMZN, MSFT, FB, NFLX, INTC, and PYPL. The script fetches closing prices for each ticker and SPY, computes their percentage changes over the lookback period, and determines RS as the ratio of each ticker’s change to SPY’s change, handling division by zero gracefully. It displays each ticker’s current RS score in a vertical column of labels on the chart’s top-left corner, updated on the last bar to avoid clutter. Users can adjust label size (tiny, small, normal, large) and text color for visibility, ensuring a tailored, error-free experience for quick market analysis.

High Low Index SPY Top 40Modification from original code for "High Low Index" by © LonesomeTheBlue
- Made modification specifically for Top 40 AMEX:SPY holdings
- Added Market sentiment histogram (Total count green vs red), and SMA line for it
- Added arrows for peaks and dips on High Low Index and Market Sentiment MA
Idea behind this indicator is that SPY should follow the overall sentiment of its top holdings. I believe this bring great value to SPY traders.
Enjoy~!

Free Strategy #08 (Combo of #01 and #02) (ES / SPY)This strategy was designed to be traded on daily data on the ES and SPY—the strategy was originally developed for NinjaTrader, which displays daily ES data based on RTH hours instead of 24 hours (1440 minute) like TradingView does, so we are presenting the results on the SPY until we figure out how to overcome this hurdle.
The strategy combines the two ideas from strategy #01 and strategy #02 .
Strategy #08
Quantity 100
Slippage: 2 ticks
Commission: 4.95 per order
Net Profit: 26,044.60
Max Drawdown: 3,947.60
Buy and Hold (Custom)
Quantity 100
Slippage: 2 ticks
Commission: 4.95 per order
Entry Long: 1993-02-01 @ 43.99
Exit Long: 2017-07-28 @ 246.34
Net Profit: 20,225.10
Max Drawdown: 9,042.00
